Oilfield Scale Inhibitor Market by Type (Phosphonates, Carboxylate/Acrylic, Sulfonates, and Others), and by Region (North America, Europe, Asia-Pacific, Middle East, Africa, and South America) - Global Forecast to 2020


The global oilfield scale inhibitor market was valued at USD 509.4 Million in 2014 and is expected to witness a CAGR of 5.40% between 2015 and 2020. Factors driving the market of oilfield scale inhibitor include increasing demand from the oil and gas industry, wide availability of scale inhibitors, rising demand for biodegradable and environment-compatible scale inhibitors, and so on.
The oilfield scale inhibitor market is mainly segmented on the basis of type and region. The years considered for the report are:
- Base Year- 2014
- Estimated Year- 2015
- Projected Year- 2020
- Forecast Period- 2015-2020
The base year used for company profiles is 2014; where the information was not available for the base year, the prior year was taken into consideration.
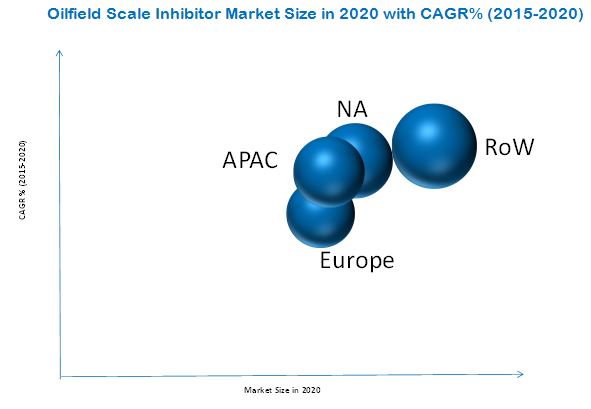
The oilfield scale inhibitor market is experiencing strong growth and is mainly driven by regions, such as RoW, North America, Asia-Pacific, and Europe. Considerable amount of investments are made by different market players to serve the end-user applications of scale inhibitors. The global market is segmented into major geographic regions, such as North America, Europe, Asia-Pacific, and Rest of the World (RoW). The market has also been segmented on the basis of type. On the basis of type of scale inhibitors, the market is sub-divided into phosphonates, carboxylate/acrylate, sulfonates, and others.
Research Methodology:
Various secondary sources, such as encyclopedia, directories, and databases have been referred to identify and collect information useful for this extensive, commercial study of the market. The primary sources, which include experts from related industries as well as key suppliers, have been interviewed to obtain and verify critical information as well as to assess the future prospects of the oilfield scale inhibitor market.
The research methodology adopted in this report is explained below:
- Top-down and bottom-up approaches were used to estimate and validate market sizes of the oilfield scale inhibitor market
- The market size, in terms of value, is calculated by using an average price derived per Kg, and then multiplying it with scale inhibitors consumption in different regions. Later, using the bottom-up approach, the global market size, in terms of value, for oilfield scale inhibitor was calculated.
- The top-down approach was used to estimate the sizes of other individual markets (mentioned in the market segmentation by type and region) via percentage splits from secondary and primary research. For calculation of a particular market segment, the most immediate parent market size was estimated for implementing the top-down approach.
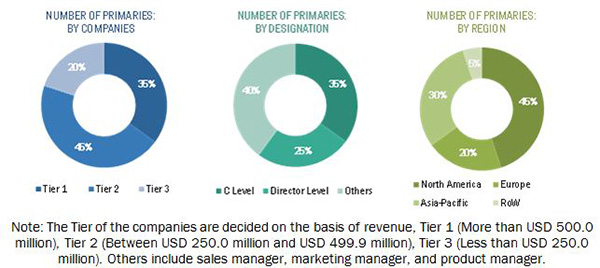
The data were triangulated by studying various factors and trends from the demand and supply sides. The market size was validated using both top-down and bottom-up approaches, and the data were verified through primary interviews. After arriving at the overall market size, the total market has been split into several segments and sub-segments. The figure below shows the break-down of the primaries on the basis of company, designation, and region, conducted during the research study.
Market Ecosystem:
The ecosystem for the oilfield scale inhibitor market consists of suppliers of key raw materials, such as calcium, barium, phosphorous, and other chemicals. Many companies, such as Dow Chemical, BASF SE, Kemira OYJ, Solvay S.A., and others have a backward integrated network to meet their production demands. During the oil and gas activities, scale depositions affect the production of oil from the well. Scale inhibitors are widely used in the oil and gas industry to remove these scales.
Target Audience of the Report:
The target audience of the report includes:
- Scale Inhibitor Manufacturers
- Scale Inhibitor Suppliers
- Scale Inhibitor Companies
- Scale Inhibitor Distributors
- Oil & Gas Companies
- Raw Material Suppliers
- National & Local Government Organizations/Agencies
- Investors
- Associations & Industry Bodies
Get online access to the report on the World's First Market Intelligence Cloud
Request Sample Scope of the Report
:

- By Type:
- Phosphonates
- Carboxylate/Acrylate
- Sulfonates
- Others
- Polymaleic Acid
- Synthetic Polymeric Acid
- Polyaspartate
- Phosphinopolyacrylate
- Carboxy Methyl Inulin
- By Region:
- North America
- U.S.
- Canada
- Mexico
- Europe
- Western Europe
- Eastern Europe
- Southern Europe
- Asia-Pacific
- China
- India
- RoW
- Middle-East
- Africa
- South America
- North America
Available Customizations:
The following customization options are available for the report:
Product Analysis
- Product Matrix which gives a detailed comparison of product portfolio of each company
Country Level Analysis
- Further breakdown of the global oilfield scale inhibitor market by major countries from Europe, including Spain, Belgium, Holland, and so on.
- Further breakdown of the global market by major countries from Asia-Pacific, including Taiwan, Indonesia, South Korea, and so on.
- Further breakdown of the RoW oilfield scale inhibitor market into Argentina and South Africa.
Company Information
- Detailed analysis and profiling of additional market players
The global oilfield scale inhibitor market was valued at USD 509.4 Million in 2014 and is expected to reach USD 697.5 Million by 2020, at a CAGR of 5.40% from 2015 to 2020. Increasing demand from the oil & gas industry, wide availability of scale inhibitors, and increasing demand for biodegradable and eco-friendly scale inhibitors are driving the market for oilfield scale inhibitor.
Among the various types of oilfield scale inhibitors, the carboxylate/acrylate type segment accounted for the largest share in 2014. Carboxylate/acrylic-based scale inhibitors are commonly used to prevent the scales of calcium carbonate, zinc, and iron. The carboxylate/acrylate-based scale inhibitors meet the legislation requirement; abiding environmental norms due to the absence of phosphorus. This is a driving factor for this type�s market as strict environmental rules and regulations lead to the use of eco-friendly oilfield scale inhibitor. However, the market for the sulfonates type is expected to grow at the highest CAGR between 2015 and 2020. Sulfonate-based scale inhibitors are used in the oil industry in the form of copolymers. They are used to prevent the most common type of barium sulfate scales formed in oil and gas activities, and also in the desalination process. With new discoveries of oil and gas, the market for this type is expected to grow at the fastest rate.
RoW region, which includes the Middle-East, Africa, and South America, held the largest share of the global oilfield scale inhibitor market in 2014, and is expected to continue doing so during the forecast period. The region has the largest proven oil reserves in the world. Huge oil and gas activities, along with new oil & gas field discoveries, make this region a huge prospect for the market.
RoW is the largest market for oilfield scale inhibitor. RoW includes some of the biggest oil producing regions, such as the Middle-East, Africa, and South America. However, the geopolitics and political unrest in these regions may restrain growth of the RoW market. Lack of proper infrastructure in many African countries is also a huge concern for the growth of this market.
The global demand for oilfield scale inhibitor is mainly catered to by regional manufacturers. There are, however, various multinational companies operating globally and producing scale inhibitors. Some of the major players in the market are The Dow Chemical Company (U.S.), BASF SE (Germany), AkzoNobel Oilfield (The Netherlands), Kemira OYJ (Finland), Solvay S.A. (Belgium), Halliburton Company (U.S.), Schlumberger Limited (U.S.), Baker Hughes Incorporated (U.S.), Clariant AG (Switzerland), E. I. du Pont de Nemours and Company (U.S.), Evonik Industries AG (Germany), GE Power & Water Process Technologies (U.S.), Ashland Inc. (U.S.), and Innospec Inc. (U.S.).
Table of Contents
1 Introduction (Page No. - 14)
1.1 Objectives of the Study
1.2 Market Definition
1.3 Market Scope
1.3.1 Markets Covered
1.3.2 Years Considered in the Report
1.4 Currency
1.5 Packaging & Sizing
1.6 Limitations
1.7 Stakeholders
2 Research Methodology (Page No. - 17)
2.1 Research Data
2.1.1 Secondary Data
2.1.1.1 Key Data From Secondary Sources
2.1.2 Primary Data
2.1.2.1 Key Data From Primary Sources
2.1.2.2 Key Industry Insights
2.1.2.3 Breakdown of Primaries
2.2 Market Size Estimation
2.2.1 Bottom-Up Approach
2.2.2 Top-Down Approach
2.3 Market Breakdown & Data Triangulation
2.4 Research Assumptions
3 Executive Summary (Page No. - 26)
4 Premium Insights (Page No. - 31)
4.1 Attractive Opportunities
4.2 Oilfield Scale Inhibitor Market, By Type (2015-2020)
4.3 Market Share in Asia-Pacific, 2014
4.4 Leading Countries and Region Market Share in the Oilfield Scale Inhibitor Market, 2014
4.5 Market Size, By Region and By Type, 2014
4.6 Lifecycle Analysis, By Region
5 Market Overview11 (Page No. - 36)
5.1 Introduction
5.2 Market Segmentation
5.2.1 By Type
5.2.2 By Region
5.3 Market Dynamics
5.3.1 Drivers
5.3.1.1 Rising Demand From Oil & Gas Industry
5.3.1.2 Wide Availability of Scale Inhibitors
5.3.1.3 Growing Demand of Biodegradable Scale Inhibitors
5.3.2 Restraints
5.3.2.1 Environmental and Handling Effects of Scale Inhibitors
5.3.3 Opportunities
5.3.3.1 Increase in Offshore Spending
5.3.3.2 Potential New Oilfield Discovery
5.3.4 Challenges
5.3.4.1 Current Low Oil Prices
5.3.4.2 Geopolitics & Political Unrest
6 Industry Trends (Page No. - 42)
6.1 Introduction
6.2 Value Chain Analysis
6.3 Porter�s Five Forces Analysis
6.3.1 Bargaining Power of Suppliers
6.3.2 Threat of New Entrants
6.3.3 Threat of Substitutes
6.3.4 Bargaining Power of Buyers
6.3.5 Intensity of Rivalry
7 Oilfield Scale Inhibitor Market, By Type (Page No. - 47)
7.1 Introduction
7.2 Market Size & Projection
7.3 Phosphonates
7.4 Carboxylate/Acrylic
7.5 Sulfonates
7.6 Others
8 Regional Analysis (Page No. - 58)
8.1 Introduction
8.2 Asia-Pacific
8.2.1 China
8.2.2 India
8.3 Europe
8.3.1 Western Europe
8.3.2 Eastern Europe
8.3.3 Southern Europe
8.4 North America
8.4.1 U.S.
8.4.2 Canada
8.4.3 Mexico
8.5 Rest of the World
8.5.1 South America
8.5.1.1 Brazil
8.5.1.2 Venezuela
8.5.2 Middle East
8.5.2.1 Saudi Arabia
8.5.2.2 UAE
8.5.2.3 Qatar
8.5.3 Africa
8.5.3.1 Nigeria
8.5.3.2 Angola
8.5.3.3 Algeria
9 Competitive Landscape (Page No. - 100)
9.1 Overview
9.1.1 New Product Launches & New Technologies: the Most Popular Growth Strategies
9.2 Maximum Developments in 2013
9.3 Expansions, Investments, & Restructures
9.4 New Product Launches & New Technologies
9.5 Mergers & Acquisitions
9.6 Agreements, Collaborations, Joint Ventures, & Partnerships
10 Company Profiles (Page No. - 107)
(Overview, Financials, Products & Services, Strategies, and Developments)*
10.1 Introduction
10.2 The DOW Chemical Company
10.3 BASF S.E.
10.4 Akzo Nobel Oilfield (Akzo Nobel N.V.)
10.5 Kemira OYJ
10.6 Solvay
10.7 Halliburton Company
10.8 Schlumberger Limited
10.9 Baker Hughes Incorporated
10.10 Clariant AG
10.11 E.I. Dupont De Nemours and Company
10.12 Evonik Industries AG
10.13 GE Power & Water Process Technologies (General Electric)
10.14 Ashland Inc.
10.15 Innospec Inc.
*Details on Overview, Financials, Product & Services, Strategies, and Developments Might Not Be Captured in Case of Unlisted Company
11 Appendix (Page No. - 146)
11.1 Industry Experts
11.2 Recent Developments
11.3 Discussion Guide
11.4 Introducing RT: Real Time Market Intelligence
11.5 Available Customizations
11.6 Related Reports
List of Tables (92 Tables)
Table 1 Oilfield Scale Inhibitor Market Size: By Type, 2013-2020 (USD Million)
Table 2 Market Size: By Type, 2013-2020 (KT)
Table 3 Market Size in Phosphonates, By Region, 2013-2020 (USD Million)
Table 4 Market Size in Phosphonates, By Region, 2013-2020 (KT)
Table 5 Market Size in Carboxylate/Acrylic, By Region, 2013-2020 (USD Million)
Table 6 Market Size in Carboxylate/Acrylic, By Region, 2013-2020 (KT)
Table 7 Market Size in Sulfonates, By Region, 2013-2020 (USD Million)
Table 8 Market Size in Sulfonates, By Region, 2013-2020 (KT)
Table 9 Market Size in Others, By Region, 2013-2020 (USD Million)
Table 10 Market Size in Others, By Region, 2013-2020 (KT)
Table 11 Oilfield Scale Inhibitor Market Size, By Region, 2013-2020 (USD Million)
Table 12 Market Size, By Region, 2013-2020 (KT)
Table 13 Market Size, By Type, 2013-2020 (USD Million)
Table 14 Market Size, By Type, 2013-2020 (KT)
Table 15 Asia-Pacific: Market Size, By Country, 2013-2020 (USD Million)
Table 16 Asia-Pacific: Market Size, By Country, 2013-2020 (KT)
Table 17 Asia-Pacific: Market Size, By Type, 2013-2020 (USD Million)
Table 18 Asia-Pacific: Market Size, By Type, 2013-2020 (KT)
Table 19 China: Market Size, By Type, 2013-2020 (USD Million)
Table 20 China: Market Size, By Type, 2013-2020 (KT)
Table 21 India: Market Size, By Type, 2013-2020 (USD Million)
Table 22 India: Market Size, By Type, 2013-2020 (KT)
Table 23 Europe: Oilfield Scale Inhibitor Market Size, By Region, 2013-2020 (USD Million)
Table 24 Europe: Market Size, By Region, 2013-2020 (KT)
Table 25 Europe: Market Size, By Type, 2013-2020 (USD Million)
Table 26 Europe: Market Size, By Type, 2013-2020 (KT)
Table 27 Western Europe: Market Size, By Type, 2013-2020 (USD Million)
Table 28 Western Europe: Market Size, By Type, 2013-2020 (KT)
Table 29 Eastern Europe: Market Size, By Type, 2013-2020 (USD Million)
Table 30 Eastern Europe: Market Size, By Type, 2013-2020 (KT)
Table 31 Southern Europe: Market Size, By Type, 2013-2020 (USD Million)
Table 32 Southern Europe: Market Size, By Type, 2013-2020 (KT)
Table 33 North America: Oilfield Scale Inhibitor Market Size, By Country, 2013-2020 (USD Million)
Table 34 North America: Market Size, By Country, 2013-2020 (KT)
Table 35 North America: Market Size, By Type, 2013-2020 (USD Million)
Table 36 North America: Market Size, By Type, 2013-2020 (KT)
Table 37 U.S.: Market Size, By Type, 2013-2020 (USD Million)
Table 38 U.S.: Market Size, By Type, 2013-2020 (KT)
Table 39 Canada: Market Size, By Type, 2013-2020 (USD Million)
Table 40 Canada: Market Size, By Type, 2013-2020 (KT)
Table 41 Mexico: Market Size, By Type, 2013-2020 (USD Million)
Table 42 Mexico: Market Size, By Type, 2013-2020 (KT)
Table 43 RoW: Oilfield Scale Inhibitor Market Size, By Region, 2013-2020 (USD Million)
Table 44 RoW: Market Size, By Region, 2013-2020 (KT)
Table 45 RoW: Market Size, By Type, 2013-2020 (USD Million)
Table 46 RoW: Market Size, By Type, 2013-2020 (KT)
Table 47 South America: Market Size, By Country, 2013-2020 (USD Million)
Table 48 South America: Market Size, By Country, 2013-2020 (KT)
Table 49 South America: Market Size, By Type, 2013-2020 (USD Million)
Table 50 South America: Market Size, By Type, 2013-2020 (KT)
Table 51 Brazil: Market Size, By Type, 2013-2020 (USD Million)
Table 52 Brazil: Market Size, By Type, 2013-2020 (KT)
Table 53 Venezuela: Market Size, By Type, 2013-2020 (USD Million)
Table 54 Venezuela: Market Size, By Type, 2013-2020 (KT)
Table 55 Middle East: Market Size, By Country, 2013-2020 (USD Million)
Table 56 Middle East: Market Size, By Country, 2013-2020 (KT)
Table 57 Middle East: Market Size, By Type, 2013-2020 (USD Million)
Table 58 Middle East: Market Size, By Type, 2013-2020 (KT)
Table 59 Saudi Arabia: Market Size, By Type, 2013-2020 (USD Million)
Table 60 Saudi Arabia: Market Size, By Type, 2013-2020 (KT)
Table 61 UAE: Oilfield Scale Inhibitor Market Size, By Type, 2013-2020 (USD Million)
Table 62 UAE: Market Size, By Type, 2013-2020 (KT)
Table 63 Qatar: Market Size, By Type, 2013-2020 (USD Million)
Table 64 Qatar: Market Size, By Type, 2013-2020 (KT)
Table 65 Africa: Market Size, By Country, 2013-2020 (USD Million)
Table 66 Africa: Market Size, By Country, 2013-2020 (KT)
Table 67 Africa: Market Size, By Type, 2013-2020 (USD Million)
Table 68 Africa: Market Size, By Type, 2013-2020 (KT)
Table 69 Nigeria: Market Size, By Type, 2013-2020 (USD Million)
Table 70 Nigeria: Market Size, By Type, 2013-2020 (KT)
Table 71 Angola: Market Size, By Type, 2013-2020 (USD Million)
Table 72 Angola: Market Size, By Type, 2013-2020 (KT)
Table 73 Algeria: Market Size, By Type, 2013-2020 (USD Million)
Table 74 Algeria: Market Size, By Type, 2013-2020 (KT)
Table 75 Expansions & Investments, 2012-2015
Table 76 New Product Launches & New Technologies, 2012-2015
Table 77 Mergers & Acquisition, 2012-2015
Table 78 Agreements, Collaborations, Joint Ventures, & Partnerships, 2012-2015
Table 79 The DOW Chemical Company: Products and Services
Table 80 BASF S.E.: Products and Services
Table 81 Akzo Nobel N.V.: Products and Services
Table 82 Kemira OYJ: Products and Services
Table 83 Solvay: Products and Services
Table 84 Halliburton Company: Products and Services
Table 85 Schlumberger Limited: Products and Services
Table 86 Baker Hughes Incorporated: Products and Services
Table 87 Clariant AG: Products and Services
Table 88 E. I. Dupont De Nemours and Company: Products and Services
Table 89 Evonik Industries AG: Products and Services
Table 90 GE Power & Water Process Technologies: Products and Services
Table 91 Ashland Inc.: Products and Services
Table 92 Innospec Inc.: Products and Services
List of Figures (63 Figures)
Figure 1 Oilfield Scale Inhibitor Market: Research Design
Figure 2 Market Size Estimation Methodology: Bottom-Up Approach
Figure 3 Market Size Estimation Methodology: Top-Down Approach
Figure 4 Data Triangulation
Figure 5 Carboxylate/Acrylic Will Dominate the Oilfield Scale Inhibitor Market Between 2015 and 2020
Figure 6 RoW Will Dominate the Oilfield Scale Inhibitor Market During the Forecast Period
Figure 7 U.S. and Canada Accounts for the Largest Share in the Oilfield Scale Inhibitor Market
Figure 8 North America Holds the Largest Share Oilfield Scale Inhibitor Market Share, 2014
Figure 9 Oilfield Scale Inhibitor Market Expected to Grow With A Strong Growth Rate During the Forecast Period
Figure 10 Phosphonates Type Segment is Expected to Dominate in the Oilfield Scale Inhibitor Market Between 2015-2020
Figure 11 China Dominated the Asia-Pacific Region in 2014
Figure 12 U.S.: Top Contributor to the Global Market
Figure 13 RoW is the Dominant Region of the Oilfield Scale Inhibitor Market
Figure 14 High Growth Potential in Asia-Pacific for Oilfield Scale Inhibitor Market
Figure 15 Market, By Type
Figure 16 Market, By Region
Figure 17 Drivers, Restraints, Opportunities, and Challenges in the Oilfield Scale Inhibitor Market
Figure 18 Overview of Oilfield Scale Inhibitor Value Chain
Figure 19 Porter�s Five Forces Analysis
Figure 20 Carboxylate/Acrylic-Based Oilfield Scale Inhibitor to Dominate the Market Between 2015 and 2020
Figure 21 Rest of the World to Register the Highest CAGR Between 2015 and 2020
Figure 22 North America is Expected to Register Fastest Growth in Carboxylate/Acrylic-Based Oilfield Scale Inhibitor
Figure 23 Asia-Pacific to Hold the Largest Market Share for Sulfonate-Based Oilfield Scale Inhibitor in the Next Five Years
Figure 24 RoW to Register the Highest CAGR for Others Oilfield Scale Inhibitor During the Forecast Period
Figure 25 Market Share, By Region, 2014
Figure 26 Asia-Pacific: Oilfield Scale Inhibitor Market Snapshot
Figure 27 Europe: Market Snapshot in 2014
Figure 28 Western Europe: Oilfield Scale Inhibitor Market, By Type, 2015 vs 2020
Figure 29 North America: Oilfield Scale Inhibitor Market Snapshot
Figure 30 RoW: Market Snapshot, 2014-2020
Figure 31 South America: Market, By Country, 2015 vs 2020 (USD Million)
Figure 32 Middle East: Market, By Country, 2015 vs 2020 (USD Million)
Figure 33 Africa: Market, By Country, 2015 vs 2020
Figure 34 New Product Launches & Technologies are Leading Approaches of Key Companies
Figure 35 Key Growth Strategies in Oilfield Scale Inhibitor Market, 2012-2015
Figure 36 Oilfield Scale Inhibitor Market Developmental Share, 2012-2015
Figure 37 Benchmarking of Top 5 Players in the Oilfield Scale Inhibitor Market
Figure 38 The DOW Chemical Company : Company Snapshot
Figure 39 The DOW Chemical Company: SWOT Analysis
Figure 40 BASF S.E.: Company Snapshot
Figure 41 BASF S.E.: SWOT Analysis
Figure 42 Akzo Nobel N.V.: Company Snapshot
Figure 43 Akzo Nobel N.V.: SWOT Analysis
Figure 44 Kemira OYJ: Company Snapshot
Figure 45 Kemira OYJ: SWOT Analysis
Figure 46 Solvay: Company Snapshot
Figure 47 Solvay: SWOT Analysis
Figure 48 Halliburton Company: Company Snapshot
Figure 49 Halliburton Company: SWOT Analysis
Figure 50 Schlumberger Limited: Company Snapshot
Figure 51 Schlumberger Limited: SWOT Analysis
Figure 52 Baker Hughes Incorporated: Company Snapshot
Figure 53 Baker Hughes Incorporated: SWOT Analysis
Figure 54 Clariant AG: Company Snapshot
Figure 55 Clariant AG: SWOT Analysis
Figure 56 E. I. Dupont De Nemours and Company: Company Snapshot
Figure 57 E. I. Dupont De Nemours and Company: SWOT Analysis
Figure 58 Evonik Industries AG: Company Snapshot
Figure 59 Evonik Industries AG: SWOT Analysis
Figure 60 General Electric Company: Company Snapshot
Figure 61 General Electric Company: SWOT Analysis
Figure 62 Ashland Inc.: Company Snapshot
Figure 63 Innospec Inc.: Company Snapshot


Growth opportunities and latent adjacency in Oilfield Scale Inhibitor Market
We are very much interested to to know the details of scale inhibitors, of 30 MT. Does this study provide such information?