Oleochemicals Market by Type (Fatty Acid, Fatty Alcohol, Glycerin, and Others), by Application (Pharmaceutical & personal care, Food & beverages, Soaps & detergents, Polymers, and Others), by Region (North America, Europe, Asia-Pacific, and Rest of the World) - Trends and Forecasts to 2019


To get the latest information, inquire now!
[154 Pages] Oleochemicals are used primarily in the personal care industry for manufacturing of various lotions, creams, and so on. Oleochemicals are replacing many petroleum based products as their properties help build a product which is better for the environment and which can be manufactured from renewable raw materials. Major types for oleochemicals include fatty acids, fatty alcohols, glycerin, and others. The market for glycerin is projected to grow at the fastest rate. Fatty acids were observed to dominate the global market by type, for oleochemicals, and were estimated to control around 56.34% of the total oleochemicals consumption by type. The oleochemicals market in terms of size is projected to reach $25.91 billion by 2019, growing at a CAGR of 4.2% between 2014 and 2019.
With the environmental regulations constantly becoming more stringent and the non renewable resources getting depleted, it has paved way to the opportunity for the oleochemicals to enter the market and substitute the conventional petroleum based products being used currently. The factors driving growth in the market are: high demand coming from consumer markets, easy availability of raw materials, and a growing market for green chemicals. The oleochemicals market is expected to experience huge growth due to enormous potential offered by these drivers.
Oleochemicals manufacturers mainly focus on agreements & partnerships to expand their product portfolio for various applications as well as to deepen their regional reach. Expansion into growing markets, such as Asia-Pacific, Brazil, and Middle East could be the key to success for oleochemicals producers.
The report covers the oleochemicals market in the key regions namely Europe, North America, Asia-Pacific, and RoW for major applications, such as pharmaceutical & personal care, food & beverages, soaps & detergents, polymers, and others. This report analyzes different marketing trends and establishes the most effective growth strategy in the market. It identifies market dynamics, such as drivers, restraints, opportunities, and winning imperatives.
By Type:
- Fatty acid
- Fatty alcohol
- Glycerin
- Others
By Applications:
- Pharmaceutical & personal care
- Food & Beverages
- Soaps & Detergents
- Polymers
- Others
By Region:
- Asia-Pacific
- North America
- Europe
- RoW
The oleochemicals market size is projected to grow at a CAGR of 4.2% to reach $25.91 billion by 2019.
Oleochemicals are used mainly in pharmaceutical & personal care, and soaps & detergents applications. They are used in several applications, such as manufacturing of soaps, beauty products, medicines, detergents, various oils used in the food industry and so on. Increasing applications of oleochemicals in the soaps & detergents industry is boosting interest in the market.
This market is driven by high demand coming from consumer markets, easy availability of raw materials, and a growing market for green chemicals. The demand for oleochemicals is increasing in the pharmaceutical & personal care industry as consumers are becoming aware of the environmental benefits and cost effectiveness offered by oleochemicals. The Asia-Pacific region is estimated to be the fastest growing region as a result of the easy availability of raw material and development of newer applications for the product.
The Asia-Pacific region dominated the market in 2013. China, Japan, and India are the key countries with a huge demand for oleochemicals. The Asia-Pacific region is expected to show the highest growth rate of 5.10% between 2014 and 2019.
Oleochemicals Market Share, by Region, 2013
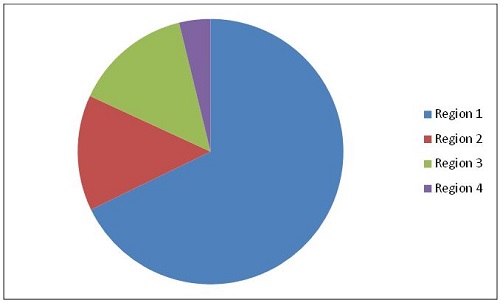
Source: MarketsandMarkets Analysis
The key market players focus on agreements & partnerships as their growth strategy to improve their product portfolio and serve more consumers. They are also focusing on trying to capture market share by expanding their operations to more developing regions where the market is not saturated. The oleochemicals market is expected to witness a high growth from low penetrated applications and regions.
The report analyzes the market based on the key applications, type, and regions. It also covers the market behavior of leading producers, key developments, and strategies implemented to sustain and succeed in the market.
Table of Contents
1 Introduction (Page No. - 15)
1.1 Objectives of the Study
1.2 Market Definition
1.3 Market Scope
1.3.1 Markets Covered
1.3.2 Years Considered in the Report
1.4 Currency
1.5 Package Size
1.6 Limitations
1.7 Stakeholders
2 Research Methodology (Page No. - 18)
2.1 Market Size Estimation
2.2 Market Share Estimation
2.2.1 Data From Secondary Sources
2.2.2 Data From Primary Sources
2.2.3 Assumptions
3 Executive Summary (Page No. - 24)
4 Premium Insights (Page No. - 27)
4.1 Attractive Market Opportunity for Oleochemicals
4.2 Life Cycle Analysis, By Region
5 Market Overview (Page No. - 33)
5.1 Introduction
5.2 Segmentation
5.2.1 Oleochemicals Market, By Application
5.2.2 Oleochemicals Market, By Type
5.3 Market Dynamics
5.3.1 Drivers
5.3.1.1 Government Regulations Regarding Use of Environmentally Friendly Products
5.3.1.2 Consumer-Driven Demand
5.3.1.3 Recyclability
5.3.2 Restraints
5.3.2.1 Fluctuating Prices of Raw Materials
5.3.3 Opportunities
5.3.3.1 Increasing Penetration in Food & Beverages and Soaps & Detergents End-User Industries
5.3.3.2 Preference of Bio-Based Raw Materials for Polymer Manufacturing
5.3.4 Challenges
5.3.4.1 Easy Availability of Raw Materials in Developing Regions Leading to Overcapacity
6 Industry Trends (Page No. - 41)
6.1 Introduction
6.2 Value Chain Analysis
6.3 Porter’s Five Forces Analysis
6.3.1 Threat of New Entrants
6.3.2 Threat of Substitutes
6.3.3 Bargaining Power of Buyers
6.3.4 Bargaining Power of Suppliers
6.3.5 Intensity of Rivalry
6.4 Strategic Benchmarking
6.4.1 Regional Integration & Product Enhancement
6.4.2 Entry Into Developing Regions for Oleochemicals
7 Oleochemicals Market, By Application (Page No. - 47)
7.1 Introduction
7.2 Pharmaceuticals & Personal Care
7.3 Food & Beverages
7.4 Soaps & Detergents
7.5 Polymers
7.6 Others
8 Oleochemicals Market, By Type (Page No. - 55)
8.1 Introduction
8.2 Fatty Acid
8.3 Fatty Alcohol
8.4 Glycerin
8.5 Others
9 Regional Analysis (Page No. - 62)
9.1 Introduction
9.2 North America
9.2.1 North American Oleochemicals Market, By Type
9.2.2 North American Oleochemicals Market, By Country
9.2.3 U.S. , By Application
9.2.4 Canada, By Application
9.2.5 Mexico, By Application
9.2.6 U.S. , By Type
9.2.7 Canada, By Type
9.2.8 Mexico, By Type
9.3 Europe
9.3.1 Germany, By Application
9.3.2 Belgium, By Application
9.3.3 Italy, By Application
9.3.4 France, By Application
9.3.5 Netherlands, By Application
9.3.6 Others, By Application
9.3.7 Germany, By Type
9.3.8 Belgium, By Type
9.3.9 Italy, By Type
9.3.10 France, By Type
9.3.11 Netherlands, By Type
9.3.12 Others, By Type
9.4 Asia-Pacific
9.4.1 China, By Application
9.4.2 Japan, By Application
9.4.3 India, By Application
9.4.4 Others, By Application
9.4.5 China, By Type
9.4.6 Japan, By Type
9.4.7 India, By Type
9.4.8 Others, By Type
9.5 Rest of the World
9.5.1 Brazil, By Application
9.5.2 Argentina, By Application
9.5.3 South Africa, By Application
9.5.4 Middle East & North Africa, By Application
9.5.5 Others, By Application
9.5.6 Brazil, By Type
9.5.7 Argentina, By Type
9.5.8 South Africa, By Type
9.5.9 Middle East & North Africa, By Type
9.5.10 Other Regions of ROW, By Type
10 Production Capacities Outlook (Page No. - 94)
10.1 Introduction
10.2 Oleochemicals Production Capacities of Major Countries
10.2.1 China
10.2.2 Malaysia
10.2.3 Indonesia
10.2.4 India
10.2.5 Germany
10.2.6 U.S.
11 Competitive Landscape (Page No. - 98)
11.1 Overview
11.2 Market Share Analysis
11.3 Competitive Situation & Trends
11.3.1 Expansions & Investments
11.3.2 Agreements & Partnerships
11.3.3 Acquisitions
11.3.4 Other Developments
12 Company Profiles (Page No. - 106)
(Overview, Financial*, Products & Services, Strategy, and Developments)
12.1 Introduction
12.2 Wilmar International Ltd.
12.3 BASF SE
12.4 Eastman Chemical Company
12.5 P&G Chemicals
12.6 Cargill Incorporated
12.7 Evonik Industries
12.8 Godrej Industries
12.9 PTT Global Chemical Public Company Limited
12.1 Arizona Chemical Company LLC
12.11 Emery Oleochemicals Group
12.12 Alnor Oil Co, Inc.
12.13 Berg + Schmidt
12.14 Isosciences LLC
12.15 Vegetable Vitamin Foods Company
12.16 MYRIANT
*Details Might Not Be Captured in Case of Unlisted Companies
13 Appendix (Page No. - 142)
13.1 Discussion Guide
13.2 Introducing RT: Real-Time Market Intelligence
13.3 Available Customizations
13.4 Related Reports
List of Tables (69 Tables)
Table 1 Government Regulations & Consumer-Driven Demand Are Driving Oleochemicals Market
Table 2 Fluctuating Feedstock Prices Restraining the Growth of Oleochemicals Market
Table 3 Economies of Scale & Stringent Regulations in Automotive Industry Are Expected to Create Opportunities for Oleochemicals
Table 4 Supply Overcapacity, A Key Challenge for the Growth of Oleochemicals Market
Table 5 Oleochemicals Market Size, By Application, 2012–2019 ($Million)
Table 6 Oleochemicals Market Size in Pharmaceuticals & Personal Care, By Region, 2012–2019 ($Million)
Table 7 Oleochemicals: Market Size in Food & Beverages, By Region, 2012–2019 ($Million)
Table 8 Oleochemicals Market Size in Soaps & Detergents, By Region, 2012–2019 ($Million)
Table 9 Oleochemicals: Market Size in Polymers, By Region, 2012–2019 ($Million)
Table 10 Oleochemicals Market Size in Others, By Region, 2012–2019 ($Million)
Table 11 Oleochemicals: Market Size, By Type, 2014-2019 ($Million)
Table 12 Fatty Acid Market Size , By Region, 2012–2019 ($Million)
Table 13 Fatty Alcohol Market Size, By Region, 2012–2019 ($Million)
Table 14 Glycerin Market Size, By Region, 2012–2019 ($Million)
Table 15 Others Oleochemicals Market Size, By Region, 2012–2019 ($Million)
Table 16 Oleochemicals Market Size, By Region, 2012–2019 ($Million)
Table 17 Oleochemicals: Market Size, By Region, 2012-2019 (Million Tons)
Table 18 North America: Market Size, By Application, 2012–2019 ($Million)
Table 19 North America: Oleochemicals Market Size, By Type, 2012–2019 ($Million)
Table 20 North America: Market Size, By Type, 2012-2019 (Million Tons)
Table 21 North America: Market Size, By Country, 2012–2019 ($Million)
Table 22 U.S.: Market Size, By Application, 2012–2019 ($Million)
Table 23 Canada: Market Size, By Application, 2012–2019 ($Million)
Table 24 Mexico: Market Size, By Application, 2012–2019 ($Million)
Table 25 U.S.: Market Size, By Type, 2012–2019 ($Million)
Table 26 Canada: Oleochemicals Market Size, By Type, 2012–2019 ($Million)
Table 27 Mexico: Market Size, By Type, 2012–2019 ($Million)
Table 28 Europe: Market Size, By Application, 2012–2019 ($Million)
Table 29 Europe: Market Size, By Type, 2012–2019 ($Million)
Table 30 Europe: Oleochemicals Market Size, By Type, 2012-2019 (Million Tons)
Table 31 Europe: Market Size, By Country, 2012–2019 ($Million)
Table 32 Germany: Market Size, By Application, 2012–2019 ($Million)
Table 33 Belgium: Market Size, By Application, 2012–2019 ($Million)
Table 34 Italy: Market Size, By Application, 2012–2019 ($Million)
Table 35 France: Oleochemicals: Market Size, By Application, 2012–2019 ($Million)
Table 36 Netherlands: Market Size, By Application, 2012–2019 ($Million)
Table 37 Others: Oleochemicals Market Size, By Application, 2012–2019 ($Million)
Table 38 Germany: Oleochemicals Market Size, By Type, 2012–2019 ($Million)
Table 39 Belgium: Market Size, By Type, 2012–2019 ($Million)
Table 40 Italy: Market Size, By Type, 2012–2019 ($Million)
Table 41 France: Market Size, By Type, 2012–2019 ($Million)
Table 42 Netherlands: Oleochemicals Market Size, By Type, 2012–2019 ($Million)
Table 43 Others: Oleochemicals Market Size, By Type, 2012–2019 ($Million)
Table 44 Asia-Pacific: Oleochemicals Market Size, By Application, 2012–2019 ($Million)
Table 45 Asia-Pacific: Market Size, By Type, 2012–2019 ($Million)
Table 46 Asia-Pacific: Market Size, By Type, 2012-2019 (Million Tons)
Table 47 Asia-Pacific: Market Size, By Country, 2012–2019 ($Million)
Table 48 China: Market Size, By Application, 2012–2019 ($Million)
Table 49 Japan: Oleochemicals: Market Size, By Application, 2012–2019 ($Million)
Table 50 India: Oleochemicals Market Size, By Application, 2012–2019 ($Million)
Table 51 Others: Oleochemicals Market Size, By Application, 2012–2019 ($Million)
Table 52 China: Oleochemicals Market Size, By Type, 2012–2019 ($Million)
Table 53 Japan: Market Size, By Type, 2012–2019 ($Million)
Table 54 India: Market Size, By Type, 2012–2019 ($Million)
Table 55 Others: Market Size, By Type, 2012–2019 ($Million)
Table 56 ROW: Market Size, By Application, 2012–2019 ($Million)
Table 57 ROW: Oleochemicals Market Size, By Type, 2012–2019 ($Million)
Table 58 ROW: Market Size, By Type, 2012–2019 (Million Tons)
Table 59 ROW: Market Size, By Country, 2012–2019 ($Million)
Table 60 Brazil: Market Size, By Application, 2012–2019 ($Million)
Table 61 Argentina: Market Size, By Application, 2012–2019 ($Million)
Table 62 South Africa: Market Size, By Application, 2012–2019 ($Million)
Table 63 Middle East & North Africa: Oleochemicals Market Size, By Application, 2012–2019 ($Million)
Table 64 Others: Oleochemicals Market Size, By Application, 2012–2019 ($Million)
Table 65 Brazil: Oleochemicals Market Size, By Type, 2012-2019 ($Million)
Table 66 Argentina: Oleochemicals: Market Size, By Type, 2012-2019 ($Million)
Table 67 South Africa: Oleochemicals Market Size, By Type, 2012-2019 ($Million)
Table 68 Middle East & North Africa: Oleochemicals Market Size, By Type, 2012-2019 ($Million)
Table 69 Other Regions of ROW: Oleochemicals Market Size, By Type, 2012-2019 ($Million)
List of Figures (52 Figures)
Figure 1 Oleochemicals Market Segmentation
Figure 2 Oleochemicals Market: Research Design
Figure 3 Market Size Estimation Methodology: Bottom-Up Approach
Figure 4 Market Size Estimation Methodology: Top-Down Approach
Figure 5 Breakdown of Primary Interviews: By Company Type, Designation & Region
Figure 6 Oleochemicals: Market Snapshot (2014 vs. 2019): Market for Soaps & Detergents Expected to Grow at the Fastest CAGR
Figure 7 Oleochemicals for Soaps & Detergents Projected to Be the Fastest-Growing Market From 2014 to 2019
Figure 8 Global Oleochemicals Market Size, By Fast-Growing Region ($Million)
Figure 9 Attractive Market Opportunity for Oleochemicals
Figure 10 Pharmaceuticals & Personal Care is the Fastest-Growing Applications of Oleochemicals Market in 2013
Figure 11 China, Japan, and India Projected to Lead the Market With the Highest Growth Rate By 2019
Figure 12 Soaps & Detergents is the Fastest-Growing Application Segment Followed By Pharmaceutical & Personal Care
Figure 13 Asia-Pacific Projected to Dominate the Oleochemicals Market From 2014 to 2019
Figure 14 Polymers Unravel New Revenue Pockets for Market Players
Figure 15 North America and Europe Markets Expected to Enter Into Decline Phase
Figure 16 Oleochemicals Market, By Application
Figure 17 Market Segmentation: By Type
Figure 18 Oleochemicals Market Dynamics
Figure 19 Oleochemicals: Value Chain Analysis
Figure 20 Oleochemicals Market: Porter’s Five Forces Analysis
Figure 21 Strategic Benchmarking: Companies Focusing on Geographic Integration & Product Enhancement
Figure 22 Strategic Benchmarking: Entry Into Developing Regions for Oleochemicals
Figure 23 Pharmaceuticals & Personal Care Segment Expected to Account for Significant Market Share, 2014–2019
Figure 24 Oleochemicals Market Growth is Attributed to Stringent Regulations & Consumer Awareness
Figure 25 Key Elements Driving the Oleochemicals Market
Figure 26 Glycerin is Projected to Witness the Highest CAGR Between 2014 & 2019
Figure 27 China the Biggest Manufacturer of Fatty Acid (2014-2019)
Figure 28 Regional Snapshot (2013): Asia-Pacific Held Major Market Share
Figure 29 North America Market Snapshot, 2013: U.S. Accounted for Major Market Share
Figure 30 Asia-Pacific Market Snapshot, 2013: China Accounted for Major Market Share
Figure 31 Fatty Acid & Fatty Alcohol: Cumulative Production Capacities of Major Countries
Figure 32 Key Companies Preferred Agreements & Partnerships Strategy Over the 2011-2014
Figure 33 Wilmar International Grew at the Fastest Rate Between 2010-2014
Figure 34 Oleochemicals Market Developments, By Key Player, 2010-2014
Figure 35 Agreements & Partnerships Fuelled Growth & Innovation Between 2010 & 2014
Figure 36 Battle for Market Share: Agreements & Partnerships Was the Key Strategy in 2013
Figure 37 Regional Revenue Mix of Top 5 Market Players
Figure 38 Wilmar: Business Overview
Figure 39 BASF: Business Overview
Figure 40 Eastman: Business Overview
Figure 41 P&G: Business Overview
Figure 42 Cargill: Business Overview
Figure 43 Evonik: Business Overview
Figure 44 Godrej: Business Overview
Figure 45 PTT: Business Overview
Figure 46 Arizona Chemical: Business Overview
Figure 47 Emery: Business Overview
Figure 48 Alnor: Business Overview
Figure 49 Berg + Schmidt: Business Overview
Figure 50 Isosciences: Business Overview
Figure 51 VVF: Business Overview
Figure 52 MYRIANT: Business Overview


Growth opportunities and latent adjacency in Oleochemicals Market