Phosphorus & Derivatives Market by Type (Ammonium Phosphates, Industrial Phosphates, Phosphorus Chloride, Phosphorus Pentoxide, and Others) by Application (Fertilizers, Detergents, Food Industry, and Others) & by Region - Global Forecast to 2020


The phosphorus & derivatives market is analyzed with respect to production and consumption of phosphorus & its derivatives. The utilization of phosphorus & derivatives across regions, such as Asia, Americas, Europe, Africa, Oceania, and The Middle East are estimated in terms of volume (kilotons) and value (USD). The phosphorus & derivatives market is projected to register a CAGR of 3.5% between 2015 and 2020 and is expected to account for a market size of USD 75.9 Billion by 2020. Asia is the largest region for phosphorus & derivatives market and is projected to retain this position over the next five years. This can be attributed to the highest production as well as consumption of ammonium phosphate in Asia. This is driving the demand for phosphorus & derivatives in Asia, as ammonium phosphate is its largest type.
The market size of phosphorus & derivatives is projected to reach USD 75.9 Billion by 2020 from USD 61.9 Billion in 2014, at a CAGR of 3.5% between 2015 and 2020. The high growth of the industry is mainly due to increase in demand from application industries such as fertilizers, detergent, the food industry, water treatment chemicals, metal finishing, and flame retardants material.
The key driving factors in this market include the utilization of phosphorus & derivatives which serves various purposes such as essential nutrient for body functioning, increasing population, development and introduction of Halogen Free Flame Retardants (HFFR), decreasing arable land, increasing use of bio-fuels, and increasing demand for water treatment. The market is restrained due to various factors, such as regulations on phosphorus usage in detergents, conservation of resources, and decreasing quality of phosphate rock.
The intensity of competitive rivalry in the phosphorus & derivatives market is moderate to high. The phosphorus & derivatives market is witnessing a high growth which is projected to continue in the near future, mainly driven by types of phosphorus & derivatives used, such as ammonium phosphate, industrial phosphate, and phosphorus chloride. The high growth potential of the end-user industries for the above mentioned types is driving the market for phosphorus & derivatives in Asia.
The phosphorus & derivatives market has been analyzed in terms of value (USD) and volume (KT) for six regions, namely, Asia, Americas, Europe, Africa, Oceania, and The Middle East. It has been estimated based on types, such as ammonium phosphate, industrial phosphate, purified phosphorus acid, phosphorus chloride, phosphorus pentasulfide, and phosphorus pentoxide.
For this report, various secondary sources, such as directories, technical handbooks, company annual reports, industry association publications, chemical magazine articles, trade websites, and databases have been referred to identify and collect information useful for this extensive commercial study of the phosphorus & derivatives. The primary sources that include experts from related industries and suppliers have been interviewed to obtain and verify critical information as well as to assess future prospects and market estimations.
This report includes the analysis of different marketing trends and the growth strategies adopted by market players. It includes the identification of market dynamics, such as drivers, restraints, and opportunities. The key market players, such as Agrium Inc. (Canada), OCP S.A. (Africa), Mosaic Co (U.S), Eurochem (Russia), Yara International ASA (Norway), Akron OAO (Russia), CF Industries Holdings, Inc. (U.S.), Innophos Holdings, Inc. (U.S.), Israel Chemical Ltd. (Israel), Lanxess AG (Germany), and United Phosphorus Limited (India) have also been profiled in this report.
Get online access to the report on the World's First Market Intelligence Cloud
Request Sample Scope of the Report

- On the basis of product type:
- Ammonium Phosphates
- Industrial Phosphates
- Purified Phosphoric Acid
- Phosphorus Chloride
- Phosphorus Pentoxide
- Phosphorus Pentasulfide
- On the basis of region:
- Asia
- Americas
- Europe
- Africa
- Oceania
- Middle East
- On the basis of application:
- Fertilizers
- Detergents
- Food Industry
- Water Treatment Chemicals
- Metal Finishing
- Flame Retardant Material
The market is projected to register a CAGR of 3.5 % between 2015 and 2020, to reach USD 75.9 Billion by 2020. Phosphorus & derivatives are essential nutrients that are used as additives to develop the quality & strength of their end application such as fertilizers, detergents, and the food industry. The derivatives of phosphorus are mostly used as a fertilizer in the production of crops. These are also used in detergent manufacturing, water cleaning agents, and edible products.
The report includes applications of phosphorus & derivatives, such as fertilizers, detergents, the food industry, metal finishing, water treatment chemical, and flame retardants materials. Fertilizers account for a major market share among all applications in the phosphorus & derivatives market, the fertilizers segment is projected to register a CAGR of 2.3% in terms of volume between 2015 and 2020.
The report includes types of phosphorus & derivatives, such as ammonium phosphates, industrial phosphates, purified phosphoric acid, phosphorus chloride, phosphorus pentoxide, and phosphorus pentasulfide. Ammonium phosphate and its derivatives are widely used for fertilizers in both granular and liquid forms. It is an effective source of phosphorus and nitrogen that is required for the development of plants. Ammonium phosphate accounted for 58.1% share of the said market in 2014. The phosphorus chloride projected to witness the highest CAGR of 4.5% by value between 2015 and 2020.
The report covers the phosphorus & derivatives market and its trends for six regions, namely, Asia, Americas, Europe, Africa, Oceania, and The Middle East. The market has been analyzed with respect to fifteen key countries which include China, India, Indonesia, Pakistan, Vietnam, the U.S., Brazil, Canada, Argentina, Chile, France, Spain, Poland, Italy, and Germany. These countries have been analyzed based on the existing market reach manufacturers� growth potential. Some of the prominent companies in the market include Agrium Inc. (Canada), OCP S.A. (Africa),Mosaic Co (U.S), Eurochem (Russia), Yara International ASA (Norway), Akron OAO (Russia), CF Industries Holdings, Inc. (U.S.), Innophos Holdings, Inc. (U.S.), Israel Chemical Ltd. (Israel), Lanxess AG (Germany), and United Phosphorus Limited (India). These key players account for a significant share in the phosphorus & derivatives market.
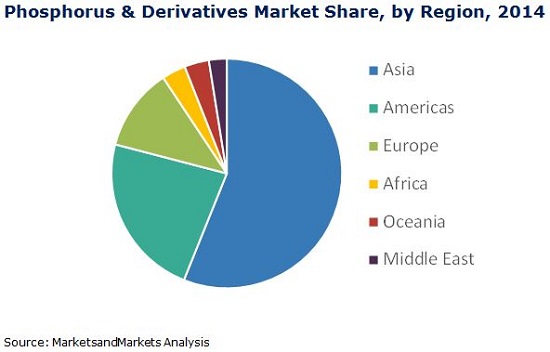
Asia is projected to lead the phosphorus & derivatives market by 2020, followed by Americas and Europe. Increasing crop production to meet the demand of growing population drives Asia to lead the phosphorus & derivatives market by 2020. The Middle East and Africa are the fastest-growing markets for phosphorus & derivatives due to emerging industries in developing economies such as Jordan and Morocco.
Table of Contents
1 Introduction (Page No. - 16)
1.1 Objectives of the Study
1.2 Market Definition
1.3 Scope of the Study
1.3.1 Markets Covered
1.3.2 Years Considered in the Report
1.4 Currency & Pricing
1.5 Limitations
1.6 Package Size
1.7 Stake Holders
2 Research Methodology (Page No. - 20)
2.1 Research Data
2.1.1 Secondary Data
2.1.2 Primary Data
2.1.2.1 Key Industry Insights
2.1.2.2 Breakdown of Primaries
2.2 Market Size Estimation
2.2.1 Bottom-Up Approach
2.2.2 Top Down Approach
2.3 Market Breakdown & Data Triangulation
2.4 Research Assumptions
3 Executive Summary (Page No. - 28)
4 Premium Insights (Page No. - 32)
4.1 Significant Opportunities for Phosphorus & Derivatives
4.2 Phosphorus & Derivatives Market: Major Regions
4.3 Phosphorus & Derivative Market in Asia
4.4 Phosphorus & Derivatives Market Attractiveness
4.5 Phosphorus & Derivatives Market, By Application
4.6 Life Cycle Analysis, By Region
5 Market Overview (Page No. - 38)
5.1 Introduction
5.2 Market Segmentation
5.2.1 By Type
5.2.2 By Application
5.2.3 By Region
5.3 Market Dynamics
5.3.1 Drivers
5.3.1.1 Essential Nutrient for Body Functioning
5.3.1.2 Increasing Population
5.3.1.3 Decreasing Arable Land
5.3.1.4 Introduction and Development of Halogen Free Flame Retardants (HFFR)
5.3.1.5 Increasing Use of Bio-Fuels
5.3.1.6 Increasing Demand for Water Treatment
5.3.2 Restraints
5.3.2.1 Regulation of Phosphorus Usage in Detergents
5.3.2.2 Conservation of Resources
5.3.2.3 Decreasing Quality of Phosphorus Rock
5.3.3 Opportunities
5.3.3.1 Improved Hard Process (IHP) for Kiln Phosphoric Acid Production
5.3.3.2 Use of Phosphorus in Batteries for Electric Vehicles
5.3.4 Burning Issues
5.3.4.1 the Production of Technical and Food Grade Phosphoric Acid From Wet Process
6 Industry Trends (Page No. - 45)
6.1 Introduction
6.2 Value Chain Analysis
6.2.1 Raw Material
6.2.2 Intermediates
6.2.3 Final Products
6.2.4 End Use
6.3 Porter�s Five Forces Analysis
6.3.1 Threat of New Entrants
6.3.2 Threat of Substitutes
6.3.3 Bargaining Power of Suppliers
6.3.4 Bargaining Power of Buyers
6.3.5 Intensity of Competitive Rivalry
6.4 Strategic Benchmarking
6.4.1 Mergers & Acquisitions
6.4.2 Expansions
6.4.3 Supply Contracts
7 Yellow Phosphorus Market (Page No. - 52)
7.1 Introduction
7.2 World Capacity of Yellow Phosphorus
7.3 Yellow Phosphorus Application
7.3.1 Thermal Phosphoric Acid - A Major Application
7.4 Manufacturing Process
7.4.1 Yellow Phosphorus Produced, Using Thermal Process
7.4.2 Factors That Affect the Production Cost of Yellow Phosphorus
7.5 Analysis of Countries That Produce Yellow Phosphorus
7.5.1 China
7.5.2 U.S.
7.5.3 Kazakhstan
7.5.4 Vietnam
8 Phosphorus & Derivatives Market, By Type (Page No. - 59)
8.1 Introduction
8.2 Market Size & Projection
8.2.1 Phosphorus & Derivatives: Market Size, By Type, 2013 - 2020 (Kiloton of P2o5)
8.2.2 Phosphorus & Derivatives: Market Size, By Types, 2013 - 2020 (Kiloton)
8.2.3 Phosphorus & Derivatives: Market Size, By Types, 2013 - 2020 (USD Million)
8.3 Ammonium Phosphate
8.4 Industrial Phosphate
8.5 Purified Phosphoric Acid
8.6 Phosphorus Chloride
8.7 Phosphorus Pentoxide
8.8 Phosphorus Pentasulfide
8.9 Other
9 Phosphorus & Derivatives Market, By Application (Page No. - 72)
9.1 Introduction
9.2 Market Size & Projection
9.2.1 Phosphorus & Derivatives: Market Size, By Application, 2013 - 2020 (Kiloton of P2o5)
9.2.2 Phosphorus & Derivatives: Market Size, By Application, 2013 - 2020 (Kiloton)
9.3 Fertilizers
9.4 Detergents
9.5 Food Industry
9.6 Water Treatment Chemicals
9.7 Metal Finishing
9.8 Flame Retardant Material
9.9 Other
10 Phosphorus & Derivatives Market, By Region (Page No. - 87)
10.1 Introduction
10.2 Asia
10.3 Americas
10.4 Europe
10.5 Africa
10.6 Oceania
10.7 The Middle East
11 Competitive Landscape (Page No. - 119)
11.1 Overview
11.2 Mergers & Acquisitions: the Most Popular Growth Strategy
11.3 Maximum Developments in Europe Between 2010-2015
11.4 Maximum Developments in 2012
11.5 OCP S.A.: the Top Most Player
11.6 Competitive Situation & Trends
11.6.1 Mergers & Acquisition
11.6.2 Expansion
11.6.3 Supply Contract
11.6.4 Joint Ventures
11.6.5 New Product Launches
12 Company Profiles (Page No. - 129)
12.1 Introduction
12.2 Agrium Inc
12.2.1 Business Overview
12.2.2 Products Offered
12.2.3 Recent Developments
12.2.4 SWOT Analysis
12.2.5 MnM View
12.3 OCP S.A.
12.3.1 Business Overview
12.3.2 Products Offered
12.3.3 Recent Developments
12.3.4 SWOT Analysis
12.3.5 MnM View
12.4 Mosaic Co
12.4.1 Business Overview
12.4.2 Products Offered
12.4.3 Recent Developments
12.4.4 SWOT Analysis
12.4.5 MnM View
12.5 Eurochem
12.5.1 Business Overview
12.5.2 Products Offered
12.5.3 Recent Developments
12.5.4 SWOT Analysis
12.5.5 MnM View
12.6 Yara International ASA
12.6.1 Business Overview
12.6.2 Products Offered
12.6.3 Recent Developments
12.6.4 SWOT Analysis
12.6.5 MnM View
12.7 Akron OAO
12.7.1 Business Overview
12.7.2 Products Offered
12.7.3 Recent Developments
12.7.4 MnM View
12.8 Chemische Fabrik Budenheim Kg
12.8.1 Business Overview
12.8.2 Products Offered
12.8.3 Recent Developments
12.9 CF Industries Holdings, Inc.
12.9.1 Business Overview
12.9.2 Products Offered
12.9.3 Recent Developments
12.9.4 MnM View
12.10 Innophos Holdings, Inc.
12.10.1 Business Overview
12.10.2 Products Offered
12.10.3 Recent Developments
12.10.4 MnM View
12.11 Israel Chemical Ltd. (ICL)
12.11.1 Business Overview
12.11.2 Products Offered
12.11.3 Recent Developments
12.11.4 MnM View
12.12 Italmatch Chemicals S.P.A
12.12.1 Business Overview
12.12.2 Products Offered
12.12.3 Recent Developments
12.13 Kazphosphate LLC
12.13.1 Business Overview
12.13.2 Products Offered
12.13.3 Recent Developments
12.14 Lanxess AG
12.14.1 Business Overview
12.14.2 Products Offered
12.14.3 Recent Developments
12.14.4 MnM View
12.15 OJSC Phosagro AG
12.15.1 Business Overview
12.15.2 Products Offered
12.15.3 Recent Developments
12.15.4 MnM View
12.16 Potash Corp of Saskatchewan Inc
12.16.1 Business Overview
12.16.2 Products Offered
12.16.3 Recent Developments
12.16.4 MnM View
12.17 Prayon S.A.
12.17.1 Business Overview
12.17.2 Products Offered
12.17.3 Recent Developments
12.17.4 MnM View
12.18 Saudi Arabian Mining Company (Ma�aden)
12.18.1 Business Overview
12.18.2 Products Offered
12.18.3 Recent Developments
12.18.4 MnM View
12.19 Solvay-Rohdia
12.19.1 Business Overview
12.19.2 Products Offered
12.19.3 Recent Developments
12.19.4 MnM View
12.20 United Phosphorus Limited (UPL)
12.20.1 Business Overview
12.20.2 Products Offered
12.20.3 Recent Developments
12.20.4 MnM View
12.21 Vale S.A.
12.21.1 Business Overview
12.21.2 Products Offered
12.21.3 Recent Developments
12.21.4 MnM View
12.22 Yuntianhua Group Co. Ltd.
12.22.1 Business Overview
12.22.2 Products Offered
12.22.3 Recent Developments
13 Appendix (Page No. - 189)
13.1 Excerpts From Industry Experts
13.2 Discussion Guide
13.3 Introducing RT: Real Time Market Intelligence
13.4 Available Customizations
13.5 Related Reports
List of Tables (86 Tables)
Table 1 Yellow Phosphorus: Capacity & Production, By Countries, 2014
Table 2 Phosphorus & Derivatives Market Size, By Type, 2013�2020 (Kiloton of P2o5)
Table 3 Phosphorus & Derivatives Market Size, By Type, 2013�2020 (Kiloton)
Table 4 Phosphorus & Derivatives Market Size, By Type, 2013�2020 (USD Million)
Table 5 Ammonium Phosphate Market Size, By Region, 2013�2020 (Kiloton)
Table 6 Ammonium Phosphate Market Size, By Region, 2013�2020 (USD Million)
Table 7 Industrial Phosphate Market Size, By Region, 2013�2020 (Kiloton)
Table 8 Industrial Phosphate Market Size, By Region, 2013�2020 (USD Million)
Table 9 Purified Phosphoric Acid Market Size, By Region, 2013�2020 (Kiloton)
Table 10 Purified Phosphoric Acid Market Size, By Region, 2013�2020 (USD Million)
Table 11 Phosphorus Chloride Market Size, By Region, 2013�2020 (Kiloton)
Table 12 Phosphorus Chloride Market Size, By Region, 2013�2020 (USD Million)
Table 13 Phosphorus Pentoxide Market Size, By Region, 2013�2020 (Kiloton)
Table 14 Phosphorus Pentoxide Market Size, By Region, 2013�2020 (USD Million)
Table 15 Phosphorus Pentasulfide Market Size, By Region, 2013�2020 (Kiloton)
Table 16 Phosphorus Pentasulfide Market Size, By Region, 2013�2020 (USD Million)
Table 17 Other Phosphorus & Derivatives Market Size , By Region, 2013�2020 (Kiloton)
Table 18 Other Phosphorus & Derivatives Market Size, By Region, 2013�2020 (USD Million)
Table 19 Phosphorus & Derivatives Market Size, By Application, 2013�2020 (Kiloton of P2o5)
Table 20 Phosphorus & Derivatives Market Size, By Application, 2013�2020 (Kiloton)
Table 21 Phosphorus & Derivatives Market for Fertilizers Application: By Region, 2013-2020 (Kiloton)
Table 22 Phosphorus & Derivatives Market for Detergents Application: By Region , 2013-2020 (Kiloton)
Table 23 Phosphorus & Derivatives Market for Food Industry Application: By Region, 2013-2020 (Kiloton)
Table 24 Phosphorus & Derivatives Market for Water Treatment Chemicals Application: By Region , 2013-2020 (Kiloton)
Table 25 Phosphorus & Derivatives Market for Metal Finishing Application: By Region, 2013-2020 (Kiloton)
Table 26 Phosphorus & Derivatives Market for Flame Retardant Material Application: By Region , 2013-2020 (Kiloton)
Table 27 Phosphorus & Derivatives Market for Other Application: By Region , 2013-2020 (Kiloton)
Table 28 Phosphorus & Derivatives Market Size, By Region, 2013�2020 (Kiloton P2o5)
Table 29 Phosphorus & Derivatives Market Size, By Region, 2013�2020 (Kiloton)
Table 30 Phosphorus & Derivatives Market Size, By Region, 2013�2020 (USD Million)
Table 31 Asia: Phosphorus & Derivatives Market Size, By Country, 2013�2020 (Kiloton)
Table 32 Asia: Phosphorus & Derivatives Market Size, By Country, 2013�2020 (USD Million)
Table 33 Asia: Phosphorus & Derivatives Market Size, By Application, 2013�2020 (Kiloton)
Table 34 Asia: Phosphorus & Derivatives Market Size, By Type, 2013�2020 (Kiloton)
Table 35 Asia: Phosphorus & Derivatives Market Size, By Type, 2013�2020 (USD Million)
Table 36 China: Phosphorus & Derivatives Market Size, By Type, 2013�2020 (Kiloton)
Table 37 China: Phosphorus & Derivatives Market Size, By Type, 2013�2020 (USD Million)
Table 38 India: Phosphorus & Derivatives Market Size, By Type, 2013�2020 (Kiloton)
Table 39 India: Phosphorus & Derivatives Market Size, By Type, 2013�2020 (USD Million)
Table 40 Americas: Phosphorus & Derivatives Market Size, By Country, 2013�2020 (Kiloton)
Table 41 Americas: Phosphorus & Derivatives Market Size, By Country, 2013�2020 (USD Million)
Table 42 Americas: Phosphorus & Derivatives Market Size, By Application, 2013�2020 (Kiloton)
Table 43 Americas: Phosphorus & Derivatives Market Size, By Type, 2013�2020 (Kiloton)
Table 44 Americas: Phosphorus & Derivatives Market Size, By Type, 2013�2020 (USD Million)
Table 45 U.S.: Phosphorus & Derivatives Market Size, By Type, 2013�2020 (Kiloton)
Table 46 U.S: Phosphorus & Derivatives Market Size, By Type, 2013�2020 (USD Million)
Table 47 Brazil: Phosphorus & Derivatives Market Size, By Type, 2013�2020 (Kiloton)
Table 48 Brazil: Phosphorus & Derivatives Market Size, By Type, 2013�2020 (USD Million)
Table 49 Europe: Phosphorus & Derivatives Market Size, By Country, 2013�2020 (Kiloton)
Table 50 Europe: Phosphorus & Derivatives Market Size, By Country, 2013�2020 (USD Million)
Table 51 Europe: Phosphorus & Derivatives Market Size, By Application, 2013�2020 (Kiloton)
Table 52 Europe: Phosphorus & Derivatives Market Size, By Type, 2013�2020 (Kiloton)
Table 53 Europe: Phosphorus & Derivatives Market Size, By Type, 2013�2020 (USD Million)
Table 54 France.: Phosphorus & Derivatives Market Size, By Type, 2013�2020 (Kiloton)
Table 55 France: Phosphorus & Derivatives Market Size, By Type, 2013�2020 (USD Million)
Table 56 Spain: Phosphorus & Derivatives Market Size, By Type, 2013�2020 (Kiloton)
Table 57 Spain: Phosphorus & Derivatives Market Size, By Type, 2013�2020 (USD Million)
Table 58 Africa: Phosphorus & Derivatives Market Size, By Application, 2013�2020 (Kiloton)
Table 59 Africa: Phosphorus & Derivatives Market Size, By Type, 2013�2020 (Kiloton)
Table 60 Africa: Phosphorus & Derivatives Market Size, By Type, 2013�2020 (USD Million)
Table 61 Oceania: Phosphorus & Derivatives Market Size, By Application, 2013�2020 (Kiloton)
Table 62 Oceania: Phosphorus & Derivatives Market Size, By Type, 2013�2020 (Kiloton)
Table 63 Oceania: Phosphorus & Derivatives Market Size, By Type, 2013�2020 (USD Million)
Table 64 The Middle East: Phosphorus & Derivatives Market Size, By Application, 2013�2020 (Kiloton)
Table 65 The Middle East: Phosphorus & Derivatives Market Size, By Type, 2013�2020 (Kiloton)
Table 66 The Middle East: Phosphorus & Derivatives Market Size, By Type, 2013�2020 (USD Million)
Table 67 Mergers & Acquisition, 2010�2015
Table 68 Expansion, 2010�2015
Table 69 Supply Contract, 2010�2015
Table 70 Joint Ventures, 2010�2014
Table 71 New Product Launches, 2010�2014
Table 72 Agrium Inc.: Products & Their Description
Table 73 OCP SA: Products & Their Descriptions
Table 74 Mosaic Co: Products & Their Description
Table 75 Eurochem: Products & Their Descriptions
Table 76 Chemische Fabrik Budenheim Kg: Products & Their Descriptions
Table 77 CF Industries Holdings, Inc.: Products & Their Descriptions
Table 78 Innophos Holdings, Inc.: Products & Their Descriptions
Table 79 Israel Chemical Ltd.: Products & Their Descriptions
Table 80 Kazphosphate LLC: Products & Their Descriptions
Table 81 Lanxess AG: Products & Their Applications
Table 82 OJSC Phosagro AG: Products & Their Descriptions
Table 83 Potash Corp of Saskatchewan Inc. : Products & Their Descriptions
Table 84 Prayon S.A: Products & Their Descriptions
Table 85 Rhodia: Products & Their Descriptions
Table 86 United Phosphorus Limited (UPL): Products & Their Descriptions
List of Figures (78 Figures)
Figure 1 Phosphorus & Derivatives Market, Research Design
Figure 2 Key Data From Secondary Sources
Figure 3 Key Data From Primary Sources
Figure 4 Key Industry Insights
Figure 5 Breakdown of Primary Interviews, By Company Type, Designation & Region
Figure 6 Market Size Estimation: Bottom-Up Approach
Figure 7 Market Size Estimation: Top-Down Approach
Figure 8 Phosphorus & Derivatives Market: Data Triangulation
Figure 9 Ammonium Phosphate to Dominate the Phosphorus & Derivatives Market, 2015�2020
Figure 10 Phosphorus & Derivatives for Flame Retardant Material to Register the Highest CAGR Between 2015 & 2020
Figure 11 The Middle East and Africa to Register Higher CAGR Between 2015 & 2020
Figure 12 High Growth in the Phosphorus & Derivatives Market Between 2015 & 2020
Figure 13 Asia is Estimated to Be Major Market for Phosphorus & Derivatives Between 2015 & 2020
Figure 14 Asia Phosphorus & Derivatives Market Size
Figure 15 Emerging Economies and Rapid Industrialization in Asia Expected to Boost the Demand for Phosphorus & Derivatives Between 2015 & 2020
Figure 16 Fertilizers Dominated the Phosphorus & Derivatives Market in 2014
Figure 17 Africa to Experience High Growth in the Forecast Period for Phosphorus & Derivatives
Figure 18 Phosphorus & Derivatives, Market Segmentation
Figure 19 Overview of the Forces Governing the Phosphorus & Derivatives Market
Figure 20 Value Chain Analysis for Phosphorus & Derivatives: Raw Material Accounts for the Major Value Addition
Figure 21 Porter�s Five Forces Analysis
Figure 22 Strategic Benchmarking: OCP S.A. Have Improved Their Product Offerings Through Acquisitions
Figure 23 Strategic Benchmarking: Prayon S.A. Focused on Expansions to Capture A Large Share of the Market
Figure 24 Strategic Benchmarking: OCP S.A. Have Improved Their Market By Supply Contracts
Figure 25 Yellow Phosphorus Applications
Figure 26 Yellow Phosphorus: Electrothermal Process
Figure 27 Phosphorus Pentasulfide to Register the Highest CAGR During the Forecast Period
Figure 28 Phosphorus Chloride to Register the Highest CAGR in the Next Five Years (2015�2020)
Figure 29 Ammonium Phosphate to Lead the Phosphorus & Derivatives Market During 2015-2020
Figure 30 Water Treatment Chemicals to Register the Highest CAGR in the Next Five Years (2015�2020)
Figure 31 Flame Retardant Material to Register the Highest CAGR in the Next Five Years (2015�2020)
Figure 32 Growing Population is Expected to Drive Asia Market for Fertilizers During Forecast Period
Figure 33 Laundries to Drive Asia Market for Detergents Between 2015-2020
Figure 34 Food & Beverages Driving Americas Food Industry Market During Forecast Period
Figure 35 Fresh Water Demand Driving Asian Market for Water Treatment Chemicals Between 2015 and 2020
Figure 36 Metal Polishing to Drive Asian Market for Metal Finishing During the Forecast Period
Figure 37 Red Phosphorus to Drive Asian Market for Flame Retardant Material During Forecast Period
Figure 38 Phosphoric Acid and Phosphate Salts to Drive Asian Market for Other Applications of Phosphorus & Derivatives Between 2015 & 2020
Figure 39 Regional Snapshot (2015-2020): China & India are Emerging as New Strategic Location
Figure 40 Asia Likely to Be the Fastest-Growing Markets for Phosphorus & Derivatives Between 2015 & 2020
Figure 41 Asia Market Snapshot: Phosphorus & Derivatives (2014�2020)
Figure 42 Americas Market Snapshot: Phosphorus & Derivatives (2014�2020)
Figure 43 Europe Market Snapshot: Phosphorus & Derivatives (2014�2020)
Figure 44 Africa Market Snapshot: Phosphorus & Derivatives (2014�2020)
Figure 45 Oceania Market Snapshot: Phosphorus & Derivatives (2014�2020)
Figure 46 The Middle East Market Snapshot: Phosphorus & Derivatives (2014�2020)
Figure 47 Companies Primarily Adopted Inorganic Growth Strategies Between 2010-2015
Figure 48 Key Growth Strategies in Global Phosphorus & Derivatives Market, 2010�2015
Figure 49 Merger & Acquisition in Europe Made It the Most Active Region During 2010-2015
Figure 50 Phosphorus & Derivatives Market Developmental Share, 2010�2015
Figure 51 Global Phosphorus & Derivatives Market: Growth Strategies, By Company, 2010�2015
Figure 52 Regional Revenue Mix of Top Five Market Player
Figure 53 Agrium Inc: Company Snapshot
Figure 54 Agrium Inc : SWOT Analysis
Figure 55 OCP S.A: Company Snapshot
Figure 56 OCP S.A.: SWOT Analysis
Figure 57 Mosaic Co: Company Snapshot
Figure 58 Mosaic Co: SWOT Analysis
Figure 59 Eurochem: Company Snapshot
Figure 60 Eurochem: SWOT Analysis
Figure 61 Yara International ASA: Company Snapshot
Figure 62 Yara International ASA: SWOT Analysis
Figure 63 Akron OAO: Company Snapshot
Figure 64 Chemische Fabrik Budenheim Kg: Company Snapshot
Figure 65 CF Industries Holdings, Inc.: Company Snapshot
Figure 66 Innophos Holdings, Inc.: Company Snapshot
Figure 67 Israel Chemical Ltd.: Company Snapshot
Figure 68 Italmatch Chemicals S.P.A: Company Snapshot
Figure 69 Kazphosphate LLC: Company Snapshot
Figure 70 Lanxess AG: Company Snapshot
Figure 71 OJSC Phosagro AG: Company Snapshot
Figure 72 Potash Corp of Saskatchewan Inc.: Company Snapshot
Figure 73 Prayon S.A: Company Snapshot
Figure 74 Saudi Arabian Mining Company (Ma�aden) : Company Snapshot
Figure 75 Solvay Rhodia: Company Snapshot
Figure 76 United Phosphorus Limited (UPL): Company Snapshot
Figure 77 Vale S.A.: Company Snapshot
Figure 78 Yuntianhua Group Co., Ltd: Company Snapshot


Growth opportunities and latent adjacency in Phosphorus & Derivatives Market
outlook of the food and technical grade phosphoric acid market...and the trends
Liquid Urea, DEF (Diesel Exhaust Fluid), UAN (Urea Ammonium Nitrate), Granular urea for US.
Interested in phosphorus chloride, red phosphorus and phosphorus pentasulphide, especially segmentation and market growth forecasts.
Interested in phosphorus chloride, red phosphorus and phosphorus pentasulphide, especially segmentation and market growth forecasts.