Plant Asset Management Market (PAM) by Offering (Software and Services), Deployment Mode (Cloud-based and On Premises), Asset Type (Production Assets and Automation Assets), End-user Industry (Process and Discrete), and Geography - Global Forecast


Plant Asset Management Marke
Plant Asset Management Market and Top Companie
Emerson Electric Co. (U.S.)
Emerson Electric Co. manufactures and develops process controls, systems, valves, and analytical instruments. The company offers industrial, commercial, automation, and residential solutions worldwide. It operates through 2 business segments—Automation Solutions and Commercial & Residential Solutions. The company has 220 manufacturing locations in 150 countries, primarily in Europe and Asia. Emerson Electric provides PAM solutions under its Automation Solutions segment. It serves industries such as petroleum, chemicals, food & beverages, pulp & paper, pharmaceuticals, and water & wastewater treatment. The company focuses on expanding its product portfolio and improving its offerings to meet the ever-changing needs of its customers across various end-user industries. For instance, in July 2019, the company modified its AMS Device Manager Software solution with HART-IP support, and in September 2019, Emerson launched the AMS Asset Monitor edge analytics device.
Rockwell (US)
Rockwell Automation, Inc. is one of the world’s largest companies providing industrial automation power, control, and information solutions. The company operates in 2 major business segments, namely, Architecture & Software and Control Products & Solutions. The Architecture & Software segment includes hardware, software, and communication components of the company's integrated control and information architecture capable of controlling customers’ industrial processes and connecting with their manufacturing enterprise. Rockwell Automation has a strong market position in the asset management field. The company emphasizes on product improvements. For instance, in July 2019, the company upgraded its FactoryTalk AssetCentre Software to protect a wider range of assets. Moreover, the company is aggressively involved in mergers and acquisitions to increase its market share in countries other than the US. In October 2019, Rockwell acquired MESTECH Services to expand its consulting and system integration scale in the fast-growing transformation market.
ABB Ltd. (Switzerland)
ABB Ltd., a global leader in power and automation technologies. The ABB Group was founded in 1988 after the merger of Asea AB (Sweden) and BBC Brown Boveri AG (Switzerland). It operates mainly in areas such as robotics, power, heavy electrical equipment, and automation technology. The company has presence in Europe, the Americas, Asia, Africa, and the Middle East. ABB mainly operates in 3 business segments—Electrification Products, Robotics and Motion, and Industrial Automation. The company strives to increase its profit margins by strengthening its product competitiveness, adopting inorganic strategies, and lowering market-related risks. ABB has launched ABB Ability, a unified, cross-industry digital offering, to accelerate profitable growth. A significant portion of ABB’s R&D investments is utilized for its Industrial Automation business segment, which develops PAM solutions. In addition, ABB significantly invests in R&D to thrive in a competitive environment.
Honeywell (US)
Honeywell International, Inc. is a diversified technology and manufacturing company operating in 4 business segments—Aerospace, Performance Materials and Technologies, Honeywell Building Technologies, and Safety and Productivity Solutions. Honeywell International, Inc. offers PAM solutions under its business segment Safety and Productivity Solutions. The company is known for its total solution capabilities, life cycle services, and vertical domain expertise. It serves industries such as chemicals & petrochemicals, oil & gas, mining, pharmaceuticals, and pulp & paper. Honeywell offers process-centric PAM solutions that help users to increase operational performance and decrease unplanned downtime, as well as enable faster and more accurate decision-making. Its asset management solutions cover all the elements of condition monitoring, reliability, and maintenance management. These solutions are designed for integrated enterprise-wide, real-time monitoring of assets.
Siemens AG (Germany).
Siemens AG is a technology company with core activities in the field of automation, electrification, and digitalization. The company is a leading supplier of power transmission, power generation, and infrastructure solutions, coupled with automation, drive, and software solutions. Siemens operates in 9 business segments, namely, Siemens Healthineers; Digital Factory; Power and Gas; Energy Management; Siemens Gamesa Renewable Energy; Process Industries and Drives; Mobility; Building Technologies; and Financial Services (SFS). The company’s Process Industries and Drives division offers PAM solutions such as process control solutions and plant engineering software.
Plant Asset Management Market and Top End-user Industries
Oil & Gas
In the oil & gas industry, PAM solutions are used to track material asset movements. Similarly, these solutions also help oil and gas plants to reduce operational costs, without increasing any risk pertaining to unplanned downtime or employee and environment safety. Also, real-time information about production floor operations offered by these solutions enables effective decision-making. Further, the plant safety and reliability are crucial for the management of plant assets.
Automotive
The automotive industry is increasingly relying on digital technologies to ensure its growth. The growth of the automotive industry is also driven by huge capital investments by market players in untapped markets of emerging economies. Technological innovations such as electric and gas-powered vehicles lead to infrastructural changes in the automotive industry; also, latest machines and equipment replaced the need for human operators for most of the crucial processes in the automotive industry for precise accuracy, which, in turn, accelerates the demand for PAM solutions for automation assets used in automobile manufacturing plants.
Aerospace & Defense
PAM solutions are used in the aerospace & defense industry to achieve multiple objectives. In the aerospace & defense industry, it is highly critical to optimize asset utilization and minimize the maintenance cost. PAM solutions are used in the aerospace & defense industry to monitor component supply, improve product quality, reduce production cycle, and optimize manufacturing processes.
Energy & Power
The power industry is growing rapidly because of globally rising demand for energy. This results in high pressure on power manufacturing companies to deliver cheap and reliable energy. Also, it becomes necessary for power manufacturing companies to utilize available resources efficiently, reduce the maintenance cost, and further enhance the plant performance. PAM solutions help power plant owners, operators, and original equipment manufacturers (OEMs) in the power industry to make improved business decisions on the performance and operational readiness of their plant equipment.
Semiconductor & Electronics
Increasing demand for consumer electronic devices encourages growth of the semiconductor & electronics manufacturing industry across the world. The industry is highly competitive and forces manufacturers to reduce the operational cost. Hence, PAM solutions are adopted by semiconductor and electronics manufacturing companies to ensure overall manufacturing excellence and reduce unnecessary wastage of raw materials. PAM solutions help not only to lower inventory and supply chain management costs but also to improve the production output, which further enhances the overall performance of the plant.
Plant Asset Management Market and Top offerings
Software Solutions
Plant asset management is a software framework that provides information about the asset condition, as well as helps optimize operations and improve plant asset capabilities. Also, PAM solutions focus on the risk reduction factor, along with providing manufacturers warnings about the impending system and process failures and degrading the performance of plant assets. Reduction in the unplanned downtime and operational costs, optimum utilization of plant assets, and increased returns on investment are the primary factors responsible for the growth of the PAM market.
Services
Services offered under the plant asset management market include effective management of critical plant assets to achieve long-term operational benefits. The services segment also covers training, software upgrades, technical support, and customizations offered to different industries. Such services help manufacturers to optimize asset utilization, maintain and improve the quality of assets and processes, while management can gain visibility into the manufacturing process with minimal document compliance.
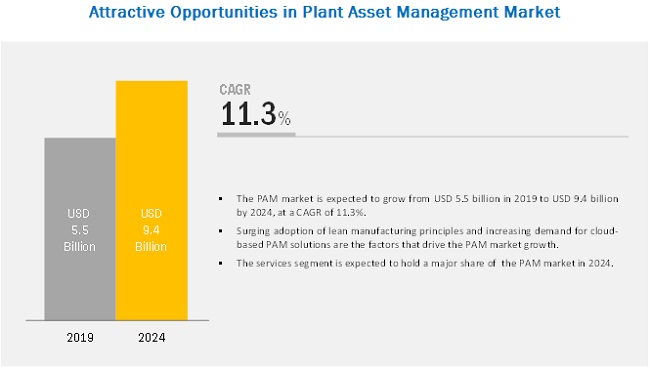
[178 Pages Report] The plant asset management market is expected to grow from USD 5.5 billion in 2019 to USD 9.4 billion by 2024, at a CAGR of 11.3%. The market’s growth is propelled by surging adoption of lean manufacturing practices by several organizations, increasing focus on providing cloud-based PAM solutions to satisfy customer demands, escalating demand for asset management software that can identify potential failures to avoid futuristic loss, and growing need for real-time data analytics.
Plant Asset Management Market for cloud-based (online) deployment to grow at higher CAGR from 2019 to 2024
The market for cloud-based (online) PAM solutions is expected to grow at the highest CAGR during the forecast period. The adoption of cloud-based (online) PAM software solutions is the most suitable option for small and medium-sized enterprises due to its low cost. Quick installation and easy access to cloud save time and help end-user industries to make better decisions to improve efficiency, as well as focus on other important business parameters.
Automation assets to exhibit high growth in PAM market during forecast period
The plant asset management market for automation assets is expected to register the highest CAGR during the forecast period. Increasing adoption of automation systems to enhance the production capacity in the process industries. However, different types of automation systems such as programmable logic controllers (PLCs) and distributed control systems (DCSs) find applications in discrete industries, thereby fueling the demand for PAM solutions for effective handling of automation assets too.
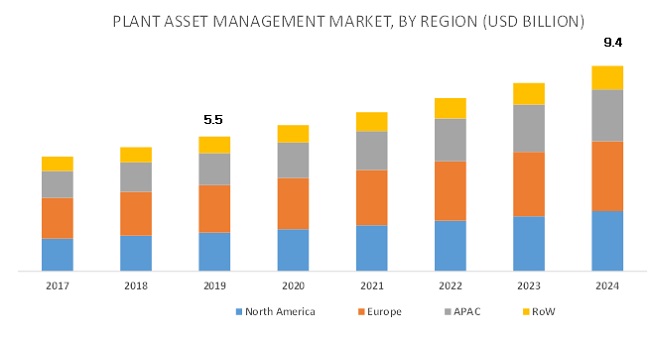
Plant Asset Management Market in APAC to grow at highest CAGR during forecast period
The PAM market in APAC is expected to grow at the highest CAGR during the forecast period. The adoption of PAM solutions is high in APAC due to the growing manufacturing sector in the region. Most of the key manufacturers from different industries have shifted their manufacturing plants in APAC due to the low labor cost and availability of a skilled workforce. These manufacturing units are using asset management solutions for the improvement in the overall manufacturing processes, which is expected to drive the growth of the PAM market in the region.
Key Market Players
As of 2018, Emerson (US), Honeywell (US), Rockwell (US), ABB (Switzerland), Schneider (France), Yokogawa (Japan), General Electric (US), and Siemens (Germany) dominated the PAM market.
Emerson Electric Co. (U.S.)
Emerson Electric Co. manufactures and develops process controls, systems, valves, and analytical instruments. The company offers industrial, commercial, automation, and residential solutions worldwide. It operates through 2 business segments—Automation Solutions and Commercial & Residential Solutions. The company has 220 manufacturing locations in 150 countries, primarily in Europe and Asia. Emerson Electric provides PAM solutions under its Automation Solutions segment. It serves industries such as petroleum, chemicals, food & beverages, pulp & paper, pharmaceuticals, and water & wastewater treatment. The company focuses on expanding its product portfolio and improving its offerings to meet the ever-changing needs of its customers across various end-user industries. For instance, in July 2019, the company modified its AMS Device Manager Software solution with HART-IP support, and in September 2019, Emerson launched the AMS Asset Monitor edge analytics device.
Rockwell (US)
Rockwell Automation, Inc. is one of the world’s largest companies providing industrial automation power, control, and information solutions. The company operates in 2 major business segments, namely, Architecture & Software and Control Products & Solutions. The Architecture & Software segment includes hardware, software, and communication components of the company's integrated control and information architecture capable of controlling customers’ industrial processes and connecting with their manufacturing enterprise. Rockwell Automation has a strong market position in the asset management field. Rockwell emphasizes on product improvements. For instance, in July 2019, the company upgraded its FactoryTalk AssetCentre Software to protect a wider range of assets. Moreover, the company is aggressively involved in mergers and acquisitions to increase its market share in countries other than the US. In October 2019, Rockwell acquired MESTECH Services to expand its consulting and system integration scale in the fast-growing transformation market.
ABB Ltd. (Switzerland)
ABB Ltd., a global leader in power and automation technologies. The ABB Group was founded in 1988 after the merger of Asea AB (Sweden) and BBC Brown Boveri AG (Switzerland). It operates mainly in areas such as robotics, power, heavy electrical equipment, and automation technology. The company has presence in Europe, the Americas, Asia, Africa, and the Middle East. ABB mainly operates in 3 business segments—Electrification Products, Robotics and Motion, and Industrial Automation. The company strives to increase its profit margin by strengthening its product competitiveness, adopting inorganic strategies, and lowering market-related risks. ABB has launched ABB Ability drives to accelerate profitable growth. A significant portion of ABB’s R&D investments is utilized for its Industrial Automation business segment, which develops PAM solutions. In addition, ABB significantly invests in R&D to thrive in a competitive environment. In FY 2018, its R&D expenditure was USD 1.2 billion, that is, 4.1% of its total revenue. Further, the company is capitalized on partnerships with other professional third-party solution providers to ensure mutual profit and growth.
Other companies involved in the development of the PAM market are AB SKF (Sweden), Endress+Hauser Management AG (Switzerland), General Electric Co. (US), Rockwell Automation, Inc. (US), Schneider Electric SA (France), Yokogawa (Japan), and Siemens AG (Germany).
Report Scope:
|
Report Metric |
Details |
|
Report Name |
Plant Asset Management Market |
|
Base year |
2018 |
|
Forecast period |
2019–2024 |
|
Forecast units |
Value (USD) in million/billion |
|
Segments covered |
Offering, asset type, deployment mode, and industry |
|
Regions covered |
North America, APAC, Europe, and RoW |
|
Companies covered |
Emerson (US), Honeywell (US), Rockwell (US), ABB (Switzerland), Schneider (France), Yokogawa (Japan), General Electric (US), Siemens (Germany), Etc. |
In this report, the overall Plant Asset Management Market is segmented into offering, asset type, deployment mode, industry, and geography.
Plant Asset Management Market By Offering:
- Software Solutions
- Services
Plant Asset Management Market By Deployment Mode:
- Cloud-based (Online) Deployment
- On-premises (Offline) Deployment
Plant Asset Management Market By Asset Type:
-
Production Assets
- Motors, Rotating, Reciprocating Equipment
- Process & Mechanical Equipment
- Remote Equipment, Wiring and Other Electrical Equipment
-
Automation Assets
- Field Devices
- Control Valves and Positioners, and Associated Equipment
Plant Asset Management Market By Industry:
-
Process Industries
-
- Chemicals
- Energy & Power
- Food & Beverages
- Metals & Mining
- Oil & Gas
- Pharmaceuticals & Biotechnology
- Pulp & Paper
- Water & Wastewater
-
-
Discrete Industries
-
- Aerospace & Defense
- Automotive
- Semiconductor & Electronics
- Medical Devices
-
Geographic Analysis
-
North America
- US
- Canada
- Mexico
-
Europe
- Germany
- UK
- France
- Italy
- Rest of Europe
-
Asia Pacific (APAC)
- China
- Japan
- India
- South Korea
- Rest of APAC
-
Rest of the World (RoW)
- South America
- Middle East & Africa
Critical Questions:
- Which type of offering in PAM is expected to have the highest demand in the future?
- Who are the top 5 players in the PAM market?
- What would be the growth opportunities for manufacturers in various industries?
- What are the key industry trends in the market?
- How can cloud-based solution providers tap high-growth opportunities in the PAM market?
Frequently Asked Questions (FAQ):
What is the potential opportunity for plant asset management market by 2024?
The plant asset management market is projected to reach USD 9.4 billion 2024.
Which is the fastest growing region in the plant asset management market?
The plant asset management market in APAC is expected to grow at the highest CAGR.
Which industry holds the maximum share of the plant asset management market?
The process industry accounted for the largest share.
Which asset type has gained the highest traction in the global plant asset management market?
The production asset type segment to gain the highest traction in the global plant asset management market.
Which are the major companies in the plant asset management market?
Emerson (US), Honeywell (US), Rockwell (US), ABB (Switzerland), Schneider (France), Yokogawa(Japan), General Electric (US), and Siemens (Germany) are major companies in the plant asset management market.
To speak to our analyst for a discussion on the above findings, click Speak to Analyst
Table of Contents
1 Introduction (Page No. - 20)
1.1 Study Objectives
1.2 Market Definition and Scope
1.2.1 Inclusions and Exclusions
1.3 Study Scope
1.3.1 Markets Covered
1.3.2 Years Considered
1.4 Currency
1.5 Limitations
1.6 Stakeholders
2 Research Methodology (Page No. - 23)
2.1 Research Data
2.1.1 Secondary & Primary Research
2.1.2 Secondary Data
2.1.2.1 Secondary Sources
2.1.3 Primary Data
2.1.3.1 Key Data From Primary Sources
2.1.3.2 Key Industry Insights
2.1.3.3 Breakdown of Primaries
2.2 Market Size Estimation
2.2.1 Bottom-Up Approach
2.2.1.1 Approach for Arriving at Market Share By Bottom-Up Analysis (Demand Side)
2.2.2 Top-Down Approach
2.2.2.1 Approach for Capturing Market Share By Top-Down Analysis (Supply Side)
2.3 Market Breakdown and Data Triangulation
2.4 Research Assumptions
3 Executive Summary (Page No. - 33)
4 Premium Insights (Page No. - 37)
4.1 Attractive Growth Opportunities in Plant Asset Management Market
4.2 PAM Market, By Industry
4.3 PAM Market, By Asset Type
4.4 PAM Market, By Deployment Mode
4.5 PAM Market, By Offering
4.6 PAM Market, By Region
5 Market Overview (Page No. - 40)
5.1 Introduction
5.2 Market Dynamics
5.2.1 Drivers
5.2.1.1 Surging Adoption of Lean Manufacturing Practices By Several Organizations
5.2.1.2 Increasing Focus on Providing Cloud-Based PAM Solutions to Satisfy Customer Demands
5.2.1.3 Growing Need for Real-Time Data Analytics
5.2.1.4 Escalating Demand for Asset Management Software That Can Identify Potential Failures to Avoid Futuristic Loss
5.2.2 Restraints
5.2.2.1 High Initial Investment and Need for Periodic Upgrading of PAM Solutions Limiting Their Demand
5.2.2.2 Lack of Clear Guidance By Suppliers and Vendors About Product Suitability
5.2.3 Opportunities
5.2.3.1 Increasing Investments in Greenfield Projects
5.2.4 Challenges
5.2.4.1 Less Acceptance From Operators Due to Lack of Technical Know-How and Fear of Job Loss
6 Industry Trends (Page No. - 44)
6.1 Introduction
6.2 Value Chain Analysis
6.3 Key Use Cases
6.3.1 North American Utility Company Deployed ABB Ability Asset Suite Portfolio Offered By ABB Limited
6.3.2 ABB Ability Asset Health Center Performance Management Software Used in Inner Mongolia Electric Power Research Institute (Imepri)
6.3.3 Kahramaa Found Grid Reliability With Power Grid Asset Performance Management Software By Ge
6.3.4 Honeywell Supported Japanese Turbocharger Plant to Improve Performance Monitoring Technology
6.3.5 Akzo Nobel Deployed AMS Device Manager to Reduce Maintenance Costs and Unscheduled Shutdowns
6.3.6 Chobani Deployed Asset Management Services From Rockwell Automation
6.3.7 AMS Device Manager From Emerson Was Used for Online Monitoring and Diagnostics at Aksu Power Plant
6.3.8 EMS GmbH Used Software and Online Tools From Endress+Hauser for Improving Plant Efficiency
6.4 Industry Trends
6.4.1 IIoT Connectivity
6.4.2 Cloud Platform
6.4.3 Predictive Maintenance
6.4.4 Digital Twin
6.4.5 Communication Protocol
7 Plant Asset Management Market, By Offering (Page No. - 49)
7.1 Introduction
7.2 Software Solutions
7.2.1 PAM Software Solutions Help Improve Operational Efficiency of Business Processes
7.3 Services
7.3.1 Industry-Specific PAM Services for Expanding Vertical Expertise
8 Plant Asset Management Market, By Deployment Mode (Page No. - 54)
8.1 Introduction
8.2 On-Premises (Offline) Deployment
8.2.1 Increasing Safety and Security Concerns Force End-User Industries to Adopt PAM Solutions That are Deployed On-Premises (Offline)
8.3 Cloud-Based (Online) Deployment
8.3.1 Growing Inclination Toward Cloud-Based Asset Management Owing to Its Assistance in Utilizing Assets and Resources Optimally
9 Plant Asset Management Market, By Asset Type (Page No. - 60)
9.1 Introduction
9.2 Production Assets
9.2.1 PAM Solutions are in Demand for Monitoring Rotating and Reciprocating Equipment
9.2.1.1 Motors, Rotating, and Reciprocating Equipment
9.2.1.2 Process and Mechanical Equipment
9.2.1.3 Remote Equipment, Wiring, and Other Electrical Equipment
9.3 Automation Assets
9.3.1 Presence of Several Automation Solution Providers Drives Growth of PAM Market for Automation Assets
9.3.2 Field Devices
9.3.3 Control Valves & Positioners and Associated Equipment
10 Plant Asset Management Market, By Industry (Page No. - 70)
10.1 Introduction
10.2 Process Industries
10.2.1 Chemicals
10.2.1.1 Growing Focus of Chemical Companies to Ensure Asset Reliability and Improve Operational Efficiency to Boost Demand for PAM Solutions
10.2.2 Energy & Power
10.2.2.1 Surging Adoption of Control and Automation Solutions in Power Industry to Foster PAM Market Growth
10.2.3 Food & Beverages
10.2.3.1 Increasing Use of PAM Solutions to Extract Large Volumes of Data to Accelerate PAM Market Growth for Food & Beverages Industry
10.2.4 Metals & Mining
10.2.4.1 Rising Need for Predictive Maintenance in Metals & Mining Industry Fuels Adoption of PAM Solutions
10.2.5 Oil & Gas
10.2.5.1 Growing Use of Corrosion Monitoring Systems in Oil and Gas Plants to Foster PAM Market Growth
10.2.6 Pharmaceuticals and Biotechology
10.2.6.1 Increasing Adoption of PAM Solutions Due to Complex Manufacturing Processes in Pharmaceutical Plants
10.2.7 Pulp & Paper
10.2.7.1 Rising Need to Reduce Waste and Improve Product Consistency to Drive Demand for PAM Solutions in Pulp & Paper Industry
10.2.8 Water & Wastewater
10.2.8.1 Increasing Use of PAM Solutions to Monitor Asset Conditions and Ensure Their Long-Term Sustainability Boosts Growth of PAM Market for Water & Wastewater Industry
10.3 Discrete Industries
10.3.1 Aerospace & Defense
10.3.1.1 High Equipment Cost Encourages Adoption of PAM Solutions to Avoid Asset Failure Risks
10.3.2 Automotive
10.3.2.1 Technological Advancements in Automotive Industry Drive PAM Market Growth
10.3.3 Semiconductor & Electronics
10.3.3.1 Intense Competition Among Semiconductor & Electronic Manufacturing Companies Drives Demand for PAM Solutions to Enhance Plant Productivity
10.3.4 Medical Devices
10.3.4.1 Adoption of PAM Solutions Enabling Higher Efficiency Into Medical Devices Industry
11 Geographic Analysis (Page No. - 104)
11.1 Introduction
11.2 North America
11.2.1 US
11.2.1.1 Growing Focus of Key Players on Developing Innovative PAM Products, Coupled With Increasing Investments in Green Energy Projects, to Accelerate PAM Market Growth in US
11.2.2 Canada
11.2.2.1 Increasing Demand for PAM Solutions From Oil & Gas Industry
11.2.3 Mexico
11.2.3.1 Growing Inclination of Mexican Manufacturers Toward Utilization of IIoT Technology in Industrial Plants
11.3 Europe
11.3.1 UK
11.3.1.1 Increasing Adoption of PAM Solutions in Automotive and Energy & Power Industries
11.3.2 Germany
11.3.2.1 Surging Demand for PAM Solutions From Highly Competitive and Innovative Automobile Companies in Germany
11.3.3 France
11.3.3.1 Growing Manufacturing Sector in France Boosts Adoption of PAM Solutions
11.3.4 Italy
11.3.4.1 Increasing Efforts of Italian Utilities Toward Effective Management of Plant Assets to Drive Demand for PAM Solutions in Country
11.3.5 Rest of Europe
11.4 APAC
11.4.1 China
11.4.1.1 Increasing Number of Manufacturing Activities Expected to Fuel Growth of PAM Market in China
11.4.2 Japan
11.4.2.1 Growing Focus of Country on Implementing Smart Factory Solutions to Accelerate Demand for PAM Solutions
11.4.3 India
11.4.3.1 Growing Manufacturing Industry as Output of Make in India Campaign to Register Country as Fastest-Growing Market in APAC
11.4.4 South Korea
11.4.4.1 Rising Adoption of PAM Solutions in Discrete Industries to Lead Significant Growth in South Korean Market
11.4.5 Rest of APAC
11.5 Rest of the World
11.5.1 South America
11.5.1.1 Growing Awareness About Advantages of PAM Solutions Expected to Increase Their Demand in Brazil
11.5.2 Middle East and Africa
11.5.2.1 Increasing Adoption of PAM Solutions in Oil and Gas and Mining Facilities to Propel Market Growth in Middle East and Africa
12 Competitive Landscape (Page No. - 127)
12.1 Overview
12.2 Market Ranking Analysis
12.3 Competitive Leadership Mapping, 2018
12.3.1 Visionaries
12.3.2 Innovators
12.3.3 Dynamic Differentiators
12.3.4 Emerging Companies
12.4 Strength of Product Portfolio (For 25 Companies)
12.5 Business Strategy Excellence (For 25 Companies)
12.6 Competitive Situations and Trends
12.6.1 Contracts, Agreements, Collaborations, and Partnerships
12.6.2 Product Launches and Developments
12.6.3 Acquisitions
13 Company Profiles (Page No. - 137)
(Business Overview, Products & Services Offered, Recent Developments, SWOT Analysis, and MnM View)*
13.1 Key Players
13.1.1 ABB LTD.
13.1.2 Emerson Electric Co.
13.1.3 Honeywell International, Inc.
13.1.4 Rockwell Automation, Inc.
13.1.5 Siemens AG
13.1.6 Yokogawa Electric Corporation
13.1.7 General Electric Co.
13.1.8 Endress+Hauser AG
13.1.9 Schneider Electric SE
13.1.10 SKF Group
13.2 Right to Win
13.3 Other Key Players
13.3.1 Dassault Systèmes
13.3.2 Petrofac
13.3.3 Entsika
13.3.4 Opentext
13.3.5 Phoenix AMC
13.3.6 SMAR International Corporation
13.3.7 IBM
13.3.8 Hexagon PPM
13.3.9 Aspen Tech
13.3.10 Bentley Systems
13.3.11 Nexus Global Business Solutions, Inc.
13.3.12 Infoplus Technologies UK Limited
13.3.13 Hubhead Corp.
13.3.14 DNR Process Solution Pte LTD
13.3.15 Plantvision AB
*Details on Business Overview, Products & Services Offered, Recent Developments, SWOT Analysis, and MnM View Might Not Be Captured in Case of Unlisted Companies.
14 Appendix (Page No. - 171)
14.1 Insights of Industry Experts
14.2 Discussion Guide
14.3 Knowledge Store: Marketsandmarkets’ Subscription Portal
14.4 Available Customizations
14.5 Related Reports
14.6 Author Details
List of Tables (109 Tables)
Table 1 Plant Asset Management Market, By Offering, 2017–2024 (USD Billion)
Table 2 PAM Market for Software Solutions, By Region, 2017–2024 (USD Million)
Table 3 PAM Market for Services, By Region, 2017–2024 (USD Million)
Table 4 PAM Market, By Deployment Mode, 2017–2024 (USD Billion)
Table 5 Market for Process Industries, By Deployment Mode, 2017–2024 (USD Million)
Table 6 Market for Discrete Industries, By Deployment Mode, 2017–2024 (USD Million)
Table 7 Market for On-Premises (Offline) Deployment Mode, By Process Industry, 2017–2024 (USD Million)
Table 8 Market for On-Premises (Offline) Deployment Mode, By Discrete Industry, 2017–2024(USD Million)
Table 9 Market for Cloud-Based (Online) Deployment, By Process Industry, 2017–2024 (USD Million)
Table 10 Market for Cloud-Based (Online) Deployment, By Discrete Industry, 2017–2024 (USD Million)
Table 11 Market, By Asset Type, 2017–2024 (USD Billion)
Table 12 Market for Process Industries, By Asset Type, 2017–2024 (USD Million)
Table 13 Market for Discrete Industries, By Asset Type, 2017–2024 (USD Million)
Table 14 Market for Production Assets, By Region, 2017–2024 (USD Million)
Table 15 Market in North America for Production Assets, By Industry, 2017–2024 (USD Million)
Table 16 Market in Europe for Production Assets, By Industry, 2017–2024 (USD Million)
Table 17 Market in APAC for Production Assets, By Industry, 2017–2024 (USD Million)
Table 18 Market in RoW for Production Assets, By Industry, 2017–2024 (USD Million)
Table 19 Market for Production Assets, By Process Industry, 2017–2024 (USD Million)
Table 20 Market for Production Assets, By Discrete Industry, 2017–2024 (USD Million)
Table 21 Market for Automation Assets, By Region, 2017–2024 (USD Million)
Table 22 Market in North America for Automation Assets, By Industry, 2017–2024 (USD Million)
Table 23 Market in Europe for Automation Assets, By Industry, 2017–2024 (USD Million)
Table 24 Market in APAC for Automation Assets, By Industry, 2017–2024 (USD Million)
Table 25 Market in RoW for Automation Assets, By Industry, 2017–2024 (USD Million)
Table 26 Market for Automation Assets, By Process Industry, 2017–2024 (USD Million)
Table 27 Market for Automation Assets, By Discrete Industry, 2017–2024 (USD Million)
Table 28 Plant Asset Management Market, By Industry, 2017–2024 (USD Billion)
Table 29 Market, By Process Industry, 2017–2024 (USD Million)
Table 30 Market for Process Industries, By Region, 2017–2024 (USD Million)
Table 31 Market for Process Industries, By Asset Type, 2017–2024 (USD Million)
Table 32 Market in North America for Process Industries, By Asset Type, 2017–2024 (USD Million)
Table 33 Market in Europe for Process Industries, By Asset Type, 2017–2024 (USD Million)
Table 34 Market in APAC for Process Industries, By Asset Type, 2017–2024 (USD Million)
Table 35 Market in RoW for Process Industries, By Asset Type, 2017–2024 (USD Million)
Table 36 Market for Process Industries, By Deployment Mode, 2017–2024 (USD Million)
Table 37 Market for Chemicals Industry, By Region, 2017–2024 (USD Million)
Table 38 Market for Chemicals Industry, By Asset Type, 2017–2024 (USD Million)
Table 39 Market for Chemicals Industry, By Deployment Mode, 2017–2024 (USD Million)
Table 40 Market for Energy & Power Industry, By Region, 2017–2024 (USD Million)
Table 41 Market for Energy & Power Industry, By Asset Type, 2017–2024 (USD Million)
Table 42 Market for Energy & Power Industry, By Deployment Mode, 2017–2024 (USD Million)
Table 43 Market for Food & Beverages Industry, By Region, 2017–2024 (USD Million)
Table 44 Market for Food & Beverages Industry, By Asset Type, 2017–2024 (USD Million)
Table 45 Market for Food & Beverages Industry, By Deployment Mode, 2017–2024 (USD Million)
Table 46 Market for Metals & Mining Industry, By Region, 2017–2024 (USD Million)
Table 47 Market for Metals & Mining Industry, By Asset Type, 2017–2024 (USD Million)
Table 48 Market for Metals & Mining Industry, By Deployment Mode, 2017–2024 (USD Million)
Table 49 Market for Oil & Gas Industry, By Region, 2017–2024 (USD Million)
Table 50 Market for Oil & Gas Industry, By Asset Type, 2017–2024 (USD Million)
Table 51 Market for Oil & Gas Industry, By Deployment Mode, 2017–2024 (USD Million)
Table 52 Market for Pharmaceuticals and Biotechnology Industry, By Region, 2017–2024 (USD Million)
Table 53 Market for Pharmaceuticals and Biotechnology Industry, By Asset Type, 2017–2024 (USD Million)
Table 54 Market for Pharmaceuticals and Biotechnology Industry, By Deployment Mode, 2017–2024 (USD Million)
Table 55 Plant Asset Management Market for Pulp & Paper Industry, By Region, 2017–2024 (USD Million)
Table 56 Market for Pulp & Paper Industry, By Asset Type, 2017–2024 (USD Million)
Table 57 Market for Pulp & Paper Industry, By Deployment Mode, 2017–2024 (USD Million)
Table 58 Market for Water & Wastewater Industry, By Region, 2017–2024 (USD Million)
Table 59 Market for Water & Wastewater Industry, By Asset Type, 2017–2024 (USD Million)
Table 60 Market for Water & Wastewater Industry, By Deployment Mode, 2017–2024 (USD Million)
Table 61 Market, By Discrete Industry, 2017–2024 (USD Million)
Table 62 Market for Discrete Industries, By Region, 2017–2024 (USD Million)
Table 63 Market for Discrete Industries, By Asset Type, 2017–2024 (USD Million)
Table 64 Market in North America for Discrete Industries, By Asset Type, 2017–2024 (USD Million)
Table 65 Market in Europe for Discrete Industries, By Asset Type, 2017–2024 (USD Million)
Table 66 Market in APAC for Discrete Industries, By Asset Type, 2017–2024 (USD Million)
Table 67 Market in RoW for Discrete Industries, By Asset Type, 2017–2024 (USD Million)
Table 68 Market for Discrete Industries, By Deployment Mode, 2017–2024 (USD Million)
Table 69 Market for Aerospace & Defense Industry, By Region, 2017–2024 (USD Million)
Table 70 Market for Aerospace & Defense Industry, By Asset Type, 2017–2024 (USD Million)
Table 71 Market for Aerospace & Defense Industry, By Deployment Mode, 2017–2024 (USD Million)
Table 72 Plant Asset Management Market for Automotive Industry, By Region, 2017–2024 (USD Million)
Table 73 Market for Automotive Industry, By Asset Type, 2017–2024 (USD Million)
Table 74 Market for Automotive Industry, By Deployment Mode, 2017–2024 (USD Million)
Table 75 Market for Semiconductor & Electronics Industry, By Region, 2017–2024 (USD Million)
Table 76 Market for Semiconductor & Electronics Industry, By Asset Type, 2017–2024 (USD Million)
Table 77 Market for Semiconductor & Electronics Industry, By Deployment Mode, 2017–2024 (USD Million)
Table 78 Market for Medical Devices Industry, By Region, 2017–2024 (USD Million)
Table 79 Market for Medical Devices Industry, By Asset Type, 2017–2024 (USD Million)
Table 80 Market for Medical Devices Industry, By Deployment Mode, 2017–2024 (USD Million)
Table 81 Plant Asset Management Market, By Region, 2017–2024 (USD Million)
Table 82 Market in North America, By Country, 2017–2024 (USD Million)
Table 83 Market in North America, By Offering, 2017–2024 (USD Million)
Table 84 Market in North America, By Industry, 2017–2024 (USD Million)
Table 85 Market in North America, By Asset Type, 2017–2024 (USD Million)
Table 86 Market in North America, By Process Industry, 2017–2024 (USD Million)
Table 87 Market in North America, By Discrete Industry, 2017–2024 (USD Million)
Table 88 Market in Europe, By Country, 2017–2024 (USD Million)
Table 89 Market in Europe, By Offering, 2017–2024 (USD Million)
Table 90 Market in Europe, By Industry, 2017–2024 (USD Million)
Table 91 Market in Europe, By Asset Type, 2017–2024 (USD Million)
Table 92 Market in Europe, By Process Industry, 2017–2024 (USD Million)
Table 93 Market in Europe, By Discrete Industry, 2017–2024(USD Million)
Table 94 Market in APAC, By Country, 2017–2024 (USD Million)
Table 95 Market in APAC, By Offering, 2017–2024 (USD Million)
Table 96 Market in APAC, By Industry, 2017–2024 (USD Million)
Table 97 Market in APAC, By Asset Type, 2017–2024 (USD Million)
Table 98 Market in APAC, By Process Industry, 2017–2024 (USD Million)
Table 99 Market in APAC, By Discrete Industry, 2017–2024(USD Million)
Table 100 Plant Asset Management Market in RoW, By Region, 2017–2024 (USD Million)
Table 101 Market in RoW, By Offering, 2017–2024 (USD Million)
Table 102 Market in RoW, By Industry, 2017–2024 (USD Million)
Table 103 Market in RoW, By Asset Type, 2017–2024 (USD Million)
Table 104 Market in RoW, By Process Industry, 2017–2024 (USD Million)
Table 105 Market in RoW, By Discrete Industry, 2017–2024(USD Million)
Table 106 Ranking of Key Players in PAM Market, 2018
Table 107 Contracts, Agreements, Collaborations, and Partnerships, 2017–2019
Table 108 Product Launches and Developments, 2018–2019
Table 109 Acquisitions, 2017–2019
List of Figures (52 Figures)
Figure 1 Plant Asset Management Market: Markets Covered
Figure 2 Plant Asset Management Market: Research Design
Figure 3 Market Size Estimation Methodology: Approach 1 (Supply Side): Revenue Generated Through Software Solutions/Services in Market
Figure 4 Market Size Estimation Methodology: Approach 2 Bottom-Up (Supply Side): Illustration of Company Plant Asset Management Revenue Estimation
Figure 5 Plant Asset Management Market: Bottom-Up Approach
Figure 6 Plant Asset Management Market: Top-Down Approach
Figure 7 Data Triangulation
Figure 8 Services Segment Likely to Continue to Command Market During Forecast Period
Figure 9 On-Premises(Offline) Plant Asset Management Solutions to Account for Larger Market Size in 2019
Figure 10 Production Assets Will have Higher Demand for PAM Solutions During Forecast Period
Figure 11 Oil & Gas Held Major Share of Market for Process Industries in 2018
Figure 12 APAC to Register Highest CAGR in Market During 2019–2024
Figure 13 Surging Adoption of Lean Manufacturing Principles and Increasing Demand for Cloud-Based PAM Solutions to Boost Market Growth
Figure 14 Process Industries to Hold Major Share of Market in 2019
Figure 15 Production Assets to Capture Larger Share of Market in 2024
Figure 16 On-Premises (Offline) Deployment Mode to Account for Larger Size of Market in 2019
Figure 17 Services to Hold Larger Share of Market in 2019
Figure 18 Asia Pacific to Lead Market During Forecast Period
Figure 19 Value Chain Analysis: Maximum Value Added By PAM Software Developers and Suppliers
Figure 20 Plant Asset Management Market, By Offering
Figure 21 Service Offerings to Command Market From 2019 to 2024
Figure 22 PAM Market, By Deployment Mode
Figure 23 On-Premises PAM Solutions Expected to Hold Larger Market Size During Forecast Period
Figure 24 Plant Asset Management Market, By Asset Type
Figure 25 Automation Assets to Witness Higher CAGR in Market From 2019 to 2024
Figure 26 Major Types of Production Assets
Figure 27 Plant Asset Management Market, By Industry
Figure 28 Process Industries to Account for Larger Size of Market From 2019 to 2024
Figure 29 Food & Beverages Industry to Witness Highest CAGR in Market From 2019 to 2024
Figure 30 APAC to Command Market for Chemicals Industry From 2019 to 2024
Figure 31 North America to Hold Largest Size of Market for Food & Beverages Industry in 2024
Figure 32 APAC Expected to Retain Its Dominance in Market for Metals & Mining Industry in 2024
Figure 33 RoW Estimated to Be Largest Contributor to Market Growth for Oil & Gas Industry in 2024
Figure 34 Europe Expected to Be Second-Largest Contributor to Market Growth for Pharmaceuticals and Biotechnology Industry From 2019 to 2024
Figure 35 APAC to Lead Market for Automotive Industry During Forecast Period
Figure 36 Geographic Snapshot: Global PAM Market
Figure 37 Market in APAC to Grow at Highest CAGR From 2019 to 2024
Figure 38 North America: PAM Market Snapshot
Figure 39 Europe: PAM Market Snapshot
Figure 40 APAC: PAM Market Snapshot
Figure 41 Key Developments in PAM Market (2017 to 2019)
Figure 42 Plant Asset Management Market (Global) Competitive Leadership Mapping, 2018
Figure 43 ABB LTD.: Company Snapshot
Figure 44 Emerson Electric Co.: Company Snapshot
Figure 45 Honeywell International, Inc.: Company Snapshot
Figure 46 Rockwell Automation, Inc.: Company Snapshot
Figure 47 Siemens AG: Company Snapshot
Figure 48 Yokogawa Electric Corporation: Company Snapshot
Figure 49 General Electric Co.: Company Snapshot
Figure 50 Endress+Hauser AG: Company Snapshot
Figure 51 Schneider Electric SE: Company Snapshot
Figure 52 SKF Group: Company Snapshot
The study involved 4 major activities for estimating the size of the plant asset management (PAM) market. Exhaustive secondary research has been conducted to collect information on the market. The next step involved has been validating these findings, assumptions, and sizing with industry experts across the value chain through primary research. Both top-down and bottom-up approaches have been employed to estimate the overall market size. Thereafter, market breakdown and data triangulation techniques have been used to estimate the market size of segments and subsegments.
Secondary Research
In the secondary research process, various secondary sources have been referred to for identifying and collecting information important for this study. Secondary sources such as encyclopedias, directories, and databases, IEEE journals, Automation World Magazine, Manufacturing Automation Magazine, and leading players’ newsletters have been used to identify and collect information for an extensive technical and commercial study of the PAM market.
Primary Research
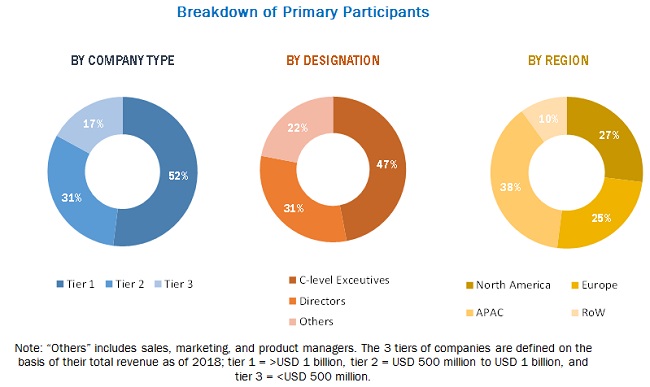
In the primary research process, primary sources from both supply and demand sides have been interviewed to obtain qualitative and quantitative information important for this report. Primary sources, such as experts from related industries and suppliers, have been interviewed to obtain and verify critical information, as well as assess prospects. Key players in the PAM market have been identified through secondary research, and their respective market rankings have been determined through primary and secondary research. This research included studying annual reports of top market players and interviewing key opinion leaders such as CEOs, directors, and marketing personnel.
To know about the assumptions considered for the study, download the pdf brochure
Market Size Estimation
In the complete market engineering process, both top-down and bottom-up approaches have been implemented, along with several data triangulation methods, to estimate and validate the size of the PAM market and other dependent submarkets listed in this report.
- Key players in the industry and markets have been identified through extensive secondary research.
- The industry’s supply chain and market size, in terms of value, have been determined through primary and secondary research.
All percentage shares, splits, and breakdowns have been determined using secondary sources and verified through primary sources.
Data Triangulation
After arriving at the overall market size, the total market has been split into several segments. To complete the overall market engineering process and arrive at exact statistics for all segments, market breakdown, and data triangulation procedures have been employed, wherever applicable. The data has been triangulated by studying various factors and trends from both the demand and supply sides. The market has also been validated using both top-down and bottom-up approaches.
Study Objectives:
- To describe and forecast the PAM market, in terms of value, by offering, asset type, deployment mode, and industry
- To describe and forecast the market, in terms of value, by region—North America, Europe, Asia Pacific (APAC), and Rest of the World (RoW)
- To provide detailed information regarding factors (drivers, restraints, opportunities, and challenges) influencing market growth
- To provide a detailed overview of the value chain of the PAM market
- To analyze opportunities for stakeholders in the PAM market by identifying its high-growth segments
- To strategically analyze micromarkets with respect to individual growth trends, prospects, and contributions to the overall market
- To strategically profile key players and comprehensively analyze their market shares and core competencies, along with detailing the competitive leadership and analyzing growth strategies such as product launches and developments, expansions, acquisitions, agreements, mergers, joint ventures, and partnerships of leading players.
Available Customizations:
With the given market data, MarketsandMarkets offers customizations according to a company’s specific needs. The following customization options are available for the report.
Company information:
- Detailed analysis and profiling of additional market players (up to 5)


Growth opportunities and latent adjacency in Plant Asset Management Market
I am looking for information on plant asset management in the manufacturing industry.