Polyetheramine Market by Type (Monoamine, Diamine, and Triamine), Application (Epoxy Coating, Polyurea, Adhesives & Sealants, Composites, and Fuel Additives), and Region - Global Forecasts to 2022


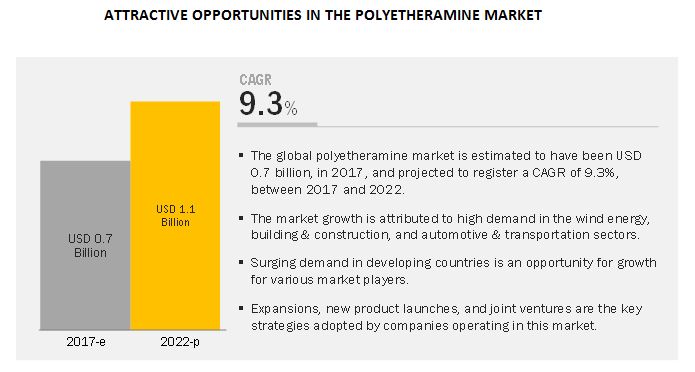
[141 Pages Report] The global polyetheramine market was valued at USD 0.6 billion in 2016 and is projected to reach USD 1.1 billion by 2022, at a CAGR of 9.3% from 2017 to 2022. The growing trend of eco-friendly & renewable energy generation and continuous improvements in the construction are the major drivers for the polyetheramine market. The increasing usage of polyetheramine in wind energy, building & construction, and automotive & transportation industries owing to its excellent fatigue resistance, burst resistance, flexibility, high wear & tear resistance, and other physical properties is projected to drive the global polyetheramine market.
The Diamine type segment is expected to have the largest demand for polyetheramine during the forecast period.
Diamine type segment accounted for the largest market share in terms of volume, followed by the monoamine and triamine type segments. Diamines are majorly consumed in epoxy coatings, polyuria, and adhesives & sealants applications. Increasing urbanization and use of renewable energy are driving this segment.
The polyetheramine market in the composites is expected to witness the highest CAGR during the forecast period.
Composites is projected to be the fastest-growing application segment of the polyetheramine market from 2017 to 2022. The use of polyetheramine as an additive to improve the property of the composites used in wind turbine blades, and in adhesives to adhere the two parts of a blade, is leading to a high growth in the demand for polyetheramine in wind energy industry.
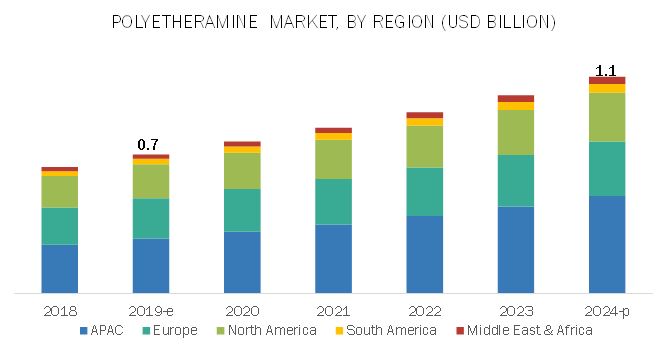
Asia-Pacific polyetheramine market is estimated to be the fastest growing during the forecast period.
The Asia-Pacific region is projected to witness the highest growth rate, in terms of both volume and value, during the forecast period, followed by Middle East & Africa. The market in this region is experiencing increased demand for polyetheramine from the wind energy and building & construction industries. In the Asia-Pacific region, India is estimated to be the fastest-growing polyetheramine market during the forecast period. The major growth is accounted by the wind energy industry owing to the demand for polyetheramine in composites and adhesives applications. The demand for coatings and adhesives & sealants in the construction industry is also driving the polyetheramine market.
Market Dynamics
Growth in wind energy industry is one of the major drivers for the increase in demand of polyetheramine. According to GWEC wind power leads all new renewable power generation in 2015. This is due to the growing demand for green and renewable energy globally. The total global wind energy installation reached 432.9 GW with newly installed wind power industry of 63 GW in 2015 accounting for annual market growth of 22%. China led the new wind energy installations with installed figure of 30 GW. The rapid growth in wind power generation is driving the manufacturing of large wind turbines. Wind turbines are manufactured using epoxy adhesives, while their blades are made of epoxy resin composites. Nearly one inch thick adhesives are used to bond the two halves of wind turbines and enhance static and dynamic fracture toughness. Polyetheramine is used as curing agents to enhance the property for epoxy adhesives as well as epoxy resin composites. The polyetheramine added improve the fatigue resistance & burst strength of the composites. These factors are increasing the demand for polyetheramine in the wind energy industry.
However, poor UV/VIS response is a major restraint for its growth. The polyetheramine-based systems do not exhibit good UV/VIS spectral stability. This instability is caused by the presence of amine group and lack of strong chromophores. The amine group in polyetheramine, when exposed to ambient atmosphere, gets oxidized. During oxidation, the amine is converted into nitro group and turns yellow. Therefore, they are not suitable for white coatings in automobiles. These concerns restrict the use of polyetheramine based coatings towards luxury or premium segments of vehicles.
Get online access to the report on the World's First Market Intelligence Cloud
- Easy to Download Historical Data & Forecast Numbers
- Company Analysis Dashboard for high growth potential opportunities
- Research Analyst Access for customization & queries
- Competitor Analysis with Interactive dashboard
- Latest News, Updates & Trend analysis
Request Sample Scope of the Report
Get online access to the report on the World's First Market Intelligence Cloud
- Easy to Download Historical Data & Forecast Numbers
- Company Analysis Dashboard for high growth potential opportunities
- Research Analyst Access for customization & queries
- Competitor Analysis with Interactive dashboard
- Latest News, Updates & Trend analysis

|
Report Metric |
Details |
|
Years considered for the study |
2015�2022 |
|
Base year |
2016 |
|
Forecast period |
2017�2022 |
|
Units considered |
Value (USD Million) and Volume (Kiloton) |
|
Segments |
Type and application |
|
Regions |
APAC, North America, Europe, the Middle East & Africa, and South America |
|
Companies |
Huntsman Corporation, BASF SE, Wuxi Acryl technology Co. Ltd, and Clariant |
This research report categorizes the polyetheramine market on the basis of type, application, and region.
Polyetheramine Market, by Type:
- Monoamine
- Diamine
- Triamine
Polyetheramine Market, by Application:
- Epoxy Coatings
- Polyurea
- Adhesives & Sealants
- Composites
- Fuel Additives
Polyetheramine Market, by Region:
- North America
- Europe
- Asia-Pacific
- Middle East & Africa
- South America
The market is further analyzed for key countries in each of these regions.
Leading Players
Huntsman Corporation is a major player in the polyetheramine market. The company�s wide range of business segments provides an added advantage to the company�s profit margin, which enables it to compensate losses from low performing business segments and enables investments in strategic expansions and R&D activities. The performance products business segment includes polyetheramine products. The company earned around 24% of its revenue from performance products business segment in 2015 and is planning to invest further in this segment to enhance its sales globally. The company follows growth strategies such as capacity expansions and investing in R&D activities to meet the growing demand, improve product cost competitiveness, and enhance its product portfolio for new applications to cater to the market. In May 2015, Huntsman Corporation expanded its production capacity of Conroe chemical plant, which has polyetheramine manufacturing facility.
BASF SE is another major player in the polyetheramine market. Europe accounted for 44% of the overall company revenue in 2015. The chemical business segment of the company manufactures polyetheramine for various applications and end users. This business segment earned around 22% of its revenue in 2015. The company�s business strategy mainly revolves around its targets to increase global reach, enhance revenue, and launch innovative solutions through its products. As a part of its growth strategy, the company plans to establish new production facilities and expand its existing plant capacities which could enable the company to take advantage of the opportunities in the high growth polyetheramine market. In April 2016, BASF SE inaugurated a new plant to produce specialty amines in the Nanjing Chemical Industry Park in Nanjing, China, as part of a move to open first specialty amines plant in Asia-Pacific. This expansion is expected to meet the growing market demands of polyetheramine in personal care, construction, wind energy, and coatings sectors.
Recent Developments
- In 2016, BASF SE inaugurated a new plant for the production of specialty amines in the Nanjing Chemical Industry Park in Nanjing, China. This plant is the first specialty amines plant in Asia-Pacific. With this expansion, the company met the increasing demand of PEA in personal care, construction, wind energy, and coatings sectors.
- In 2015, Huntsman announced the expansion of its Conroe chemical plant by investing between USD 25 million and USD 30 million. This development will ramp up production and capacity and create new jobs in Conroe and The Woodlands.
- In 2016, BASF SE entered into a partnership with Lumar Group (Spain) to market specialty amines for the cooling lubricants and metalworking fluids industry in Europe. This partnership added extra marketing intelligence to the BASF marketing team.
Key Questions Addressed by the Report
- What is the mid-to-long term impact of the developments undertaken in the industry?
- What are the upcoming technologies used in polyetheramine industry?
- Which segment has the potential to register the highest market share?
- What is the current competitive landscape in the polyetheramine market in terms of new technologies, developments, and capabilities?
- What will be the growth prospects of the polyetheramine market?
Available customizations
With the given market data, MarketsandMarkets offers customizations according to the company�s specific needs. The following customization options are available for the report:
Product Analysis
- Product matrix that gives a detailed comparison of product portfolio of each company
Country-wise Analysis
- Further breakdown of Rest of APAC countries into Thailand, Vietnam, Singapore, the Philippines, Myanmar, Australia, and New Zealand.
- Further breakdown of Rest of Europe into the Netherlands, Switzerland, Greece, Hungary, Romania, Croatia, Bulgaria, Denmark, Finland, Austria, Norway, and Ukraine.
- Further breakdown of Rest of the Middle East & Africa into the Algeria, Egypt, Iraq, Nigeria, Kenya, and Morocco
- Further breakdown of Rest of South America into Chile, Uruguay, Ecuador, and Paraguay.
To speak to our analyst for a discussion on the above findings, click Speak to Analyst
Table of Contents
1 Introduction
1.1 Objectives of the Study
1.2 Market Definition
1.3 Scope of the Study
1.3.1 Years Considered for the Study
1.4 Currency
1.5 Package Size
1.6 Limitations
1.7 Stakeholders
2 Research Methodology
2.1.1 Secondary Data
2.1.1.1 Key Data From Secondary Sources
2.1.2 Primary Data
2.1.2.1 Key Data From Primary Sources
2.1.2.2 Key Industry Insights
2.2 Market Size Estimation
2.2.1 Bottom-Up Approach
2.2.2 Top-Down Approach
2.3 Data Triangulation
2.4 Assumptions and Limitations
2.4.1 Assumptions
2.5 Limitations
3 Executive Summary
4 Premium Insights
4.1 Attractive Opportunities for Market Players
4.2 Polyetheramine Market, By Application
4.3 Polyetheramine Market: Developed Vs. Developing Countries Between 2017 and 2022
4.4 Asia-Pacific Polyetheramine Market: Major Applications Vs. Major Countries
4.5 U.S. Dominated the Polyetheramine Market
5 Market Overview
5.1 Introduction
5.2 Market Segmentation
5.2.1 By Type
5.2.2 By Application
5.2.3 By Region
5.3 Market Dynamics
5.3.1 Drivers
5.3.1.1 Growth in Wind Energy Industry
5.3.1.2 Growing Building & Construction Industry
5.3.1.3 Versatility and Unique Physical Properties
5.3.2 Restraints
5.3.2.1 Poor Uv/Vis Response
5.3.3 Opportunities
5.3.3.1 Growing Importance of Polyetheramine-Cured Rubber-Like Epoxy Asphalt Composites
5.3.3.2 Polyetheramine Enhances the Properties of Coating Solutions
5.3.4 Challenges
5.3.4.1 Challenges Posed By Acid Epoxy Coatings
5.3.4.2 Development of Bio-Based Products
6 Industry Trends
6.1 Introduction
6.2 Value Chain Analysis
6.3 Porter�s Five Forces Analysis
6.3.1 Intensity of Competitive Rivalry
6.3.2 Bargaining Power of Buyers
6.3.3 Bargaining Power of Suppliers
6.3.4 Threat of Substitutes
6.3.5 Threat of New Entrants
7 Macroeconomic Indicators
7.1 Introduction
7.2 Trends and Forecast of GDP
7.3 Trends and Forecast of Construction Industry
7.3.1 Trends and Forecast of Construction Industry in North America
7.3.2 Trends and Forecast of Construction Industry in Europe
7.3.3 Trends and Forecast of Construction Industry in Asia-Pacific
7.3.4 Trends and Forecast of Construction Industry in Middle East & Africa
7.3.5 Trends and Forecast of Construction Industry in South America
7.4 Trends and Forecast of Wind Energy Industry
7.4.1 Trends of Wind Energy Industry
7.4.2 Forecast of Wind Energy Industry
8 Polyetheramine Market, By Type
8.1 Introduction
8.2 Monoamine
8.3 Diamine
8.4 Triamine
8.5 Others
9 Polyetheramine Market, By Application
9.1 Introduction
9.2 Epoxy Coatings
9.2.1 Market Size and Forecast Till 2022
9.3 Polyurea
9.3.1 Market Size and Forecast Till 2022
9.4 Adhesives & Sealants
9.4.1 Market Size and Forecast Till 2022
9.5 Composites
9.5.1 Market Size and Forecast Till 2022
9.6 Fuel Additives
9.6.1 Market Size and Forecast Till 2022
9.7 Others
9.7.1 Market Size and Forecast Till 2022
10 Polyetheramine Market, By Region
10.1 Introduction
10.2 Asia-Pacific
10.2.1 Polyetheramine Market, By Type
10.2.1.1 Market Size and Forecast Till 2022
10.2.2 Polyetheramine Market, By Application
10.2.2.1 Market Size and Forecast Till 2022
10.2.3 China Polyetheramine Market
10.2.3.1 Market Size and Forecast Till 2022
10.2.4 Japan Polyetheramine Market
10.2.4.1 Market Size and Forecast Till 2022
10.2.5 India Polyetheramine Market
10.2.5.1 Market Size and Forecast Till 2022
10.2.6 South Korea Polyetheramine Market
10.2.6.1 Market Size and Forecast Till 2022
10.2.7 Taiwan Polyetheramine Market
10.2.7.1 Market Size and Forecast Till 2022
10.2.8 Singapore Polyetheramine Market
10.2.8.1 Market Size and Forecast Till 2022
10.2.9 Thailand Polyetheramine Market
10.2.9.1 Market Size and Forecast Till 2022
10.2.10 Vietnam Polyetheramine Market
10.2.10.1 Market Size and Forecast Till 2022
10.2.11 Rest of Asia-Pacific Polyetheramine Market
10.2.11.1 Market Size and Forecast Till 2022
10.3 North America
10.3.1 Polyetheramine Market, By Type
10.3.1.1 Market Size and Forecast Till 2022
10.3.2 Polyetheramine Market, By Application
10.3.2.1 Market Size and Forecast Till 2022
10.3.3 US Polyetheramine Market
10.3.3.1 Market Size and Forecast Till 2022
10.3.4 Canada Polyetheramine Market
10.3.4.1 Market Size and Forecast Till 2022
10.3.5 Mexico Polyetheramine Market
10.3.5.1 Market Size and Forecast Till 2022
10.4 Europe
10.4.1 Polyetheramine Market, By Type
10.4.1.1 Market Size and Forecast Till 2022
10.4.2 Polyetheramine Market, By Application
10.4.2.1 Market Size and Forecast Till 2022
10.4.3 Germany Polyetheramine Market
10.4.3.1 Market Size and Forecast Till 2022
10.4.4 France Polyetheramine Market
10.4.4.1 Market Size and Forecast Till 2022
10.4.5 U.K. Polyetheramine Market
10.4.5.1 Market Size and Forecast Till 2022
10.4.6 Italy Polyetheramine Market
10.4.6.1 Market Size and Forecast Till 2022
10.4.7 Russia Polyetheramine Market
10.4.7.1 Market Size and Forecast Till 2022
10.4.8 Turkey Polyetheramine Market
10.4.8.1 Market Size and Forecast Till 2022
10.4.9 Rest of Europe Polyetheramine Market
10.4.9.1 Market Size and Forecast Till 2022
10.5 Middle East & Africa
10.5.1 Polyetheramine Market Size, By Type
10.5.1.1 Market Size and Forecast Till 2022
10.5.2 Polyetheramine Market Size, By Application
10.5.2.1 Market Size and Forecast Till 2022
10.5.3 UAE Polyetheramine Market
10.5.3.1 Market Size and Forecast Till 2022
10.5.4 Africa Polyetheramine Market
10.5.4.1 Market Size and Forecast Till 2022
10.5.5 Rest of Middle East Polyetheramine Market
10.5.5.1 Market Size and Forecast Till 2022
10.6 South America
10.6.1 Polyetheramine Market Size, By Type
10.6.1.1 Market Size and Forecast Till 2022
10.6.2 Polyetheramine Market Size, By Application
10.6.2.1 Market Size and Forecast Till 2022
10.6.3 Brazil Polyetheramine Market
10.6.3.1 Market Size and Forecast Till 2022
10.6.4 Argentina Polyetheramine Market
10.6.4.1 Market Size and Forecast Till 2022
10.6.5 Rest of South America Polyetheramine Market
10.6.5.1 Market Size and Forecast Till 2022
Brazil
11 Competitive Landscape
11.1 Overview
11.2 Investment & Expansion
11.3 Joint Venture & Partnership
11.4 New Product Launch
11.4.1 Product Mapping
11.5 Market Share Analysis
12 Company Profiles
(Overview, Financial*, Products & Services, Strategy, and Developments)
12.1 Huntsman Corporation
12.2 BASF SE
12.3 Clariant
12.4 Yangzhou Chenhua New Materials Co., Ltd.
12.5 Wuxi Acryl Technology Co., Ltd.
12.6 Yantai Minsheng Chemicals Co., Ltd.
12.7 Iro Surfactant Co., Ltd.
12.8 Yantai Dasteck Chemicals Co., Ltd.
12.9 Zibo Dexin Lianbang Chemical Industry Co., Ltd.
12.10 The Aurora Chemical Co. Ltd.
*Details Might Not be Captured in Case of Unlisted Companies.
13 Appendix
13.1 Key Insights From Industry Experts
13.2 Discussion Guide
13.3 Knowledge Store: Marketsandmarkets� Subscription Portal
13.4 Introducing Rt: Real-Time Market Intelligence
13.5 Available Customizations
13.6 Related Reports
13.7 Author Details
List of Tables (108 Tables)
Table 1 Polyetheramine Market Snapshot (2017 Vs. 2022)
Table 2 Polyetheramine Market, By Type
Table 3 Polyetheramine Market, By Application
Table 4 Trends and Forecast of GDP, 2015�2021 (USD Billion)
Table 5 Contribution of Construction Industry to GDP in North America, 2014�2021 (USD Billion)
Table 6 Contribution of Construction Industry to GDP in Europe, 2014�2021 (USD Billion)
Table 7 Contribution of Construction Industry to GDP in Asia-Pacific, 2014�2021 (USD Billion)
Table 8 Contribution of Construction Industry to GDP in Middle East & Africa, 2014�2021 (USD Billion)
Table 9 Contribution of Construction Industry to GDP in South America, 2014�2021 (USD Billion)
Table 10 Wind Energy Installations, 2011�2015 (MW)
Table 11 Wind Energy Installations, 2016�2020 (GW)
Table 12 Polyetheramine Market Size, By Type, 2015�2022 (USD Million)
Table 13 Polyetheramine Market Size, By Type, 2015�2022 (Kiloton)
Table 14 Monoamine Market Size, By Region, 2015�2022 (USD Million)
Table 15 Monoamine Market Size, By Region, 2015�2022 (Kiloton)
Table 16 Diamine Market Size, By Region, 2015�2022 (USD Million)
Table 17 Diamine Market Size, By Region, 2015�2022 (Kiloton)
Table 18 Triamine Market Size, By Region, 2015�2022 (USD Million)
Table 19 Triamine Market Size, By Region, 2015�2022 (Kiloton)
Table 20 Others Market Size, By Region, 2015�2022 (USD Million)
Table 21 Others Market Size, By Region, 2015�2022 (Kiloton)
Table 22 Polyetheramine Market Size, By Application, 2015�2022 (USD Million)
Table 23 Polyetheramine Market Size, By Application, 2015�2022 (Kiloton)
Table 24 Polyetheramine Market Size in Epoxy Coatings, By Region, 2015�2022 (USD Million)
Table 25 Polyetheramine Market Size in Epoxy Coatings, By Region, 2015�2022 (Kiloton)
Table 26 Polyetheramine Market Size in Polyurea, By Region, 2015�2022 (USD Million)
Table 27 Polyetheramine Market Size in Polyurea, By Region, 2015�2022 (Kiloton)
Table 28 Polyetheramine Market Size in Adhesives & Sealants, By Region, 2015�2022 (USD Million)
Table 29 Polyetheramine Market Size in Adhesives & Sealants, By Region, 2015�2022 (Kiloton)
Table 30 Polyetheramine Market Size in Composites, By Region, 2015�2022 (USD Million)
Table 31 Polyetheramine Market Size in Composites, By Region, 2015�2022 (Kiloton)
Table 32 Polyetheramine Market Size in Fuel Additives, By Region, 2015�2022 (USD Million)
Table 33 Polyetheramine Market Size in Fuel Additives, By Region, 2015�2022 (Kiloton)
Table 34 Polyetheramine Market Size in Other Applications, By Region, 2015�2022 (USD Million)
Table 35 Polyetheramine Market Size in Other Applications, By Region, 2015�2022 (Kiloton)
Table 36 Polyetheramine Market Size, By Region, 2015�2022 (USD Million)
Table 37 Polyetheramine Market Size, By Region, 2015�2022 (Kiloton)
Table 38 Asia-Pacific: Polyetheramine Market Size, By Country, 2015�2022 (USD Million)
Table 39 Asia-Pacific: Polyetheramine Market Size, By Country, 2015�2022 (Kiloton)
Table 40 Asia-Pacific: Polyetheramine Market Size, By Type, 2015�2022 (USD Million)
Table 41 Asia-Pacific: Polyetheramine Market Size, By Type, 2015�2022 (Kiloton)
Table 42 Asia-Pacific: Polyetheramine Market Size, By Application, 2015�2022 (USD Million)
Table 43 Asia-Pacific: Polyetheramine Market Size, By Application, 2015�2022 (Kiloton)
Table 44 China: Polyetheramine Market Size, By Application, 2015�2022 (USD Million)
Table 45 China: Polyetheramine Market Size, By Application, 2015�2022 (Kiloton)
Table 46 Japan: Polyetheramine Market Size, By Application, 2015�2022 (USD Million)
Table 47 Japan: Polyetheramine Market Size, By Application, 2015�2022 (Kiloton)
Table 48 India: Polyetheramine Market Size, By Application, 2015�2022 (USD Million)
Table 49 India: Polyetheramine Market Size, By Application, 2015�2022 (Kiloton)
Table 50 South Korea: Polyetheramine Market Size, By Application, 2015�2022 (USD Million)
Table 51 South Korea: Polyetheramine Market Size, By Application, 2015�2022 (Kiloton)
Table 52 Taiwan: Polyetheramine Market Size, 2015�2022
Table 53 Singapore: Polyetheramine Market Size, 2015�2022
Table 54 Thailand: Polyetheramine Market Size, 2015�2022
Table 55 Vietnam: Polyetheramine Market Size, 2015�2022
Table 56 Rest of Asia-Pacific: Polyetheramine Market Size, 2015�2022
Table 57 North America: Polyetheramine Market Size, By Country, 2015�2022 (USD Million)
Table 58 North America: Polyetheramine Market Size, By Country, 2015�2022 (Kiloton)
Table 59 North America: Polyetheramine Market Size, By Type, 2015�2022 (USD Million)
Table 60 North America: Polyetheramine Market Size, By Type, 2015�2022 (Kiloton)
Table 61 North America: Polyetheramine Market Size, By Application, 2015�2022 (USD Million)
Table 62 North America: Polyetheramine Market Size, By Application, 2015�2022 (Kiloton)
Table 63 U.S.: Polyetheramine Market Size, By Application, 2015�2022 (USD Million)
Table 64 U.S.: Polyetheramine Market Size, By Application,2015�2022 (Kiloton)
Table 65 Mexico: Polyetheramine Market Size, By Application, 2015�2022 (USD Million)
Table 66 Mexico: Polyetheramine Market Size, By Application, 2015�2022 (Kiloton)
Table 67 Canada: Polyetheramine Market Size, By Application, 2015�2022 (USD Million)
Table 68 Canada: Polyetheramine Market Size, By Application, 2015�2022 (Kiloton)
Table 69 Europe: Polyetheramine Market Size, By Country, 2015�2022 (USD Million)
Table 70 Europe: Polyetheramine Market Size, By Country, 2015�2022 (Kiloton)
Table 71 Europe: Polyetheramine Market Size, By Type, 2015�2022 (USD Million)
Table 72 Europe: Polyetheramine Market Size, By Type, 2015�2022 (Kiloton)
Table 73 Europe: Polyetheramine Market Size, By Application, 2015�2022 (USD Million)
Table 74 Europe: Polyetheramine Market Size, By Application, 2015�2022 (Kiloton)
Table 75 Germany: Polyetheramine Market Size, By Application, 2015�2022 (USD Million)
Table 76 Germany: Polyetheramine Market Size, By Application, 2015�2022 (Kiloton)
Table 77 France: Polyetheramine Market Size, By Application, 2015�2022 (USD Million)
Table 78 France: Polyetheramine Market Size, By Application, 2015�2022 (Kiloton)
Table 79 U.K.: Polyetheramine Market Size, By Application, 2015�2022 (USD Million)
Table 80 U.K.: Polyetheramine Market Size, By Application,2015�2022 (Kiloton)
Table 81 Italy: Polyetheramine Market Size, By Application, 2015�2022 (USD Million)
Table 82 Italy: Polyetheramine Market Size, By Application,2015�2022 (Kiloton)
Table 83 Russia: Polyetheramine Market Size, By Application, 2015�2022 (USD Million)
Table 84 Russia: Polyetheramine Market Size, By Application, 2015�2022 (Kiloton)
Table 85 Turkey: Polyetheramine Market Size, 2015-2022
Table 86 Rest of Europe: Polyetheramine Market Size, 2015�2022
Table 87 Middle East & Africa: Polyetheramine Market Size, By Country, 2015�2022 (USD Million)
Table 88 Middle East & Africa: Polyetheramine Market Size, By Country, 2015�2022 (Kiloton)
Table 89 Middle East & Africa: Polyetheramine Market Size, By Type, 2015�2022 (USD Million)
Table 90 Middle East & Africa: Polyetheramine Market Size, By Type, 2015�2022 (Kiloton)
Table 91 Middle East & Africa: Polyetheramine Market Size, By Application, 2015�2022 (USD Million)
Table 92 Middle East & Africa: Polyetheramine Market Size, By Application, 2015�2022 (Kiloton)
Table 93 UAE: Polyetheramine Market Size, 2015�2022
Table 94 Africa: Polyetheramine Market Size, 2015�2022
Table 95 Rest of Middle East : Polyetheramine Market Size, 2015�2022
Table 96 South America: Polyetheramine Market Size, By Country, 2015�2022 (USD Million)
Table 97 South America: Polyetheramine Market Size, By Country, 2015�2022 (Kiloton)
Table 98 South America: Polyetheramine Market Size, By Type, 2015�2022 (USD Million)
Table 99 South America: Polyetheramine Market Size, By Type, 2015�2022 (Kiloton)
Table 100 South America: Polyetheramine Market Size, By Application, 2015�2022 (USD Million)
Table 101 South America: Polyetheramine Market Size, By Application, 2015�2022 (Kiloton)
Table 102 Brazil: Polyetheramine Market Size, By Application, 2015�2022 (USD Million)
Table 103 Brazil: Polyetheramine Market Size, By Application,2015�2022 (Kiloton)
Table 104 Argentina: Polyetheramine Market Size, 2015�2022
Table 105 Rest of South America: Polyetheramine Market Size, 2015�2022
Table 106 Investment & Expansion, 2012�2016
Table 107 Joint Venture & Partnership, 2012�2016
Table 108 New Product Launch, 2012�2016
List of Figures (42 Figures)
Figure 1 Polyetheramine Market Segmentation
Figure 2 Polyetheramine Market: Research Design
Figure 3 Breakdown of Primary Interviews:
Figure 4 Market Size Estimation: Bottom-Up Approach
Figure 5 Market Size Estimation: Top-Down Approach
Figure 6 Polyetheramine Market: Data Triangulation
Figure 7 Asia-Pacific to Dominate Polyetheramine Market Between 2017 and 2022
Figure 8 Diamine Type Segment to Account for Maximum Share in Polyetheramine Market Between 2017 and 2022
Figure 9 Epoxy Coatings Application Segment to Account for Maximum Share in Polyetheramine Market Between 2017 and 2022
Figure 10 Asia-Pacific to be Fastest-Growing Polyetheramine Market Between 2017 and 2022
Figure 11 Emerging Economies to Offer Lucrative Growth Potential to Market Players Between 2017 and 2022
Figure 12 Composites to Register Highest CAGR in Polyetheramine Market Between 2017 and 2022
Figure 13 Developing Countries to Grow Faster Than Developed Countries
Figure 14 Epoxy Coatings Accounted for Largest Share of Polyetheramine Market in Asia-Pacific in 2016
Figure 15 India to Witness Highest Growth Rate During Forecast Period 2017 and 2022
Figure 16 U.S. Accounted for Largest Share in Polyetheramine Market, in 2016
Figure 17 Polyetheramine Market, By Region
Figure 18 Drivers, Restraints, Opportunities, and Challenges
Figure 19 Construction Industry: Emerging Country Vs. Developed Country
Figure 20 Impact Analysis: Drivers
Figure 21 Impact Analysis: Restraints
Figure 22 Impact Analysis: Opportunities
Figure 23 Impact Analysis: Challenges
Figure 24 Polyetheramine Market: Value Chain Analysis
Figure 25 Polyetheramine Market: Porter�s Five Forces Analysis
Figure 26 Wind Energy Installed Capacity, 2014�2015 (Mw)
Figure 27 Asia-Pacific to Lead the Polyetheramine Market in 2017
Figure 28 High Growth in Applications to Drive the Polyetheramine Market
Figure 29 Composites to be the Fastest-Growing Segment Between 2017 and 2022
Figure 30 Regional Snapshot: India and China Emerging as Strategic Markets
Figure 31 Asia-Pacific to Register Highest Growth in Polyetheramine Market Between 2017�2022
Figure 32 Asia-Pacific Market Snapshot
Figure 33 North America Market Snapshot
Figure 34 Companies Adopted Investment & Expansion as the Key Growth Strategy Between 2012 and 2016
Figure 35 Market Evaluation Framework: Significant Number of Investment & Expansion Between 2012 and 2016
Figure 36 Investment & Expansion Was the Preferred Strategy Between 2012 and 2016
Figure 37 Huntsman Dominates the Polyetheramine Market
Figure 38 Huntsman Corporation: Company Snapshot
Figure 39 Huntsman Corporation: SWOT Analysis
Figure 40 BASF SE: Company Snapshot
Figure 41 BASF SE: SWOT Analysis:
Figure 42 Clariant: Company Snapshot


Growth opportunities and latent adjacency in Polyetheramine Market