Pressure Pumping Market by Types (Hydraulic Fracturing, Cementing, Others), North America Resource Type (Conventional, Unconventional), North America Well Type (Horizontal, Vertical) & Geography - Global Trends & Forecasts to 2018


The growing demand of energy with increasing investments in offshore and unconventional exploration and production activities is expected to drive the global pressure pumping market. It is estimated to reach $116.12 billion by 2018, at a CAGR of 16.1% from 2013 to 2018. The latest exploration and highly advanced technology required in the African and Asia-Pacific regions are expected to experience the highest revenue growth during the next five years.
Pressure pumping is a propagation of fractures through layers of rock using pressurized fracturing fluid and pumping the cement into the well bore to complete it. This technique is primarily used to extract resources from low permeability reservoirs such as shale gas, tight gas, and unconventional liquids, which are difficult to recover through regular drilling procedures. Pressure pump services are provided by oilfield service companies (such as Halliburton) to oil and gas companies (such as Shell).
Hydraulic fracturing is the frequently used pressure pump service, globally. Additionally, cementing services, sand control services, acidization, etc., are also a part of the industry. Currently, pressure pumping is facing a lot of public opposition on environmental hazards caused by fracturing. Water usage, water contamination, and seismic activities are the most important concerns of pressure pumping. Due to these environmental concerns, the growth of the global market is diminished with a ban in many countries on hydraulic fracturing.
The pressure pumping market is mainly concentrated in North America, where many leading oil field service companies�Schlumberger, Halliburton, Baker Hughes and other medium and small players�operate. While the North American pressure pumping market is reaching its maturity, is the market is still in its infancy across other geographic regions.
Pressure Pumping Market Revenue, 2013-2018 ($Million)
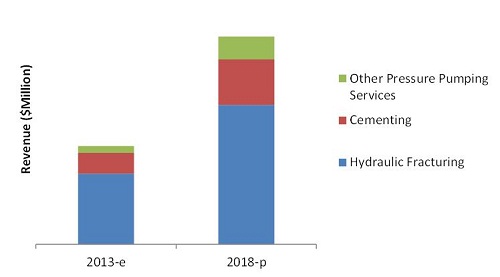
Source: MarketsandMarkets Analysis
For this report, the major players in the pressure pumping market are identified through secondary and primary research based on which their market shares are evaluated. This includes a study of the annual reports of top market players and interviews with key opinion leaders such as CEOs, Directors, and marketing people.
The size of the overall market is determined by forecasting techniques based on the pressure pumping demand in different regions, which is validated through primary sources. The market revenue and hydraulic horse power supplied for various types of pressure pumping services are determined and evaluated using primary and secondary research. The market data is available from 2011 to 2018 with a CAGR from 2013 to 2018.
This report analyzes various marketing trends and establishes the most effective growth strategy. It identifies market dynamics such as drivers, opportunities, burning issues, and winning imperatives. Major companies such as Schlumberger, Halliburton, Baker Hughes, and Weatherford have also been profiled in this report.
Get online access to the report on the World's First Market Intelligence Cloud
Request Sample Scope of the Report
:

On the basis of service types:
- Hydraulic fracturing
- Cementing
- Other pressure pump services
On the basis of well types (North America):
- Horizontal
- Vertical
On the basis of resource types (North America):
- Conventional
- Unconventional
On the basis of geography:
- North America
- Europe
- South & Central America
- Asia-Pacific
- Africa
- The Middle East
The global pressure pumping market will grow to $116.15 billion market by 2018, at a firm annualized growth rate of 16.1% from 2013 to 2018.
Pressure pumping is required during various phases of the lifecycle of a well for its completion, stimulation, intervention, etc. Hydraulic fracturing is a technique used to generate oil and gas from wells with low permeability. Cementing is done to complete the well. This is a service provided by oilfield service companies to the oil and natural gas companies. In this report, the market is analyzed on the basis of hydraulic horse power supplied by oilfield service companies to the hydraulic fracturing market. The Asia-Pacific and Middle East markets are still in the state of infancy, creating strong growth prospects for the global pressure pumping market. While the North American market is near its maturity, the movement in the market will be subjected to competition.
Potential increase in recoverable resources and production is the most important driver for the global market. This technique is used to recover both oil and natural gas, but is predominantly used to recover unconventional gas. Currently, natural gas is referred to as transitional fuel for being the link between conventional resources and renewable energy. This proves to be an advantage to the international natural gas market and hence to the pressure pumping market.
If countries across the world permit the use of this technique, then the recovery of resources is expected to increase. Hence, pressure pumping will prove beneficial for developing countries such as India, China, and Brazil. As the energy demand in these countries is increasing, fulfilling this demand will enhance their growth prospects. This is the driver for the global pressure pumping market.
However, it is said that for the Asia-Pacific and Middle East market, growth lies in the region, and is subjected to many reasons such as environmental objections and subsequent ban on pressure pumping in few countries, which is an important hurdle to cross for the growth of this market. Research and development in the field of water usage, water treatment, and seismic disturbances is expected to accelerate the growth of this market in these regions.
Pressure Pumping Market Revenue, by Geography, 2011-2018
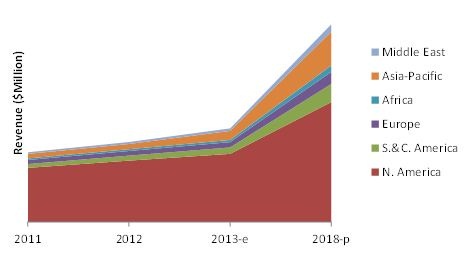
Source: MarketsandMarkets Analysis
Currently, North America dominates the pressure pumping market. This dominance is seen mainly due to continuous and large activities in the U.S. unconventional gas plays. The unconventional gas recovery and its growth are important reasons for the growth of the market. North America has the highest market share because of the favorable regulations within the region.
Table Of Contents
1 Introduction (Page No. - 18)
1.1 Key Take Aways
1.2 Analyst Insights
1.3 Cost Analysis
1.4 Market Investment Analysis
1.5 Report Description
1.6 Market Segmentation & Market Aspects Covered
1.7 Stakeholders
1.8 Research Methodology
1.8.1 Approach
1.8.2 Market Size Estimation
1.8.3 Market Crackdown & Data Triangulation
1.8.4 Key Data Points Taken from Secondary Sources
1.8.5 Key Secondary Sources Used
1.8.6 Key Data Points Taken from Primary Sources
1.8.7 Assumptions Made for This Report
2 Executive Summary (Page No. - 31)
3 Industry Analysis (Page No. - 34)
3.1 Introduction
3.2 Market Statistics
3.2.1 Global Pressure Pumping Market
3.2.2 Submarkets
3.2.2.1 Growth Trend for Different Types of Pressure Pumping Services
3.2.2.2 Growth Trends for Different Regions
3.3 Water Cycle for Hydraulic Fracturing
4 Market Overview (Page No. - 41)
4.1 Introduction to Pressure Pumping
4.2 Technology Overview
4.2.1 Types of Hydraulic Fracturing
4.2.1.1 Perf-and-Plug
4.2.1.2 Sliding Sleeve
4.2.1.3 Comparison of Perf-and-Plug & Sliding Sleeve Systems
4.3 Market Dynamics
4.3.1 Drivers
4.3.1.1 Enhanced Productivity & Recovery Rates of Reservoirs
4.3.1.2 Energy Strategy Shift Through Gas-A �Transitional Fuel�
4.3.1.3 Energy Security offered By the Domestic Supply of Natural Gas
4.3.2 Restraints
4.3.2.1 Water Availability & Contamination Concerns for Hydraulic Fracturing
4.3.2.2 Public Opposition to Pressure Pumping
4.3.2.2.1 Concerns About Seismic Activities
4.3.2.3 Adverse Effects of Strict Government Regulations on the Pressure Pump Industry
4.3.3 Opportunities
4.3.3.1 �Waterless� Fracturing�Foams
4.4 Impact of Market Dynamics
4.5 Burning Issues
4.5.1 North American Natural Gas Supply Glut & Depressed Prices
4.5.2 Fluctuating Prices & Variable Supply of Guar Gum
4.6 Winning Imperatives
4.7 Value Chain Analysis
4.7.1 Suppliers
4.7.1.1 Proppants
4.7.1.2 Additives
4.7.1.3 Equipment
4.7.2 Service Providers
4.7.3 Exploration & Production Companies (End-Users)
4.8 Porter�s Five forces Analysis
4.8.1 Threat of New Entrants
4.8.2 Threat of Substitutes
4.8.3 Bargaining Power of Buyers
4.8.4 Bargaining Power of Suppliers
4.8.5 Competitive Rivalry Within An Industry
5 Oil & Gas Reserves & Production (Page No. - 68)
5.1 Introduction
5.2 Global Oil & Gas Reserves
5.2.1 Global Oil Reserves
5.2.1.1 North America
5.2.1.2 South America
5.2.1.3 Europe
5.2.1.4 the Middle East
5.2.1.5 Africa
5.2.1.6 APAC
5.2.2 Global Gas Reserves
5.2.2.1 North America
5.2.2.2 South America
5.2.2.3 Europe
5.2.2.4 the Middle East
5.2.2.5 Africa
5.2.2.6 APAC
5.3 Global Oil & Gas Production
5.3.1 Global Oil Production
5.3.1.1 North America
5.3.1.2 South America
5.3.1.3 Europe
5.3.1.4 the Middle East
5.3.1.5 Africa
5.3.1.6 APAC
5.3.2 Global Gas Production
5.3.2.1 North America
5.3.2.2 South America
5.3.2.3 Europe
5.3.2.4 the Middle East
5.3.2.5 Africa
5.3.2.6 APAC
6 Pressure Pumping Market, By Type (Page No. - 106)
6.1 Introduction
6.2 Market Analysis
6.2.1 Revenue & Forecast
6.2.2 Hydraulic Fracturing
6.2.2.1 Definition & Description
6.2.2.2 Single Largest Used Pressure Pumping Service
6.2.3 Cementing Services
6.2.3.1 Definition & Description
6.2.3.1.1 Primary Cementing
6.2.3.1.2 Remedial Cementing
6.2.3.2 Consistent Market Increment Due to Its Necessary Requirements
6.2.4 Other Pressure Pump Services
6.2.4.1 Definition & Description
6.2.4.2 Revenue Forecast
7 Pressure Pumping Market, By Geography (Page No. - 120)
7.1 Introduction
7.2 Geographic Analysis of the Pressure Pumping Market
7.2.1 Revenue & Forecast
7.3 Regional Analysis of Different Pressure Pumping Services
7.3.1 North America
7.3.1.1 Industry Trend
7.3.1.2 Regulations
7.3.1.2.1 Federal
7.3.1.2.2 Congress
7.3.1.2.3 Department of Energy (DOE)
7.3.1.2.4 Bureau of Land Management
7.3.1.2.5 State Rules
7.3.1.3 Revenue Forecast
7.3.1.4 Pressure Pump By Country
7.3.1.5 Pressure Pumping By Resource Type
7.3.1.6 Pressure Pumping Market By Well Type
7.3.2 Europe
7.3.2.1 Industry Trend
7.3.2.2 Revenue Forecast
7.3.2.3 Pressure Pumping By Country
7.3.3 Asia-Pacific
7.3.3.1 Industry Trend
7.3.3.2 Revenue Forecast
7.3.3.3 Pressure Pumping By Country
7.3.4 South & Central America
7.3.4.1 Industry Trend
7.3.4.2 Revenue Forecast
7.3.4.3 Pressure Pumping, By Country
7.3.5 Africa
7.3.5.1 Industry Trend
7.3.5.2 Revenue Forecast
7.3.5.3 Pressure Pump, By Country
7.3.6 the Middle East
7.3.6.1 Industry Trend
7.3.6.2 Revenue Forecast
7.3.6.3 Pressure Pump, By Country
8 Competitive Landscape (Page No. - 163)
8.1 Introduction
8.2 Key Players of the Pressure Pumping Market
8.2.1 Regional Analysis
8.2.2 Key Companies� Focus Area
8.2.2.1 Growth Strategies in the Pressure Pumping Industry
8.3 New Product, Services, & Technology-Form Success Instruments
8.4 Market Share Analysis & Rankings
8.4.1 Global Market Share Scenario
8.4.2 Market Ratings of Industry Players
8.4.2.1 North America
8.4.2.2 Rest of the World
8.5 Competitive Situation & Trends
8.5.1 New Product, Service, & Technology Launch
8.5.2 Contracts & Agreements
8.5.3 Mergers & Acquisitions
8.5.4 Investments & Expansions
8.5.5 Joint Ventures & Partnerships
9 Company Profile (Overview, Financials, Products & Services, Strategy, and Developments)* (Page No. - 183)
9.1 Baker Hughes
9.2 Schlumberger
9.3 Halliburton
9.4 Weatherford International Inc.
9.5 Frac Tech Services International
9.6 Trican
9.7 Calfrac Well Services Ltd.
9.8 RPC Inc.
9.9 Sanjel Corporation
9.10 Key Energy Services
*Details on Overview, Financials, Product & Services, Strategy, and Developments Might Not Be Captured in Case of Unlisted Companies.
List of Tables (90 Tables)
Table 1 Pressure Pumping Market, By Geography, 2011-2018 (Million Hhp)
Table 2 Comparison: Perf & Plug Vs. Sliding Sleeve
Table 3 2020 Emission Reduction Targets of Selected Regions
Table 4 Fossil Fuel Emission Levels-Pounds Per Billion Btu of Energy Input
Table 5 Water Use in U.S. Shale Plays, By Company, 2009
Table 6 Well Water Use By Activity, 2012
Table 7 Comparison: Fracturing Fluids
Table 8 Impact of Market Dynamics, 2013�2018
Table 9 Oil Reserves, By Geography, 2011�2012 (Billion Barrels)
Table 10 North America: Oil Reserves, By Country, 2011�2012 (Billion Barrels)
Table 11 South America: Oil Reserves, By Country, 2011�2012 (Billion Barrels)
Table 12 Europe: Oil Reserves Market, By Country, 2011�2012 (Billion Barrels)
Table 13 the Middle East: Oil Reserves, By Country, 2011�2012 (Billion Barrels)
Table 14 Africa: Oil Reserves, By Country, 2011�2012 (Billion Barrels)
Table 15 APAC: Oil Reserves, By Country, 2011�2012 (Billion Barrels)
Table 16 Gas Reserves, By Geography, 2011�2012 (Billion Cubic Meters)
Table 17 North America: Gas Reserves, By Country, 2011�2012 (Billion Cubic Meters)
Table 18 South America: Gas Reserves, By Country, 2011�2012 (Billion Cubic Meters)
Table 19 Europe: Gas Reserves, By Country, 2011�2012 (Billion Cubic Meters)
Table 20 the Middle East: Gas Reserves, By Country, 2011�2012 (Billion Cubic Meters)
Table 21 Africa: Gas Reserves, By Country, 2011�2012 (Billion Cubic Meters)
Table 22 APAC: Gas Reserves, By Country, 2011�2012 (Billion Cubic Meters)
Table 23 Oil Production, By Geography, 2010�2012 (Million Barrels Per Day)
Table 24 North America: Oil Production, By Country, 2010�2012 (Million Barrels Per Day)
Table 25 South America: Oil Production, By Country, 2010�2012 (Million Barrels Per Day)
Table 26 Europe: Oil Production, By Country, 2010�2012 (Million Barrels Per Day)
Table 27 the Middle East: Oil Production, By Country, 2010�2012 (Million Barrels Per Day)
Table 28 Africa: Oil Production, By Country, 2010�2012 (Million Barrels Per Day)
Table 29 APAC: Oil Production, By Country, 2010�2012 (Million Barrels Per Day)
Table 30 Gas Production, By Geography, 2010�2012 (Billion Cubic Meters)
Table 31 North America: Gas Production, By Country, 2010�2012 (Billion Cubic Meters)
Table 32 South America: Gas Production, By Country, 2010�2012 (Billion Cubic Meters)
Table 33 Europe: Gas Production, By Country, 2010�2012 (Billion Cubic Meters)
Table 34 the Middle East: Gas Production, By Country, 2010�2012 (Billion Cubic Meters
Table 35 Africa: Gas Production, By Country, 2010�2012 (Billion Cubic Meters)
Table 36 APAC: Gas Production, By Country, 2010�2012 (Billion Cubic Meters)
Table 37 Pressure Pumping Market, By Type, 2011-2018 ($Million)
Table 38 Market, By Type, 2011-2018 (Million Hhp)
Table 39 Hydraulic Fracturing Market, By Geography, 2011-2018 ($Million)
Table 40 Hydraulic Fracturing Market, By Geography, 2011-2018 (Million Hhp)
Table 41 Cementing Services Market, By Geography, 2011-2018 ($Million)
Table 42 Cementing Services Market, By Geography, 2011-2018 (Million Hhp)
Table 43 Others Pressure Pumping Services Market, By Geography, 2011-2018 ($Million)
Table 44 Others Pressure Pump Services Market, By Geography, 2011-2018 (Million Hhp)
Table 45 Pressure Pumping Market, By Geography, 2011-2018 ($Million)
Table 46 Market, By Geography, 2011-2018 (Million Hhp)
Table 47 U.S.: Technically Recoverable Shale Reserves, 2009 (Tcf)
Table 48 North America: Pressure Pumping Market, By Type, 2011-2018 ($Million)
Table 49 North America: Market, By Type, 2011-2018 (Million Hhp)
Table 50 North America Pressure Pumping Market, By Country, 2011-2018 ($Million)
Table 51 North America Pressure Pumping Market, By Country, 2011-2018 (Million Hhp)
Table 52 North America Pressure Pumping Market, By Resource Type, 2011�2018 ($Million)
Table 53 North America Pressure Pumping Market, By Resource Type, 2011�2018 (Million Hhp)
Table 54 Comparison: Horizontal Vs Vertical Drilling
Table 55 North America Pressure Pumping Market, By Well Type, 2011�2018 ($Million)
Table 56 North America Pressure Pumping Market, By Well Type, 2011�2018 (Million Hhp)
Table 57 Europe Pressure Pumping Market, By Type, 2011-2018 ($Million)
Table 58 Europe: Market, By Type, 2011-2018 (Million Hhp)
Table 59 Europe: Pressure Pumping Market, By Country, 2011-2018 ($Million)
Table 60 Europe: Market, By Country, 2011-2018 (Million Hhp)
Table 61 Asia-Pacific: Pressure Pumping Market, By Type, 2011-2018 ($Million)
Table 62 Asia-Pacific: Market, By Type, 2011-2018 (Million Hhp)
Table 63 Asia-Pacific: Pressure Pumping Market, By Country, 2011-2018 ($Million)
Table 64 Asia-Pacific: Market, By Country, 2011-2018 (Million Hhp)
Table 65 S. & C. America: Pressure Pumping Market, By Type, 2011-2018 ($Million)
Table 66 S. & C. America: Market, By Type, 2011-2018 (Million Hhp)
Table 67 South & Central America: Pressure Pumping Market, By Country, 2011-2018 ($Million)
Table 68 South & Central America: Pressure Pumping Market, By Country, 2011-2018 (Million Hhp)
Table 69 Africa: Pressure Pumping Market, By Type, 2011-2018 ($Million)
Table 70 Africa: Market, By Type, 2011-2018 (Million Hhp)
Table 71 Africa: Pressure Pumping Market, By Country, 2011-2018 ($Million)
Table 72 Africa: Market, By Country, 2011-2018 (Million Hhp)
Table 73 the Middle East: Pressure Pump Market, By Type, 2011-2018 ($Million)
Table 74 the Middle East: Market, By Type, 2011-2018 (Million Hhp)
Table 75 the Middle East: Pressure Pump Market, By Country, 2011-2018 ($Million)
Table 76 the Middle East: Market, By Country, 2011-2018 (Million Hhp)
Table 77 New Product, Service, & Technology Launch
Table 78 Contracts & Agreements
Table 79 Mergers & Acquisitions, 2010-2013
Table 80 Investments & Expansions, 2010-2013
Table 81 Joint Ventures & Partnerships
Table 82 Baker Hughes: Product/Service & their Description/Application
Table 83 Schlumberger: Product/Service & their Description/Application
Table 84 Halliburton: Products/Service & their Description/Application
Table 85 Weatherford International: Product/Service & their Description/Application
Table 86 Trican: Product/Service & their Description/Application
Table 87 Calfrac Well Services Ltd.: Product/Service & their Description/Application
Table 88 RPC Inc.: Product/Service & their Description/Application
Table 89 Sanjel Corporation: Product/Service &their Description/Application
Table 90 Key Energy Services: Product/Service &their Description/Application
List of Figures (31 Figures)
Figure 1 Well Drilling Cost Analysis, 2012
Figure 2 Research Methodology
Figure 3 Data Triangulation Methodology
Figure 4 Market Overview: Segmentation
Figure 5 Pressure Pump Market Revenue, 2011-2018 ($Million)
Figure 6 Pressure Pump Market Revenue, By Service Type, 2011-2018 ($Million)
Figure 7 Pressure Pumping Market Scenario of Different Regions, 2013
Figure 8 Hydraulic Fracturing Water Cycle & the Corresponding Impact on Potable Water Supplies
Figure 9 Factors That Determine Successful Unconventional Exploration
Figure 10 Foam Applications in Oil & Gas�1950 Till Date
Figure 11 Guar Gum Price Trends ($/Pound) 2007-2012
Figure 12 Value Chain Analysis
Figure 13 Porter�s Five Forces Analysis
Figure 14 World Primary Energy Mix, 2012
Figure 15 Pressure Pumping Market, By Type, 2013
Figure 16 Pressure Pumping Market, By Geography, 2013
Figure 17 Pressure Pumping Market, Growth Strategies, 2010-2013
Figure 18 Pressure Pumping Market Share: top Five Companies Vs Others, 2012
Figure 19 North America Pressure Pumping Market Share Analysis, By Company, 2012
Figure 20 Rest of the World Pressure Pumping Market Share Analysis, By Company, 2012
Figure 21 New Product, Service, & Technology Launch
Figure 22 Contracts & Agreements
Figure 23 Mergers & Acquisitions
Figure 24 Investments & Expansions, 2010-2013
Figure 25 Joint Ventures & Partnerships
Figure 26 Baker Hughes: SWOT Analysis
Figure 27 SWOT Analysis: Schlumberger
Figure 28 Halliburton: SWOT Analysis
Figure 29 SWOT Analysis: Weatherford International Inc.
Figure 30 SWOT Analysis: Fts International
Figure 31 Trican: SWOT Analysis


Growth opportunities and latent adjacency in Pressure Pumping Market