Disaster Recovery as a Service (DRaaS) Market

Disaster Recovery as a Service (DRaaS) Market by Service Type (Backup & Restore, Real-Time Replication, Data Protection), Deployment Mode (Public Cloud, Private Cloud), Organization Size, Vertical and Region - Global Forecast to 2028

Report Code: TC 3490 Sep, 2023, by marketsandmarkets.com

Disaster Recovery as a Service (DRaaS) Market Growth & Trends

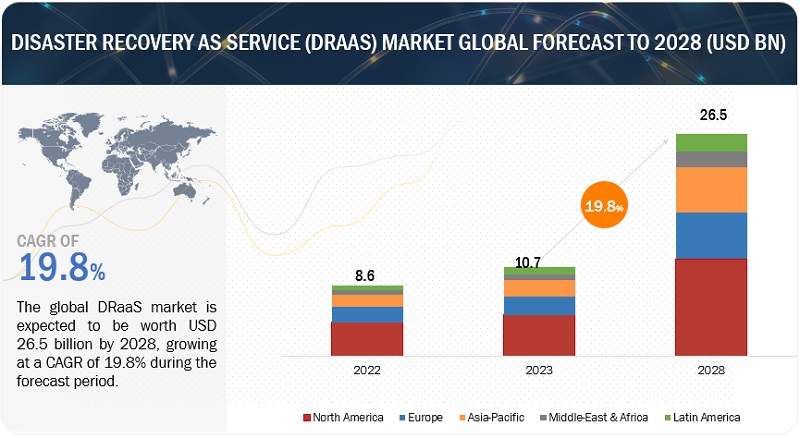
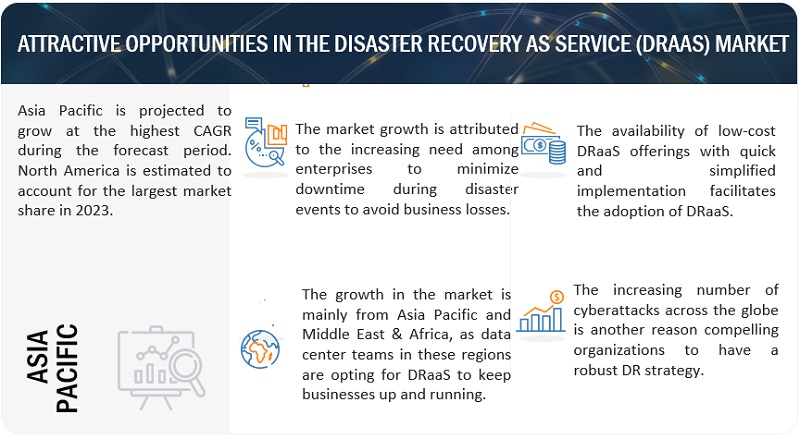
The Disaster recovery as a service Market size is expected to grow from $10.7 billion in 2023 to $26.5 billion by 2028 at a compound annual growth rate (CAGR) of 19.8% during the forecast period. DRaaS plays a pivotal role during heavy disasters by providing organizations with a lifeline to ensure business continuity and data resilience in the face of adversity. When disasters strike, such as natural catastrophes like hurricanes and earthquakes, or artificial crises such as cyberattacks, DRaaS serves as a reliable and essential tool. DRaaS allows organizations to replicate their critical data and IT infrastructure offsite, typically in secure data centers or the cloud. This redundancy ensures that even if the primary infrastructure is severely affected or compromised, the data remains intact and accessible. When a heavy disaster occurs, organizations can swiftly activate their DRaaS solutions to continue operations from the replicated environment. This minimizes downtime and prevents catastrophic data loss, enabling businesses to maintain essential functions and services.

Furthermore, DRaaS provides geographic diversity, which is crucial during heavy disasters. Data centers used for DRaaS are often located in different regions or even countries, reducing the risk of a single catastrophe impacting both the primary and backup infrastructure simultaneously. This geographic dispersal enhances data resilience and ensures that organizations can recover their operations despite widespread disasters.
Disaster Recovery as a Service (DRaaS) Market

To know about the assumptions considered for the study, Request for Free Sample Report
Disaster Recovery as a Service (DRaaS) Market

To know about the assumptions considered for the study, download the pdf brochure

DRaaS Market Dynamics

Driver:  Increased need for data security and scalability

The DRaaS market has increased due to increased demand for improved data security and seamless scalability. DRaaS provides a comprehensive solution to protect critical data and applications from unexpected disruptions, guaranteeing business continuity and reducing downtime. Data breaches, cyberattacks, and natural disasters have highlighted the importance of robust data security measures. As businesses increasingly rely on digital platforms, the risks associated with data loss and operational interruptions have intensified. DRaaS proactively tackles these challenges by replicating data and applications to offsite or cloud-based environments. This ensures that data can be recovered quickly in the event of a disruption, minimizing the impact on operations and maintaining customer trust. Scalability is another key factor driving the growth of the DRaaS market. Traditional disaster recovery solutions often require significant upfront investments in hardware and infrastructure, which could be inflexible when adapting to changing business needs. DRaaS, on the other hand, allows organizations to scale their recovery resources on demand, adjusting to changes in data volume and application requirements. This flexibility enables businesses to manage their IT resources efficiently, optimizing costs while ensuring optimal performance.

Restraint: Reluctance of enterprises in adopting cloud-based DRaaS over traditional methods

The growth of the DRaaS market faces a significant hurdle as enterprises hesitate to transition from traditional disaster recovery methods to cloud-based alternatives. Their reluctance is mainly attributed to concerns related to data security, control, and unfamiliarity with the cloud environment. Many businesses have long relied on conventional disaster recovery setups, which involve on-premises infrastructure and data centers, providing a sense of control over data and operations. This makes some enterprises hesitant to entrust their critical data and applications to external cloud providers. They believe that on-premises solutions offer more tangible control over data security and accessibility, which deters the full adoption of cloud-based DRaaS.

The primary concern is data security, which remains paramount for enterprises, especially those dealing with sensitive information. They worry about the potential vulnerabilities of storing their data in the cloud. The fear of data breaches or unauthorized access is a significant deterrent to embracing cloud-based solutions despite the advancements in cloud security technologies and protocols. Furthermore, the shift to cloud-based DRaaS may require a significant adjustment in operational procedures and IT skill sets. Enterprises accustomed to managing their infrastructure might find it challenging to navigate the complexities of cloud platforms. The unfamiliarity with cloud technologies, coupled with the perceived difficulties in migration and integration, can hinder the willingness to adopt DRaaS. Enterprises have been reluctant to shift from traditional disaster recovery methods, which has resulted in resistance to the DRaaS market. This resistance includes concerns over data security, control, and operational adjustments. However, as cloud technology evolves and gains trust, businesses may gradually adopt cloud-based DRaaS solutions. These solutions can improve efficiency, scalability, and resilience against disruptions.

Opportunity: SMEs represent a significant opportunity within the DRaaS market

Small and medium-sized enterprises (SMEs) increasingly recognize the value of outsourced disaster recovery solutions. DRaaS provides access to enterprise-level disaster recovery capabilities without the upfront investments in building and managing their infrastructure. This is particularly well-suited for SMEs due to its scalability, affordability, and ease of implementation.

SMEs often lack the financial and technical resources to establish and maintain elaborate in-house disaster recovery systems. DRaaS offers a compelling proposition for these businesses, providing cost-effective yet reliable solutions that safeguard critical data and applications in the face of unexpected disruptions. Cloud-based DRaaS is especially favorable for SMEs as it allows businesses to scale resources based on their evolving needs, optimize costs, and maintain efficient recovery processes.

Cloud providers continuously enhance their security measures, addressing compliance requirements across industries and assuaging concerns about data protection. This is essential for SMEs that rely on remote access to applications or have distributed teams. Adopting remote work arrangements and the globalization of markets further emphasize the importance of accessible and flexible disaster recovery solutions. SMEs can leverage DRaaS to ensure uninterrupted operations, regardless of location.

Challenge: Vendor lock-in

One of the major challenges in the DRaaS market is vendor lock-in. This term is when a business becomes overly dependent on a particular DRaaS provider's technology and services. This can make switching to another provider or revert to previous solutions hard. Several factors contribute to this challenge, including complex configurations that are designed to work with a specific provider’s infrastructure and services. Such intricacies can hinder interoperability between providers, making data and application migration cumbersome. Additionally, DRaaS providers use different data formats, storage mechanisms, and proprietary technologies, making transferring data from one provider's environment to another problematic and disruptive. Cost also plays a role in vendor lock-in, as transitioning from one DRaaS provider to another may involve unexpected expenses, such as data transfer and setup fees, which can discourage businesses from switching.

Migrating to a different cloud service provider can be a time-consuming and complex process, resulting in downtime that can negatively impact business operations and continuity. This problem is especially critical when businesses need to maintain uninterrupted services. To overcome the challenge of vendor lock-in, companies should prioritize data portability and interoperability. This can be achieved by choosing DRaaS providers that follow industry standards and open architectures, making it easier to transition if necessary. In addition, implementing a multi-cloud or hybrid approach can help mitigate vendor lock-in by distributing data and applications across several providers or combining cloud and on-premises resources. This approach enhances flexibility and reduces the dependence on a single vendor's ecosystem.

DRaaS Market Ecosystem

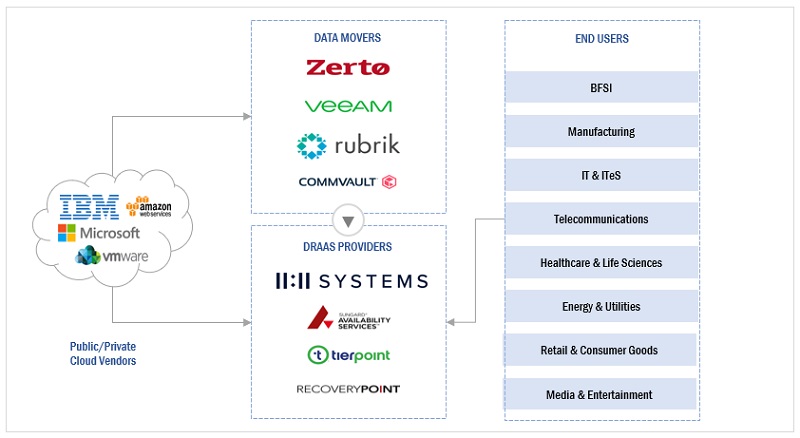
The DRaaS ecosystem comprises various entities that work together to cater to the disaster recovery needs of enterprises of different sizes. These entities include data movers, cloud service providers (CSPs), and end-users comprising SMEs and large enterprises. DRaaS vendors offer system integration to provide DR services to end-users through various deployment modes. Cloud providers use cutting-edge cloud-based technologies to develop high-end cloud services tailored to their customers' IT requirements. These services include real-time replication, backup, data security, and professional services. DRaaS vendors, such as 11:11 Systems, TierPoint, and Recovery Point Systems, provide cloud-based DRaaS services.

On the other hand, data movers provide backup and replication of data to on-premises or cloud targets. DRaaS providers adopt partnerships, collaborations, and agreements as their primary strategies for large-scale DR strategy implementation. The following figure shows the ecosystem of the DRaaS market:
Disaster Recovery as a Service (DRaaS) Market

Based on vertical, BFSI  vertical is expected to hold the largest market share during the forecast period.

Based on the vertical, the DRaaS market is segmented into BFSI, Telecommunications, IT & ITeS, Government & Public Sector, Retail & Consumer Goods, Manufacturing, Energy & Utilities, Media & Entertainment, Healthcare & Life Sciences, and Other Verticals. Among the verticals, the BFSI segment is expected to hold the largest market share during the forecast period. DRaaS is a crucial component of the BFSI sector, where continuous operations, data security, and regulatory compliance are essential. In this dynamic and highly regulated industry, DRaaS provides a strategic solution for ensuring business continuity, safeguarding critical data, and adhering to strict compliance requirements. Even minor disruptions can have far-reaching consequences in the BFSI sector. DRaaS enables these institutions to recover quickly from disruptions such as cyberattacks, hardware failures, natural disasters, and human errors. Which reduces downtime, minimizes financial losses, and maintains customer trust.

Data security is most important in the BFSI sector due to the sensitive and confidential nature of financial transactions and personal information. DRaaS guarantees that data is encrypted, replicated, and stored securely in offsite or cloud-based environments. This prevents data breaches and adheres to regulatory requirements, such as the GDPR and industry-specific mandates. Compliance with regulatory standards is a crucial consideration in the BFSI vertical. DRaaS solutions address these needs by providing auditable disaster recovery processes, data retention policies, and data recovery testing. This helps BFSI organizations comply with the regulations and demonstrate their commitment to safeguarding customer information.

The BFSI sector benefits significantly from the scalability of DRaaS. Institutions can adjust their resources based on transaction volumes, ensuring optimal performance during peak times while efficiently managing costs during lulls. DRaaS in the BFSI vertical generally assures swift recovery, data protection, regulatory compliance, and operational continuity. As digital transformation continues to reshape the industry, the role of DRaaS in safeguarding sensitive information, maintaining customer trust, and upholding regulatory mandates becomes increasingly indispensable.

The SME segment holds the highest CAGR during the forecast period based on organization size.

The DRaaS market is segmented into large enterprises and SMEs based on the organization size. As per the organization size, the SME segment is expected to hold the highest CAGR during the forecast period. The SME segment plays a vital role in driving innovation within the DRaaS market. These businesses require tailored solutions that match their unique requirements, which leads DRaaS providers to create simplified interfaces, flexible pricing models, and user-friendly setups. It expands the options available to SMEs and influences the overall direction of DRaaS development.

In conclusion, the SME segment has a transformative impact on the DRaaS market. Its increasing adoption of these solutions contributes to market expansion, innovation, and accessibility. DRaaS solutions play a crucial role in enhancing business resilience across industries by providing SMEs a pathway to bolster their disaster recovery capabilities, fostering a dynamic and adaptable digital ecosystem.

The US market is projected to contribute the largest share of the DRaaS market in North America.

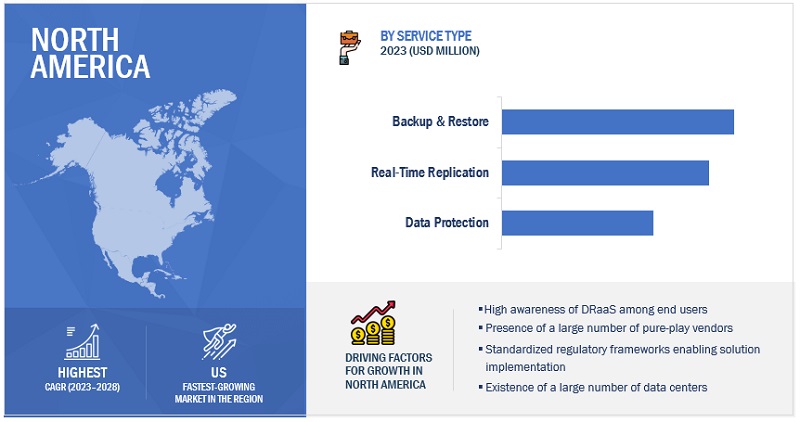
North America is expected to lead the DRaaS market in 2023. The US is estimated to account for the largest market share in North America in 2023 in the DRaaS market, and the trend is expected to continue until 2028. In the US, DRaaS plays a crucial role in protecting businesses from various threats. With the increasing dependence on digital technology, concerns about cybersecurity, and the constant risk of natural disasters, DRaaS has become essential for business continuity. The US has stringent data protection regulations that include HIPAA and GDPR for international data transfers. DRaaS ensures data availability and recovery, thus aiding compliance. Hurricanes, wildfires, and other disasters pose a constant threat to businesses. DRaaS enables IT systems to recover quickly, thereby minimizing disruption. Numerous American companies opt for managed DRaaS solutions, outsourcing disaster recovery management to experts. In summary, DRaaS in the US ensures business resilience, data protection, and regulatory compliance, making it a fundamental component of disaster preparedness and continuity planning for American businesses.
Disaster Recovery as a Service (DRaaS) Market Size, and Share

Key Market Players

The DRaaS market is dominated by a few globally established players such as AWS (US), Microsoft (US), IBM (US), VMware (US), 11:11 Systems (US), Recovery Point Systems (US) InterVision Systems (US), TierPoint  (US), Infrascale (US), and Zerto (US) among others, are the key vendors that secured DRaaS contracts in last few years. These vendors can bring global processes and execution expertise; the local players only have local expertise. Driven by increased disposable incomes, easy access to knowledge, and fast adoption of technological products, buyers are more willing to experiment/test new things in the DRaaS market.

Get online access to the report on the World's First Market Intelligence Cloud

  • Easy to Download Historical Data & Forecast Numbers
  • Company Analysis Dashboard for high growth potential opportunities
  • Research Analyst Access for customization & queries
  • Competitor Analysis with Interactive dashboard
  • Latest News, Updates & Trend analysis
Request Sample

Scope of the Report

Report Metrics

Details

Market size available for years

2018–2028

Base year considered

2022

Forecast period

2023–2028

Forecast units

Value (USD Million/Billion)

Segments Covered

Service Type, Deployment Mode, Organization Size, Vertica, and Region

Geographies Covered

North America, Europe, Asia Pacific, Middle East and Africa, and Latin America

Companies Covered

Some of the significant DRaaS market vendors are AWS (US), Microsoft (US), IBM (US), VMware (US), 11:11 Systems (US), Recovery Point Systems (US), InterVision Systems (US), TierPoint  (US), Infrascale (US), and Zerto (US).

This research report categorizes the DRaaS market based on service types, verticals, organization sizes,  deployment modes, and regions.

Based on the Service Type:
  • Real-time Replication
  • Backup & Restore
  • Data Protection
  • Professional Services
Based on the Organization Size:
  • Large Enterprises
  • SMEs
Based on the Deployment Mode:
  • Public Cloud
  • Private Cloud
Based on the Vertical:
  • BFSI
  • Telecommunication
  • IT & ITeS
  • Government & Public Sector
  • Retail & Consumer Goods
  • Manufacturing
  • Energy & Utilities
  • Media & Entertainment
  • Healthcare & Life Sciences
  • Other Verticals
Based on the Region:
  • North America
    • United States
    • Canada
  • Europe
    • UK
    • Germany
    • France
    • Rest of Europe
  • Asia Pacific
    • China
    • Japan
    • Australia
    • Rest of Asia Pacific
  • Middle East & Africa
    • Kingdom of Saudi Arabia
    • United Arab Emirates
    • South Africa
    • Rest of the Middle East & Africa
  • Latin America
    • Brazil
    • Mexico
    • Rest of Latin America

Recent Developments:

  • In August 2023, Microsoft updated and improved the Azure Site Recovery service to help users stay up-to-date; it provides users with information about the latest releases, new features, and new content.
  • In July 2023, VMware improved its products' security features to help prevent and mitigate ransomware attacks. This includes enhanced access controls, encryption, network segmentation, and integration with third-party security tools. Moreover, VMware offers backup and recovery solutions that enable users to create regular snapshots and backups of their virtual machines. These snapshots can be used to restore systems to a previous state in case of a ransomware attack. Organizations can recover data without paying ransom to attackers by having reliable backup processes.
  • In March 2023, 11:11 Systems, a managed infrastructure solutions provider, announced the general availability of 11:11 Managed Backup for Cohesity, a fully managed service for on-premises data protection. By combining Cohesity’s solution deployed on-site with 11:11’s onboarding, configuration, and ongoing management, customers get comprehensive protection from a secure, scalable backup offering in a single, seamless solution. In a ransomware attack, customers can quickly recover at scale.

Frequently Asked Questions (FAQ):

To speak to our analyst for a discussion on the above findings, click Speak to Analyst

TABLE OF CONTENTS
 
1 INTRODUCTION (Page No. - 32)
    1.1 STUDY OBJECTIVES 
    1.2 MARKET DEFINITION 
           1.2.1 INCLUSIONS AND EXCLUSIONS
    1.3 MARKET SCOPE 
           1.3.1 MARKET SEGMENTATION
           1.3.2 REGIONS COVERED
           1.3.3 YEARS CONSIDERED
    1.4 CURRENCY CONSIDERED 
           TABLE 1 UNITED STATES DOLLAR EXCHANGE RATE, 2018–2022
    1.5 STAKEHOLDERS 
    1.6 SUMMARY OF CHANGES 
           1.6.1 IMPACT OF RECESSION
 
2 RESEARCH METHODOLOGY (Page No. - 38)
    2.1 RESEARCH DATA 
           FIGURE 1 DISASTER RECOVERY AS A SERVICE MARKET: RESEARCH DESIGN
           2.1.1 SECONDARY DATA
           2.1.2 PRIMARY DATA
                    2.1.2.1 Breakup of primary profiles
                               FIGURE 2 BREAKUP OF PRIMARY INTERVIEWS: BY COMPANY TYPE, DESIGNATION, AND REGION
                    2.1.2.2 Key insights from industry experts
    2.2 DATA TRIANGULATION 
    2.3 MARKET SIZE ESTIMATION 
           FIGURE 3 DISASTER RECOVERY AS A SERVICE MARKET: TOP-DOWN AND BOTTOM-UP APPROACHES
           FIGURE 4 MARKET SIZE ESTIMATION METHODOLOGY – APPROACH 1 (SUPPLY SIDE): REVENUE OF SERVICES FROM VENDORS
           FIGURE 5 MARKET SIZE ESTIMATION METHODOLOGY: BOTTOM-UP APPROACH (SUPPLY SIDE): COLLECTIVE REVENUE OF VENDORS
           FIGURE 6 MARKET SIZE ESTIMATION METHODOLOGY – (SUPPLY SIDE): CAGR PROJECTIONS FROM SUPPLY SIDE
           FIGURE 7 MARKET SIZE ESTIMATION METHODOLOGY ? APPROACH 2 (BOTTOM-UP): REVENUE GENERATED BY VENDORS FROM EACH APPLICATION
           FIGURE 8 MARKET SIZE ESTIMATION METHODOLOGY–APPROACH 2 (DEMAND SIDE): REVENUE GENERATED FROM DIFFERENT SERVICE TYPES
    2.4 MARKET FORECAST 
           TABLE 2 FACTOR ANALYSIS
    2.5 RECESSION IMPACT AND RESEARCH ASSUMPTIONS 
           TABLE 3 RESEARCH ASSUMPTIONS
    2.6 LIMITATIONS 
 
3 EXECUTIVE SUMMARY (Page No. - 51)
    FIGURE 9 DISASTER RECOVERY AS A SERVICE MARKET SNAPSHOT, 2020–2028 
    FIGURE 10 TOP MARKET SEGMENTS IN TERMS OF GROWTH RATE 
    FIGURE 11 BACKUP & RESTORE SEGMENT TO ACCOUNT FOR LARGEST MARKET BY 2028 
    FIGURE 12 PUBLIC CLOUD SEGMENT TO ACCOUNT FOR LARGER MARKET BY 2028 
    FIGURE 13 LARGE ENTERPRISES SEGMENT TO ACCOUNT FOR LARGER MARKET BY 2028 
    FIGURE 14 BFSI SEGMENT TO ACCOUNT FOR LARGEST MARKET BY 2028 
    FIGURE 15 NORTH AMERICA TO ACCOUNT FOR LARGEST MARKET SHARE DURING FORECAST PERIOD 
 
4 PREMIUM INSIGHTS (Page No. - 58)
    4.1 ATTRACTIVE GROWTH OPPORTUNITIES FOR PLAYERS IN DISASTER RECOVERY AS A SERVICE MARKET 
           FIGURE 16 DRASTIC GEOGRAPHIC CHANGE AND TECHNOLOGICAL EVOLUTION TO HELP DISASTER RECOVERY AS A SERVICE SUSTAIN GROWTH
    4.2 MARKET, BY SERVICE TYPE, 2023 VS. 2028 
           FIGURE 17 BACKUP & RESTORE SEGMENT TO ACCOUNT FOR LARGEST MARKET SHARE DURING FORECAST PERIOD
    4.3 MARKET, BY DEPLOYMENT MODE, 2023 VS. 2028 
           FIGURE 18 PUBLIC CLOUD SEGMENT TO ACCOUNT FOR LARGER MARKET SHARE DURING FORECAST PERIOD
    4.4 MARKET, BY ORGANIZATION SIZE, 2023 VS. 2028 
           FIGURE 19 LARGE ENTERPRISES SEGMENT TO ACCOUNT FOR LARGER MARKET SHARE DURING FORECAST PERIOD
    4.5 MARKET, BY VERTICAL, 2023 VS. 2028 
           FIGURE 20 BFSI SEGMENT TO ACCOUNT FOR LARGEST MARKET SHARE DURING FORECAST PERIOD
    4.6 MARKET, BY REGION, 2023–2028 
           FIGURE 21 ASIA PACIFIC TO EMERGE AS BEST MARKET FOR INVESTMENTS IN NEXT FIVE YEARS
 
5 MARKET OVERVIEW AND INDUSTRY TRENDS (Page No. - 61)
    5.1 INTRODUCTION 
    5.2 MARKET DYNAMICS 
           FIGURE 22 DRIVERS, RESTRAINTS, OPPORTUNITIES, AND CHALLENGES: DISASTER RECOVERY AS A SERVICE MARKET
           5.2.1 DRIVERS
                    5.2.1.1 Need to lower TCO, save time, and enable IT teams to shift focus to higher-value tasks
                               FIGURE 23 AFFORDABILITY OF DISASTER MANAGEMENT DUE TO FASTER RECOVERY TIMES
                    5.2.1.2 Increased need for data security and scalability
                    5.2.1.3 Rising DRaaS utilization to mitigate risk of cyberattacks on data centers
                    5.2.1.4 Increased need for business continuity across SMEs
           5.2.2 RESTRAINTS
                    5.2.2.1 Concerns over dependency on service providers
                    5.2.2.2 Reluctance of enterprises in adopting cloud-based DRaaS over traditional methods
           5.2.3 OPPORTUNITIES
                    5.2.3.1 Rising adoption of cloud due to COVID-19 pandemic
                               FIGURE 24 COVID-19 TO DRIVE CLOUD ADOPTION, 2021
                               FIGURE 25 GROWING INCLINATION OF ORGANIZATIONS TOWARD MSPS FOR DATA SECURITY AND BACKUP, 2021
                    5.2.3.2 Emergence of AI and ML in DRaaS solutions to strengthen DR strategies of enterprises
                    5.2.3.3 SMEs to represent significant opportunity within DRaaS market
           5.2.4 CHALLENGES
                    5.2.4.1 Difficulty in achieving security and compliance in cloud environments
                    5.2.4.2 Potential performance issues with applications running in cloud and bandwidth challenges
                    5.2.4.3 Vendor lock-in
    5.3 CASE STUDY ANALYSIS 
           5.3.1 CASE STUDY 1: ALLEGANY INSURANCE GROUP SIMPLIFIED ITS DISASTER RECOVERY STRATEGY WITH ILAND
           5.3.2 CASE STUDY 2: INTERVISION DRAAS TRANSITIONED MANUFACTURING COMPANY FOR GREATER RESILIENCE WITH INTERVISION
           5.3.3 CASE STUDY 3: COMPUTER-DRIVEN SOLUTIONS DEPLOYED IBDR TO PROTECT DATA AND PREPARE FOR DISASTERS
           5.3.4 CASE STUDY 4: RMS USED TIERPOINT’S HYBRID CLOUD & DRAAS TO IMPROVE PERFORMANCE AND RELIABILITY
           5.3.5 CASE STUDY 5: ACRONIS HELPED UCIT SOLUTIONS TRANSITION TO CYBER DISASTER RECOVERY CLOUD
           5.3.6 CASE STUDY 6: INFOSTREAM SAFEGUARDED CRITICAL DATA AND ENSURED SWIFT RECOVERY WITH AXCIENT CLOUD BACKUP
           5.3.7 CASE STUDY 7: WAHA CAPITAL SAFEGUARDED BUSINESS CONTINUITY WITH DISASTER RECOVERY FROM CLOUDHPT
    5.4 ECOSYSTEM ANALYSIS 
           FIGURE 26 DISASTER RECOVERY AS A SERVICE MARKET: ECOSYSTEM ANALYSIS
    5.5 PRICING ANALYSIS 
    5.6 AVERAGE SELLING PRICE TRENDS 
    5.7 AVERAGE SELLING PRICE TRENDS OF KEY PLAYERS, BY SERVICE TYPE 
           TABLE 4 MARKET: PRICING LEVELS
    5.8 PATENT ANALYSIS 
           FIGURE 27 NUMBER OF PATENTS PUBLISHED, 2012–2022
           FIGURE 28 TOP TEN PATENT APPLICANTS (GLOBAL) IN 2022
           TABLE 5 TOP TEN PATENT OWNERS
 
6 DISASTER RECOVERY AS A SERVICE MARKET, BY SERVICE TYPE (Page No. - 79)
    6.1 INTRODUCTION 
           FIGURE 29 BACKUP & RESTORE SERVICES TO GROW AT HIGHEST CAGR DURING FORECAST PERIOD
           6.1.1 SERVICE TYPE: MARKET DRIVERS
                    TABLE 6 MARKET, BY SERVICE TYPE, 2018–2022 (USD MILLION)
                    TABLE 7 MARKET, BY SERVICE TYPE, 2023–2028 (USD MILLION)
    6.2 REAL-TIME REPLICATION 
           6.2.1 REAL-TIME REPLICATION TO HELP PREVENT DATA LOSS AND DOWNTIME DURING DISRUPTIONS
                    TABLE 8 REAL-TIME REPLICATION: MARKET, BY REGION, 2018–2022 (USD MILLION)
                    TABLE 9 REAL-TIME REPLICATION: MARKET, BY REGION, 2023–2028 (USD MILLION)
    6.3 BACKUP & RESTORE 
           6.3.1 BACKUP AND RESTORE TO ENSURE SECURITY OF VITAL DATA AND PROTECT THEM AGAINST POTENTIAL LOSS AND DISRUPTION
                    TABLE 10 BACKUP & RESTORE: MARKET, BY REGION, 2018–2022 (USD MILLION)
                    TABLE 11 BACKUP & RESTORE: MARKET, BY REGION, 2023–2028 (USD MILLION)
    6.4 DATA PROTECTION 
           6.4.1 DATA PROTECTION TO SHIELD BUSINESSES FROM POTENTIAL DISRUPTIONS
                    TABLE 12 DATA PROTECTION: MARKET, BY REGION, 2018–2022 (USD MILLION)
                    TABLE 13 DATA PROTECTION: MARKET, BY REGION, 2023–2028 (USD MILLION)
    6.5 PROFESSIONAL SERVICES 
           6.5.1 PROFESSIONAL SERVICES TO PLAN, DEPLOY, INTEGRATE, CONSULT, SUPPORT, AND OFFER IT MAINTENANCE, REPAIR, AND UPGRADE
                    TABLE 14 PROFESSIONAL SERVICES: MARKET, BY REGION, 2018–2022 (USD MILLION)
                    TABLE 15 PROFESSIONAL SERVICES: MARKET, BY REGION, 2023–2028 (USD MILLION)
           6.5.2 INTEGRATION
           6.5.3 TRAINING & CONSULTING
           6.5.4 SUPPORT & MAINTENANCE
 
7 DISASTER RECOVERY AS A SERVICE MARKET, BY DEPLOYMENT MODE (Page No. - 88)
    7.1 INTRODUCTION 
           FIGURE 30 PRIVATE CLOUD DEPLOYMENT MODE TO GROW AT HIGHER CAGR DURING FORECAST PERIOD
           7.1.1 DEPLOYMENT MODE: MARKET DRIVERS
                    TABLE 16 MARKET, BY DEPLOYMENT MODE, 2018–2022 (USD MILLION)
                    TABLE 17 MARKET, BY DEPLOYMENT MODE, 2023–2028 (USD MILLION)
    7.2 PUBLIC CLOUD 
           7.2.1 PUBLIC CLOUD TO ENABLE RAPID SCALABILITY, IMPROVE DATA RESILIENCE, AND OFFER ADVANCED SECURITY MEASURES
                    TABLE 18 PUBLIC CLOUD: MARKET, BY REGION, 2018–2022 (USD MILLION)
                    TABLE 19 PUBLIC CLOUD: MARKET, BY REGION, 2023–2028 (USD MILLION)
    7.3 PRIVATE CLOUD 
           7.3.1 PRIVATE CLOUD TO OFFER HEIGHTENED SECURITY, CUSTOMIZATION, AND SCALABILITY
                    TABLE 20 PRIVATE CLOUD: MARKET, BY REGION, 2018–2022 (USD MILLION)
                    TABLE 21 PRIVATE CLOUD: MARKET, BY REGION, 2023–2028 (USD MILLION)
 
8 DISASTER RECOVERY AS A SERVICE MARKET, BY ORGANIZATION SIZE (Page No. - 93)
    8.1 INTRODUCTION 
           FIGURE 31 SMES SEGMENT TO GROW AT HIGHER CAGR DURING FORECAST PERIOD
           8.1.1 ORGANIZATION SIZE: MARKET DRIVERS
                    TABLE 22 MARKET, BY ORGANIZATION SIZE, 2018–2022 (USD MILLION)
                    TABLE 23 MARKET, BY ORGANIZATION SIZE, 2023–2028 (USD MILLION)
    8.2 LARGE ENTERPRISES 
           8.2.1 DRAAS TO OFFER ORCHESTRATION, TESTING ENVIRONMENTS, AND HYBRID CLOUD SETUPS TO LARGE ENTERPRISES
                    TABLE 24 LARGE ENTERPRISES: MARKET, BY REGION, 2018–2022 (USD MILLION)
                    TABLE 25 LARGE ENTERPRISES: MARKET, BY REGION, 2023–2028 (USD MILLION)
    8.3 SMALL & MEDIUM-SIZED ENTERPRISES 
           8.3.1 SMES TO ACCESS COST-EFFECTIVE, FLEXIBLE, AND SCALABLE EASY-TO-MANAGE SOLUTIONS WITH DRAAS
                    TABLE 26 SMALL & MEDIUM-SIZED ENTERPRISES: MARKET, BY REGION, 2018–2022 (USD MILLION)
                    TABLE 27 SMALL & MEDIUM-SIZED ENTERPRISES: MARKET, BY REGION, 2023–2028 (USD MILLION)
 
9 DISASTER RECOVERY AS A SERVICE MARKET, BY VERTICAL (Page No. - 98)
    9.1 INTRODUCTION 
           FIGURE 32 BANKING, FINANCIAL SERVICES, AND INSURANCE VERTICAL TO HOLD LARGEST MARKET DURING FORECAST PERIOD
           9.1.1 VERTICAL: MARKET DRIVERS
                    TABLE 28 MARKET, BY VERTICAL, 2018–2022 (USD MILLION)
                    TABLE 29 MARKET, BY VERTICAL, 2023–2028 (USD MILLION)
    9.2 BFSI 
           9.2.1 DRAAS TO HELP STORE AND MANAGE CUSTOMERS’ CONFIDENTIAL INFORMATION AND REDUCE DOWNTIME
                    TABLE 30 BFSI: MARKET, BY REGION, 2018–2022 (USD MILLION)
                    TABLE 31 BFSI: MARKET, BY REGION, 2023–2028 (USD MILLION)
    9.3 TELECOMMUNICATIONS 
           9.3.1 DRAAS TO ENSURE SEAMLESS CONNECTIVITY, DATA AVAILABILITY, AND CUSTOMER SATISFACTION FOR TELECOMMUNICATIONS COMPANIES
                    TABLE 32 TELECOMMUNICATIONS: DISASTER RECOVERY AS A SERVICE MARKET, BY REGION, 2018–2022 (USD MILLION)
                    TABLE 33 TELECOMMUNICATIONS: MARKET, BY REGION, 2023–2028 (USD MILLION)
    9.4 IT & ITES 
           9.4.1 DRAAS TO REPLICATE CRITICAL DATA AND APPLICATIONS, MINIMIZE DOWNTIME, ENSURE PROMPT RECOVERY, AND PRESERVE INTEGRITY OF OPERATIONS
                    TABLE 34 IT & ITES: MARKET, BY REGION, 2018–2022 (USD MILLION)
                    TABLE 35 IT & ITES: MARKET, BY REGION, 2023–2028 (USD MILLION)
    9.5 GOVERNMENT & PUBLIC SECTOR 
           9.5.1 DRAAS TO REPLICATE DATA TO SECURE OFF-SITE OR CLOUD ENVIRONMENTS, MINIMIZE DOWNTIME, AND ALLOW GOVERNMENT ENTITIES TO SWIFTLY RESUME OPERATIONS
                    TABLE 36 GOVERNMENT & PUBLIC SECTOR: MARKET, BY REGION, 2018–2022 (USD MILLION)
                    TABLE 37 GOVERNMENT & PUBLIC SECTOR: MARKET, BY REGION, 2023–2028 (USD MILLION)
    9.6 RETAIL & CONSUMER GOODS 
           9.6.1 DRAAS TO ENSURE OPERATIONAL CONTINUITY, SAFEGUARD SENSITIVE CUSTOMER DATA, AND MAINTAIN SEAMLESS CUSTOMER EXPERIENCES
                    TABLE 38 RETAIL & CONSUMER GOODS: MARKET, BY REGION, 2018–2022 (USD MILLION)
                    TABLE 39 RETAIL & CONSUMER GOODS: MARKET, BY REGION, 2023–2028 (USD MILLION)
    9.7 MANUFACTURING 
           9.7.1 DRAAS TO HELP MANUFACTURERS PROTECT THEIR DATA, MAINTAIN PRODUCTION CONTINUITY, AND NAVIGATE UNFORESEEN DISRUPTIONS EFFICIENTLY
                    TABLE 40 MANUFACTURING: DISASTER RECOVERY AS A SERVICE MARKET, BY REGION, 2018–2022 (USD MILLION)
                    TABLE 41 MANUFACTURING: MARKET, BY REGION, 2023–2028 (USD MILLION)
    9.8 ENERGY & UTILITIES 
           9.8.1 DRAAS TO SAFEGUARD ESSENTIAL SERVICES, PROTECT SENSITIVE DATA, AND ENSURE REGULATORY COMPLIANCE
                    TABLE 42 ENERGY & UTILITIES: MARKET, BY REGION, 2018–2022 (USD MILLION)
                    TABLE 43 ENERGY & UTILITIES: MARKET, BY REGION, 2023–2028 (USD MILLION)
    9.9 MEDIA & ENTERTAINMENT 
           9.9.1 DRAAS TO HELP GAIN FASTER TIME-TO-MARKET, MANAGE LARGE VOLUMES OF DATA, AND REDUCE COSTS
                    TABLE 44 MEDIA & ENTERTAINMENT: MARKET, BY REGION, 2018–2022 (USD MILLION)
                    TABLE 45 MEDIA & ENTERTAINMENT: MARKET, BY REGION, 2023–2028 (USD MILLION)
    9.10 HEALTHCARE & LIFE SCIENCES 
           9.10.1 DRAAS TO SECURE STORAGE, SAFEGUARD SENSITIVE HEALTH INFORMATION, AND REDUCE RISK OF DATA BREACHES OR UNAUTHORIZED ACCESS
                    TABLE 46 HEALTHCARE & LIFE SCIENCES: MARKET, BY REGION, 2018–2022 (USD MILLION)
                    TABLE 47 HEALTHCARE & LIFE SCIENCES: MARKET, BY REGION, 2023–2028 (USD MILLION)
    9.11 OTHER VERTICALS 
                    TABLE 48 OTHER VERTICALS: MARKET, BY REGION, 2018–2022 (USD MILLION)
                    TABLE 49 OTHER VERTICALS: MARKET, BY REGION, 2023–2028 (USD MILLION)
 
10 DISASTER RECOVERY AS A SERVICE MARKET, BY REGION (Page No. - 113)
     10.1 INTRODUCTION 
               FIGURE 33 NORTH AMERICA TO ACCOUNT FOR LARGEST MARKET SIZE BY 2028
               TABLE 50 MARKET, BY REGION, 2018–2022 (USD MILLION)
               TABLE 51 MARKET, BY REGION, 2023–2028 (USD MILLION)
     10.2 NORTH AMERICA 
             10.2.1 NORTH AMERICA: MARKET DRIVERS
             10.2.2 NORTH AMERICA: RECESSION IMPACT
                       FIGURE 34 NORTH AMERICA: MARKET SNAPSHOT
                       TABLE 52 NORTH AMERICA: DISASTER RECOVERY AS A SERVICE MARKET, BY SERVICE TYPE, 2018–2022 (USD MILLION)
                       TABLE 53 NORTH AMERICA: MARKET, BY SERVICE TYPE, 2023–2028 (USD MILLION)
                       TABLE 54 NORTH AMERICA: MARKET, BY DEPLOYMENT MODE, 2018–2022 (USD MILLION)
                       TABLE 55 NORTH AMERICA: MARKET, BY DEPLOYMENT MODE, 2023–2028 (USD MILLION)
                       TABLE 56 NORTH AMERICA: MARKET, BY ORGANIZATION SIZE, 2018–2022 (USD MILLION)
                       TABLE 57 NORTH AMERICA: MARKET, BY ORGANIZATION SIZE, 2023–2028 (USD MILLION)
                       TABLE 58 NORTH AMERICA: MARKET, BY VERTICAL, 2018–2022 (USD MILLION)
                       TABLE 59 NORTH AMERICA: MARKET, BY VERTICAL, 2023–2028 (USD MILLION)
                       TABLE 60 NORTH AMERICA: MARKET, BY COUNTRY, 2018–2022 (USD MILLION)
                       TABLE 61 NORTH AMERICA: MARKET, BY COUNTRY, 2023–2028 (USD MILLION)
             10.2.3 US
                       10.2.3.1 DRaaS to ensure business resilience, data protection, and regulatory compliance
                                   TABLE 62 US: DISASTER RECOVERY AS A SERVICE MARKET, BY DEPLOYMENT MODE, 2018–2022 (USD MILLION)
                                   TABLE 63 US: MARKET, BY DEPLOYMENT MODE, 2023–2028 (USD MILLION)
                                   TABLE 64 US: MARKET, BY ORGANIZATION SIZE, 2018–2022 (USD MILLION)
                                   TABLE 65 US: MARKET, BY ORGANIZATION SIZE, 2023–2028 (USD MILLION)
             10.2.4 CANADA
                       10.2.4.1 DRaaS to help companies comply with regulations by providing secure backup and recovery mechanism for their data
                                   TABLE 66 CANADA: MARKET, BY DEPLOYMENT MODE, 2018–2022 (USD MILLION)
                                   TABLE 67 CANADA: MARKET, BY DEPLOYMENT MODE, 2023–2028 (USD MILLION)
                                   TABLE 68 CANADA: MARKET, BY ORGANIZATION SIZE, 2018–2022 (USD MILLION)
                                   TABLE 69 CANADA: MARKET, BY ORGANIZATION SIZE, 2023–2028 (USD MILLION)
     10.3 EUROPE 
             10.3.1 EUROPE: RECESSION IMPACT
                       TABLE 70 EUROPE: DISASTER RECOVERY AS A SERVICE MARKET, BY SERVICE TYPE, 2018–2022 (USD MILLION)
                       TABLE 71 EUROPE: MARKET, BY SERVICE TYPE, 2023–2028 (USD MILLION)
                       TABLE 72 EUROPE: MARKET, BY DEPLOYMENT MODE, 2018–2022 (USD MILLION)
                       TABLE 73 EUROPE: MARKET, BY DEPLOYMENT MODE, 2023–2028 (USD MILLION)
                       TABLE 74 EUROPE: MARKET, BY ORGANIZATION SIZE, 2018–2022 (USD MILLION)
                       TABLE 75 EUROPE: MARKET, BY ORGANIZATION SIZE, 2023–2028 (USD MILLION)
                       TABLE 76 EUROPE: MARKET, BY VERTICAL, 2018–2022 (USD MILLION)
                       TABLE 77 EUROPE: MARKET, BY VERTICAL, 2023–2028 (USD MILLION)
                       TABLE 78 EUROPE: MARKET, BY COUNTRY, 2018–2022 (USD MILLION)
                       TABLE 79 EUROPE: MARKET, BY COUNTRY, 2023–2028 (USD MILLION)
             10.3.2 UK
                       10.3.2.1 Presence of major cloud vendors and initiatives taken to expand business to drive market
                                   TABLE 80 UK: MARKET, BY DEPLOYMENT MODE, 2018–2022 (USD MILLION)
                                   TABLE 81 UK: MARKET, BY DEPLOYMENT MODE, 2023–2028 (USD MILLION)
                                   TABLE 82 UK: MARKET, BY ORGANIZATION SIZE, 2018–2022 (USD MILLION)
                                   TABLE 83 UK: MARKET, BY ORGANIZATION SIZE, 2023–2028 (USD MILLION)
             10.3.3 GERMANY
                       10.3.3.1 Focus on expanding cloud offerings and high demand for public cloud DRaaS among startups to propel market
                                   TABLE 84 GERMANY: DISASTER RECOVERY AS A SERVICE MARKET, BY DEPLOYMENT MODE, 2018–2022 (USD MILLION)
                                   TABLE 85 GERMANY: MARKET, BY DEPLOYMENT MODE, 2023–2028 (USD MILLION)
                                   TABLE 86 GERMANY: MARKET, BY ORGANIZATION SIZE, 2018–2022 (USD MILLION)
                                   TABLE 87 GERMANY: MARKET, BY ORGANIZATION SIZE, 2023–2028 (USD MILLION)
             10.3.4 FRANCE
                       10.3.4.1 Adoption of cloud services to store data to drive market
                                   TABLE 88 FRANCE: MARKET, BY DEPLOYMENT MODE, 2018–2022 (USD MILLION)
                                   TABLE 89 FRANCE: MARKET, BY DEPLOYMENT MODE, 2023–2028 (USD MILLION)
                                   TABLE 90 FRANCE: MARKET, BY ORGANIZATION SIZE, 2018–2022 (USD MILLION)
                                   TABLE 91 FRANCE: MARKET, BY ORGANIZATION SIZE, 2023–2028 (USD MILLION)
             10.3.5 REST OF EUROPE
                       TABLE 92 REST OF EUROPE: MARKET, BY DEPLOYMENT MODE, 2018–2022 (USD MILLION)
                       TABLE 93 REST OF EUROPE: MARKET, BY DEPLOYMENT MODE, 2023–2028 (USD MILLION)
                       TABLE 94 REST OF EUROPE: MARKET, BY ORGANIZATION SIZE, 2018–2022 (USD MILLION)
                       TABLE 95 REST OF EUROPE: MARKET, BY ORGANIZATION SIZE, 2023–2028 (USD MILLION)
     10.4 ASIA PACIFIC 
             10.4.1 ASIA PACIFIC: MARKET DRIVERS
             10.4.2 ASIA PACIFIC: RECESSION IMPACT
                       FIGURE 35 ASIA PACIFIC: MARKET SNAPSHOT
                       TABLE 96 ASIA PACIFIC: DISASTER RECOVERY AS A SERVICE MARKET, BY SERVICE TYPE, 2018–2022 (USD MILLION)
                       TABLE 97 ASIA PACIFIC: MARKET, BY SERVICE TYPE, 2023–2028 (USD MILLION)
                       TABLE 98 ASIA PACIFIC: MARKET, BY DEPLOYMENT MODE, 2018–2022 (USD MILLION)
                       TABLE 99 ASIA PACIFIC: MARKET, BY DEPLOYMENT MODE, 2023–2028 (USD MILLION)
                       TABLE 100 ASIA PACIFIC: MARKET, BY ORGANIZATION SIZE, 2018–2022 (USD MILLION)
                       TABLE 101 ASIA PACIFIC: MARKET, BY ORGANIZATION SIZE, 2023–2028 (USD MILLION)
                       TABLE 102 ASIA PACIFIC: MARKET, BY VERTICAL, 2018–2022 (USD MILLION)
                       TABLE 103 ASIA PACIFIC: MARKET, BY VERTICAL, 2023–2028 (USD MILLION)
                       TABLE 104 ASIA PACIFIC: MARKET, BY COUNTRY, 2018–2022 (USD MILLION)
                       TABLE 105 ASIA PACIFIC: MARKET, BY COUNTRY, 2023–2028 (USD MILLION)
             10.4.3 CHINA
                       10.4.3.1 DRaaS to fortify data security, improve cybersecurity resilience, and ensure business continuity
                                   TABLE 106 CHINA: MARKET, BY DEPLOYMENT MODE, 2018–2022 (USD MILLION)
                                   TABLE 107 CHINA: MARKET, BY DEPLOYMENT MODE, 2023–2028 (USD MILLION)
                                   TABLE 108 CHINA: MARKET, BY ORGANIZATION SIZE, 2018–2022 (USD MILLION)
                                   TABLE 109 CHINA: MARKET, BY ORGANIZATION SIZE, 2023–2028 (USD MILLION)
             10.4.4 JAPAN
                       10.4.4.1 Need to recover IT systems quickly and minimize downtime and disruption to drive market
                                   TABLE 110 JAPAN: MARKET, BY DEPLOYMENT MODE, 2018–2022 (USD MILLION)
                                   TABLE 111 JAPAN: MARKET, BY DEPLOYMENT MODE, 2023–2028 (USD MILLION)
                                   TABLE 112 JAPAN: MARKET, BY ORGANIZATION SIZE, 2018–2022 (USD MILLION)
                                   TABLE 113 JAPAN: MARKET, BY ORGANIZATION SIZE, 2023–2028 (USD MILLION)
             10.4.5 AUSTRALIA
                       10.4.5.1 Advanced and reliable cloud infrastructure and adoption of cloud-based services to propel market
                                   TABLE 114 AUSTRALIA: DISASTER RECOVERY AS A SERVICE MARKET, BY DEPLOYMENT MODE, 2018–2022 (USD MILLION)
                                   TABLE 115 AUSTRALIA: MARKET, BY DEPLOYMENT MODE, 2023–2028 (USD MILLION)
                                   TABLE 116 AUSTRALIA: MARKET, BY ORGANIZATION SIZE, 2018–2022 (USD MILLION)
                                   TABLE 117 AUSTRALIA: MARKET, BY ORGANIZATION SIZE, 2023–2028 (USD MILLION)
             10.4.6 REST OF ASIA PACIFIC
                       TABLE 118 REST OF ASIA PACIFIC: MARKET, BY DEPLOYMENT MODE, 2018–2022 (USD MILLION)
                       TABLE 119 REST OF ASIA PACIFIC: MARKET, BY DEPLOYMENT MODE, 2023–2028 (USD MILLION)
                       TABLE 120 REST OF ASIA PACIFIC: MARKET, BY ORGANIZATION SIZE, 2018–2022 (USD MILLION)
                       TABLE 121 REST OF ASIA PACIFIC: MARKET, BY ORGANIZATION SIZE, 2023–2028 (USD MILLION)
     10.5 MIDDLE EAST & AFRICA 
             10.5.1 MIDDLE EAST & AFRICA: MARKET
             10.5.2 MIDDLE EAST & AFRICA: RECESSION IMPACT
                       TABLE 122 MIDDLE EAST & AFRICA: DISASTER RECOVERY AS A SERVICE MARKET, BY SERVICE TYPE, 2018–2022 (USD MILLION)
                       TABLE 123 MIDDLE EAST & AFRICA: MARKET, BY SERVICE TYPE, 2023–2028 (USD MILLION)
                       TABLE 124 MIDDLE EAST & AFRICA: MARKET, BY DEPLOYMENT MODE, 2018–2022 (USD MILLION)
                       TABLE 125 MIDDLE EAST & AFRICA: MARKET, BY DEPLOYMENT MODE, 2023–2028 (USD MILLION)
                       TABLE 126 MIDDLE EAST & AFRICA: MARKET, BY ORGANIZATION SIZE, 2018–2022 (USD MILLION)
                       TABLE 127 MIDDLE EAST & AFRICA: MARKET, BY ORGANIZATION SIZE, 2023–2028 (USD MILLION)
                       TABLE 128 MIDDLE EAST & AFRICA: MARKET, BY VERTICAL, 2018–2022 (USD MILLION)
                       TABLE 129 MIDDLE EAST & AFRICA: MARKET, BY VERTICAL, 2023–2028 (USD MILLION)
                       TABLE 130 MIDDLE EAST & AFRICA: MARKET, BY COUNTRY, 2018–2022 (USD MILLION)
                       TABLE 131 MIDDLE EAST & AFRICA: MARKET, BY COUNTRY, 2023–2028 (USD MILLION)
             10.5.3 KSA
                       10.5.3.1 Government initiatives and need to develop digital infrastructure to fuel demand for DRaaS solutions
                                   TABLE 132 KSA: MARKET, BY DEPLOYMENT MODE, 2018–2022 (USD MILLION)
                                   TABLE 133 KSA: MARKET, BY DEPLOYMENT MODE, 2023–2028 (USD MILLION)
                                   TABLE 134 KSA: MARKET, BY ORGANIZATION SIZE, 2018–2022 (USD MILLION)
                                   TABLE 135 KSA: MARKET, BY ORGANIZATION SIZE, 2023–2028 (USD MILLION)
             10.5.4 UAE
                       10.5.4.1 Focus of startups on adopting cloud computing to boost demand for DRaaS solutions
                                   TABLE 136 UAE: MARKET, BY DEPLOYMENT MODE, 2018–2022 (USD MILLION)
                                   TABLE 137 UAE: MARKET, BY DEPLOYMENT MODE, 2023–2028 (USD MILLION)
                                   TABLE 138 UAE: MARKET, BY ORGANIZATION SIZE, 2018–2022 (USD MILLION)
                                   TABLE 139 UAE: MARKET, BY ORGANIZATION SIZE, 2023–2028 (USD MILLION)
             10.5.5 SOUTH AFRICA
                       10.5.5.1 Low costs, on-demand availability, and better access to cloud to compel startups to adopt DRaaS
                                   TABLE 140 SOUTH AFRICA: DISASTER RECOVERY AS A SERVICE MARKET, BY DEPLOYMENT MODE, 2018–2022 (USD MILLION)
                                   TABLE 141 SOUTH AFRICA: MARKET, BY DEPLOYMENT MODE, 2023–2028 (USD MILLION)
                                   TABLE 142 SOUTH AFRICA: MARKET, BY ORGANIZATION SIZE, 2018–2022 (USD MILLION)
                                   TABLE 143 SOUTH AFRICA: MARKET, BY ORGANIZATION SIZE, 2023–2028 (USD MILLION)
             10.5.6 REST OF MIDDLE EAST & AFRICA
                       TABLE 144 REST OF MIDDLE EAST & AFRICA: MARKET, BY DEPLOYMENT MODE, 2018–2022 (USD MILLION)
                       TABLE 145 REST OF MIDDLE EAST & AFRICA: MARKET, BY DEPLOYMENT MODE, 2023–2028 (USD MILLION)
                       TABLE 146 REST OF MIDDLE EAST & AFRICA: MARKET, BY ORGANIZATION SIZE, 2018–2022 (USD MILLION)
                       TABLE 147 REST OF MIDDLE EAST & AFRICA: MARKET, BY ORGANIZATION SIZE, 2023–2028 (USD MILLION)
     10.6 LATIN AMERICA 
             10.6.1 LATIN AMERICA: MARKET DRIVERS
             10.6.2 LATIN AMERICA: RECESSION IMPACT
                       TABLE 148 LATIN AMERICA: DISASTER RECOVERY AS A SERVICE MARKET, BY SERVICE TYPE, 2018–2022 (USD MILLION)
                       TABLE 149 LATIN AMERICA: MARKET, BY SERVICE TYPE, 2023–2028 (USD MILLION)
                       TABLE 150 LATIN AMERICA: MARKET, BY DEPLOYMENT MODE, 2018–2022 (USD MILLION)
                       TABLE 151 LATIN AMERICA: MARKET, BY DEPLOYMENT MODE, 2023–2028 (USD MILLION)
                       TABLE 152 LATIN AMERICA: MARKET, BY ORGANIZATION SIZE, 2018–2022 (USD MILLION)
                       TABLE 153 LATIN AMERICA: MARKET, BY ORGANIZATION SIZE, 2023–2028 (USD MILLION)
                       TABLE 154 LATIN AMERICA: MARKET, BY VERTICAL, 2018–2022 (USD MILLION)
                       TABLE 155 LATIN AMERICA: MARKET, BY VERTICAL, 2023–2028 (USD MILLION)
                       TABLE 156 LATIN AMERICA: MARKET, BY COUNTRY, 2018–2022 (USD MILLION)
                       TABLE 157 LATIN AMERICA: MARKET, BY COUNTRY, 2023–2028 (USD MILLION)
             10.6.3 BRAZIL
                       10.6.3.1 DRaaS to ensure organizations quickly recover their IT systems and data during disaster
                                   TABLE 158 BRAZIL: MARKET, BY DEPLOYMENT MODE, 2018–2022 (USD MILLION)
                                   TABLE 159 BRAZIL: MARKET, BY DEPLOYMENT MODE, 2023–2028 (USD MILLION)
                                   TABLE 160 BRAZIL: MARKET, BY ORGANIZATION SIZE, 2018–2022 (USD MILLION)
                                   TABLE 161 BRAZIL: MARKET, BY ORGANIZATION SIZE, 2023–2028 (USD MILLION)
             10.6.4 MEXICO
                       10.6.4.1 DRaaS to enable businesses to accelerate their digital transformation and enhance their IT capabilities
                                   TABLE 162 MEXICO: DISASTER RECOVERY AS A SERVICE MARKET, BY DEPLOYMENT MODE, 2018–2022 (USD MILLION)
                                   TABLE 163 MEXICO: MARKET, BY DEPLOYMENT MODE, 2023–2028 (USD MILLION)
                                   TABLE 164 MEXICO: MARKET, BY ORGANIZATION SIZE, 2018–2022 (USD MILLION)
                                   TABLE 165 MEXICO: MARKET, BY ORGANIZATION SIZE, 2023–2028 (USD MILLION)
             10.6.5 REST OF LATIN AMERICA
                       TABLE 166 REST OF LATIN AMERICA: MARKET, BY DEPLOYMENT MODE, 2018–2022 (USD MILLION)
                       TABLE 167 REST OF LATIN AMERICA: MARKET, BY DEPLOYMENT MODE, 2023–2028 (USD MILLION)
                       TABLE 168 REST OF LATIN AMERICA: MARKET, BY ORGANIZATION SIZE, 2018–2022 (USD MILLION)
                       TABLE 169 REST OF LATIN AMERICA: MARKET, BY ORGANIZATION SIZE, 2023–2028 (USD MILLION)
 
11 COMPETITIVE LANDSCAPE (Page No. - 164)
     11.1 INTRODUCTION 
     11.2 MARKET SHARE ANALYSIS OF TOP VENDORS 
               TABLE 170 MARKET SHARE OF KEY VENDORS, 2022
               FIGURE 36 DISASTER RECOVERY AS A SERVICE MARKET: MARKET SHARE ANALYSIS
     11.3 HISTORICAL REVENUE ANALYSIS OF TOP VENDORS 
               FIGURE 37 HISTORICAL REVENUE ANALYSIS, 2018–2022 (USD MILLION)
     11.4 COMPANY EVALUATION MATRIX FOR KEY PLAYERS 
               FIGURE 38 COMPANY EVALUATION MATRIX FOR KEY PLAYERS: CRITERIA WEIGHTAGE
             11.4.1 STARS
             11.4.2 EMERGING LEADERS
             11.4.3 PERVASIVE PLAYERS
             11.4.4 PARTICIPANTS
                       FIGURE 39 COMPANY EVALUATION MATRIX FOR KEY PLAYERS, 2022
                       TABLE 171 OVERALL COMPANY FOOTPRINT FOR KEY PLAYERS
     11.5 COMPANY EVALUATION MATRIX FOR STARTUPS/SMES 
               FIGURE 40 COMPANY EVALUATION MATRIX FOR STARTUPS/SMES: CRITERIA WEIGHTAGE
             11.5.1 PROGRESSIVE COMPANIES
             11.5.2 RESPONSIVE COMPANIES
             11.5.3 DYNAMIC COMPANIES
             11.5.4 STARTING BLOCKS
                       FIGURE 41 COMPANY EVALUATION MATRIX STARTUPS/SMES, 2022
                       TABLE 172 OVERALL COMPANY FOOTPRINT FOR STARTUPS/SMES
             11.5.5 COMPETITIVE BENCHMARKING OF KEY STARTUPS/SMES
                       TABLE 173 KEY STARTUPS/SMES
     11.6 KEY MARKET DEVELOPMENTS 
               TABLE 174 MARKET: PRODUCT LAUNCHES AND ENHANCEMENTS, 2020–2023
               TABLE 175 DISASTER RECOVERY AS A SERVICE MARKET: DEALS, 2020–2023
 
12 COMPANY PROFILES (Page No. - 183)
(Business Overview, Products/Solutions/Services Offered, Recent Developments, MnM view (Key strengths/Right to win, Strategic choices made, Weakness/competitive threats)*
     12.1 INTRODUCTION 
     12.2 MAJOR PLAYERS 
             12.2.1 AWS
                       TABLE 176 AWS: COMPANY OVERVIEW
                       FIGURE 42 AWS: COMPANY SNAPSHOT
                       TABLE 177 AWS: PRODUCTS/SOLUTIONS/SERVICES OFFERED
                       TABLE 178 AWS: PRODUCT LAUNCHES AND ENHANCEMENTS
                       TABLE 179 AWS: DEALS
             12.2.2 MICROSOFT
                       TABLE 180 MICROSOFT: COMPANY OVERVIEW
                       FIGURE 43 MICROSOFT: COMPANY SNAPSHOT
                       TABLE 181 MICROSOFT: PRODUCTS/SOLUTIONS/SERVICES OFFERED
                       TABLE 182 MICROSOFT: PRODUCT LAUNCHES AND ENHANCEMENTS
                       TABLE 183 MICROSOFT: DEALS
             12.2.3 IBM
                       TABLE 184 IBM: COMPANY OVERVIEW
                       FIGURE 44 IBM: COMPANY SNAPSHOT
                       TABLE 185 IBM: PRODUCTS/SOLUTIONS/SERVICES OFFERED
                       TABLE 186 IBM: PRODUCT LAUNCHES AND ENHANCEMENTS
                       TABLE 187 IBM: DEALS
             12.2.4 VMWARE
                       TABLE 188 VMWARE: COMPANY OVERVIEW
                       FIGURE 45 VMWARE: COMPANY SNAPSHOT
                       TABLE 189 VMWARE: PRODUCTS/SOLUTIONS/SERVICES OFFERED
                       TABLE 190 VMWARE: PRODUCT LAUNCHES AND ENHANCEMENTS
                       TABLE 191 VMWARE: DEALS
             12.2.5 11:11 SYSTEMS
                       TABLE 192 11:11 SYSTEMS: COMPANY OVERVIEW
                       TABLE 193 11:11 SYSTEMS: PRODUCTS/SOLUTIONS/SERVICES OFFERED
                       TABLE 194 11:11 SYSTEMS: PRODUCT LAUNCHES AND ENHANCEMENTS
                       TABLE 195 11:11 SYSTEMS: DEALS
             12.2.6 RECOVERY POINT SYSTEMS
                       TABLE 196 RECOVERY POINT SYSTEMS: COMPANY OVERVIEW
                       TABLE 197 RECOVERY POINT SYSTEMS: PRODUCTS/SOLUTIONS/SERVICES OFFERED
                       TABLE 198 RECOVERY POINT SYSTEMS: PRODUCT LAUNCHES AND ENHANCEMENTS
                       TABLE 199 RECOVERY POINT SYSTEMS: DEALS
             12.2.7 INTERVISION SYSTEMS
                       TABLE 200 INTERVISION SYSTEMS: COMPANY OVERVIEW
                       TABLE 201 INTERVISION SYSTEMS: PRODUCTS/SOLUTIONS/SERVICES OFFERED
                       TABLE 202 INTERVISION SYSTEMS: DEALS
             12.2.8 TIERPOINT
                       TABLE 203 TIERPOINT: COMPANY OVERVIEW
                       TABLE 204 TIERPOINT: PRODUCTS/SOLUTIONS/SERVICES OFFERED
                       TABLE 205 TIERPOINT: PRODUCT LAUNCHES AND ENHANCEMENTS
             12.2.9 INFRASCALE
                       TABLE 206 INFRASCALE: COMPANY OVERVIEW
                       TABLE 207 INFRASCALE: PRODUCTS/SOLUTIONS/SERVICES OFFERED
                       TABLE 208 INFRASCALE: PRODUCT LAUNCHES AND ENHANCEMENTS
                       TABLE 209 INFRASCALE: DEALS
             12.2.10 ZERTO
                       TABLE 210 ZERTO: COMPANY OVERVIEW
                       TABLE 211 ZERTO: PRODUCTS/SOLUTIONS/SERVICES OFFERED
                       TABLE 212 ZERTO: PRODUCT LAUNCHES AND ENHANCEMENTS
                       TABLE 213 ZERTO: DEALS
     12.3 OTHER PLAYERS 
             12.3.1 ACRONIS
             12.3.2 AXCIENT
             12.3.3 BIOS MIDDLE EAST
             12.3.4 C&W BUSINESS
             12.3.5 CARBONITE
             12.3.6 DAISY
             12.3.7 DATABARRACKS
             12.3.8 DATTO
             12.3.9 DXC TECHNOLOGY
             12.3.10 EVOLVE IP
             12.3.11 EXPEDIENT
             12.3.12 FLEXENTIAL
             12.3.13 NTT DATA
             12.3.14 QUORUM
             12.3.15 UNITRENDS
     12.4 SMES/STARTUPS 
             12.4.1 ARCSERVE
             12.4.2 RACKWARE
             12.4.3 DRUVA
             12.4.4 APTUM
             12.4.5 DARZ
             12.4.6 ZETTAGRID
             12.4.7 PHOENIXNAP
             12.4.8 COHESITY
             12.4.9 ASSURESTOR LIMITED
             12.4.10 HYSTAX
*Details on Business Overview, Products/Solutions/Services Offered, Recent Developments, MnM view (Key strengths/Right to win, Strategic choices made, Weakness/competitive threats)* might not be captured in case of unlisted companies.
 
13 ADJACENT/RELATED MARKETS (Page No. - 241)
     13.1 INTRODUCTION 
             13.1.1 RELATED MARKETS
             13.1.2 LIMITATIONS
     13.2 CLOUD COMPUTING MARKET 
               TABLE 214 CLOUD COMPUTING MARKET, BY VERTICAL, 2017–2021 (USD BILLION)
               TABLE 215 CLOUD COMPUTING MARKET, BY VERTICAL, 2022–2027 (USD BILLION)
     13.3 CLOUD STORAGE MARKET 
               TABLE 216 CLOUD STORAGE MARKET, BY REGION, 2018–2021 (USD MILLION)
               TABLE 217 CLOUD STORAGE MARKET, BY REGION, 2022–2027 (USD MILLION)
 
14 APPENDIX (Page No. - 244)
     14.1 DISCUSSION GUIDE 
     14.2 KNOWLEDGESTORE: MARKETSANDMARKETS’ SUBSCRIPTION PORTAL 
     14.3 CUSTOMIZATION OPTIONS 
     14.4 RELATED REPORTS 
     14.5 AUTHOR DETAILS 

This research study involved extensive secondary sources, directories, and paid databases to identify and collect information useful for this technical, market-oriented, and commercial study of the DRaaS market. In-depth interviews were conducted with various primary respondents, including key industry participants, subject matter experts, C-level executives of key market players, and industry consultants, to obtain and verify critical qualitative and quantitative information and assess the market prospects. The following figure highlights the market research methodology in developing this report on the DRaaS market.

Secondary Research

The market size of companies offering DRaaS was based on the secondary data available through paid and unpaid sources and by analyzing the product portfolios of major companies in the ecosystem and rating the companies based on their product capabilities and business strategies. In the secondary research process, various sources were referred to for identifying and collecting information for the study. The secondary sources included annual reports, press releases, investor presentations of companies, product data sheets, white papers, journals, certified publications, articles from recognized authors, government websites, directories, and databases.

Secondary research was mainly used to obtain key information about the industry’s supply chain, the total pool of key players, market classification and segmentation according to industry trends to the bottom-most level, regional markets, and key developments from both market- and technology-oriented perspectives, all of which were further validated by primary sources.

Primary Research

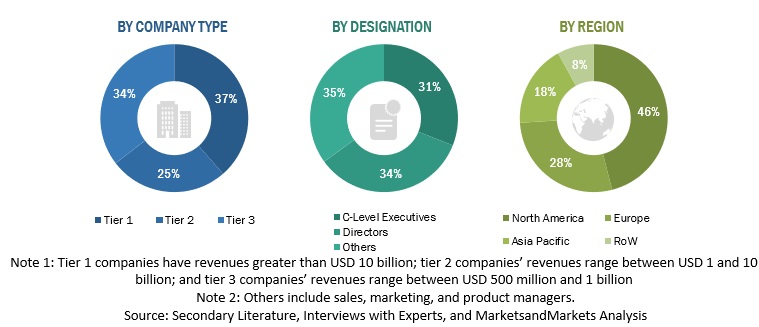
In the primary research process, various primary sources from both the supply and demand sides were interviewed to obtain qualitative and quantitative information on the market. The primary sources from the supply side included various industry experts, including Chief Experience Officers (CXOs); Vice Presidents (VPs); directors from business development, marketing, and product development/innovation teams; and related key executives from DRaaS vendors, industry associations, independent consultants, and key opinion leaders.

Primary interviews were conducted to gather insights, such as market statistics, the latest trends disrupting the market, new use cases implemented, data on revenue collected from products and services, market breakups, market size estimations, market forecasts, and data triangulation. Primary research also helped in understanding various trends related to technology, service type, deployment, and region. Stakeholders from the demand side, such as Chief Information Officers (CIOs), Chief Technology Officers (CTOs), Chief Security Officers (CSOs), the installation teams of governments/end users using DRaaS, and digital initiatives project teams, were interviewed to understand the buyer’s perspective on suppliers, products, service providers, and their current use of solutions, which would affect the overall DRaaS market.

The Breakup of Primary Profiles:
Disaster Recovery as a Service (DRaaS) Market Size, and Share

To know about the assumptions considered for the study, download the pdf brochure

Market Size Estimation

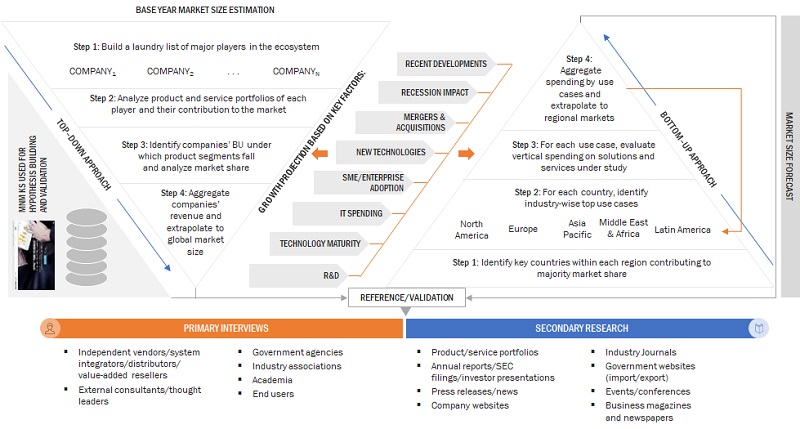
Both top-down and bottom-up approaches were used to estimate and forecast the DRaaS market and other dependent submarkets. The bottom-up procedure was deployed to arrive at the overall market size using the revenues and offerings of the key companies in the market. With data triangulation methods and validation through primary interviews, this study determined and confirmed the exact value of the overall parent market size. The overall market size was then used in the top-down procedure to estimate the size of other individual markets via percentage splits of the market segments.

Top Down and Bottom Up Approach of the DRaaS market.
Disaster Recovery as a Service (DRaaS) Market Size, and Share

To know about the assumptions considered for the study, Request for Free Sample Report

The top-down and bottom-up approaches were used to estimate and validate the size of the DRaaS market and various other dependent subsegments. The research methodology used to estimate the market size included the following:

Key players in the market were identified through secondary research, and their revenue contributions in respective countries were determined through primary and secondary research.

This entire procedure included the study of the annual and financial reports of top market players and extensive interviews for key insights from industry leaders, such as Chief Executive Officers (CEOs), VPs, directors, and marketing executives.

All percentage splits and breakups were determined using secondary sources and verified through primary sources.

Top Down Approach of DRaaS market.

Disaster Recovery as a Service (DRaaS) Market Size, and Share

Data Triangulation

After arriving at the overall market size, the market was split into several segments and subsegments—using the market size estimation processes as explained above. Where applicable, data triangulation and market breakdown procedures were employed to complete the overall market engineering process and determine each market segment's and subsegment's exact statistics. The data was triangulated by studying various factors and trends from government agencies’ demand and supply sides.

Market Definition

DRaaS refers to a cloud model that enables replicating enterprise data and applications on a third-party virtual or cloud environment to ensure business continuity during artificial or natural disasters. It is mainly facilitated by System Integrators (SIs) and Managed Service Providers (MSPs). DRaaS is based on three crucial aspects: disaster planning/management, business continuity, and backup.

Key Stakeholders

  • Cloud service providers (CSPs)
  • Colocation providers
  • Technology service providers
  • Data center managed service providers
  • Government organizations
  • Networking companies
  • Consultants/consultancies/advisory firms
  • Support and maintenance service providers
  • Telecom service providers
  • Information Technology (IT) infrastructure providers
  • System Integrators (SIs)
  • Regional associations
  • Independent software vendors
  • Value-added resellers and distributors

Report Objectives

  • To describe and forecast the global Disaster Recovery as a Service (DRaaS) market based on service types, deployment modes, organization size, verticals, and regions
  • To forecast the market size of the five major regional segments: North America, Europe, Asia Pacific (APAC), Middle East & Africa (MEA), and Latin America
  • To strategically analyze the market subsegments with respect to individual growth trends, prospects, and contributions to the total market
  • To provide detailed information related to the major factors influencing the growth of the market (drivers, restraints, opportunities, and challenges)
  • To strategically analyze macro and micro markets with respect to growth trends, prospects, and their contributions to the overall market
  • To analyze industry trends, patents & innovations, and pricing data related to the DRaaS market
  • To analyze the impact of recession impact on service types, deployment modes, organization size, verticals, and regions across the globe
  • To analyze the opportunities in the market for stakeholders and provide details of the competitive landscape for major players
  • To profile key players in the market and comprehensively analyze their market share/ranking and core competencies
  • To track and analyze competitive developments, such as mergers and acquisitions, new product developments, and partnerships and collaborations in the market

Available Customizations

With the given market data, MarketsandMarkets offers customizations per the company’s specific needs. The following customization options are available for the report:

Product Analysis

  • The product matrix provides a detailed comparison of the product portfolio of each company.

Geographic Analysis

  • Further breakup of the DRaaS market

Company Information

  • Detailed analysis and profiling of five additional market players
Custom Market Research Services

We will customize the research for you, in case the report listed above does not meet with your exact requirements. Our custom research will comprehensively cover the business information you require to help you arrive at strategic and profitable business decisions.

Request Customization

Instant Answers with GPT - Ask Now!

Ask real questions. Get complete answers !
Report Code
TC 3490
Published ON
Sep, 2023
Choose License Type
BUY NOW
  • SHARE
X
Request Customization
Speak to Analyst
Speak to Analyst
OR FACE-TO-FACE MEETING
PERSONALIZE THIS RESEARCH
  • Triangulate with your Own Data
  • Get Data as per your Format and Definition
  • Gain a Deeper Dive on a Specific Application, Geography, Customer or Competitor
  • Any level of Personalization
REQUEST A FREE CUSTOMIZATION
LET US HELP YOU!
  • What are the Known and Unknown Adjacencies Impacting the Disaster Recovery as a Service (DRaaS) Market
  • What will your New Revenue Sources be?
  • Who will be your Top Customer; what will make them switch?
  • Defend your Market Share or Win Competitors
  • Get a Scorecard for Target Partners
CUSTOMIZED WORKSHOP REQUEST
+1-888-600-6441
  • Call Us
  • +1-888-600-6441 (Corporate office hours)
  • +1-888-600-6441 (US/Can toll free)
  • +44-800-368-9399 (UK office hours)
CONNECT WITH US
ABOUT TRUST ONLINE
©2024 MarketsandMarkets Research Private Ltd. All rights reserved
DMCA.com Protection Status Website Feedback