Retail Analytics Market

Retail Analytics Market by Offering (Software, Services), Business Function (Sales and Marketing, Finance and Accounting), Application (Order Fulfillment and Returns Management, Merchandize Planning), End User and Region - Global Forecast to 2029

Report Code: TC 2663 Mar, 2024, by marketsandmarkets.com

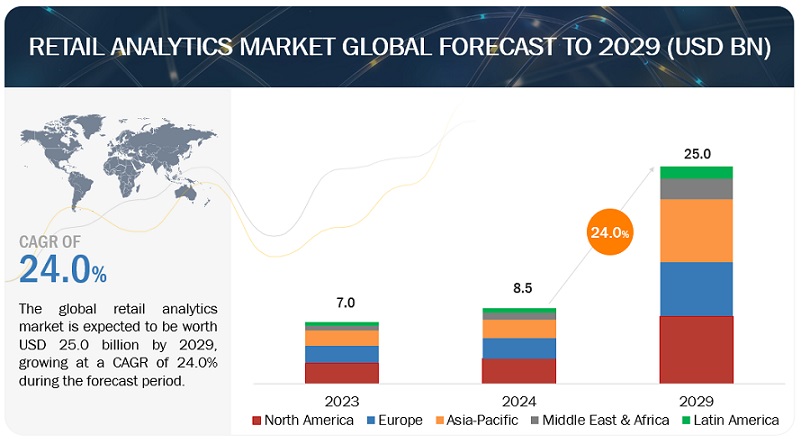
[317 Pages Report] The global Retail Analytics Market size is projected to grow from USD 8.5 billion in 2024 to USD 25.0 billion by 2029, at a compound annual growth rate (CAGR) of 24.0% during the forecast period. Due to various business drivers, the retail analytics market is expected to grow significantly during the forecast period. The market is experiencing significant growth due to the proliferation of data generated through diverse channels. Exponential growth of e-commerce platforms, and increasing adoption of omnichannel retail strategies are also responsible for driving the market’s growth.
Retail Analytics Market

To know about the assumptions considered for the study, Request for Free Sample Report
Retail Analytics Market Opportunities

To know about the assumptions considered for the study, download the pdf brochure

Market Dynamics

Driver: Exponential growth of e-commerce platforms

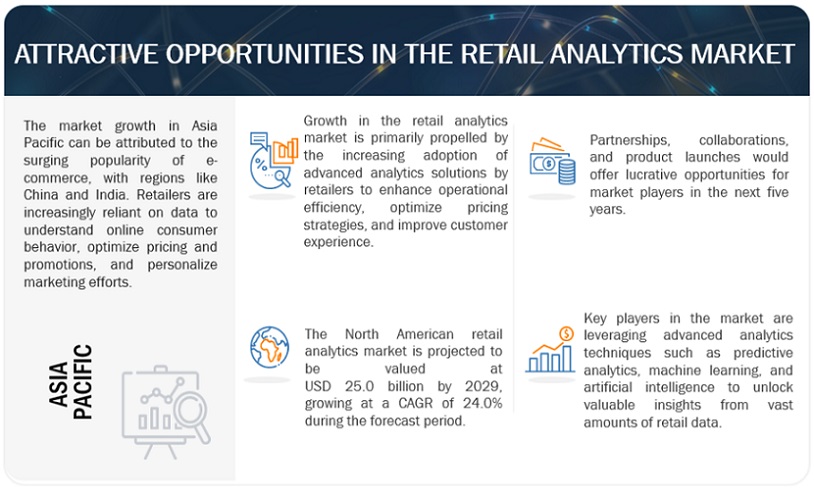
The exponential growth of e-commerce platforms has profoundly impacted the retail analytics market, presenting a wealth of opportunities for retailers to leverage data-driven insights for strategic decision-making and operational optimization. With the increasing prevalence of online shopping, fueled by factors such as convenience, broader product selection, and competitive pricing, e-commerce platforms have become a dominant force in the retail landscape. This surge in online transactions generates vast amounts of data, ranging from customer demographics and browsing behavior to purchase history and feedback, providing retailers with rich sources of information to analyze. Retail analytics solutions play a pivotal role in helping retailers extract actionable insights from this data, enabling them to understand consumer preferences, identify trends, forecast demand, optimize pricing and promotions, personalize marketing campaigns, and enhance the overall customer experience. As e-commerce continues to expand globally, driven by technological advancements, changing consumer behaviors, and market dynamics, the demand for sophisticated retail analytics tools and services is expected to skyrocket, creating lucrative opportunities for vendors in the retail analytics market to innovate and cater to the evolving needs of retailers in the digital age.

Restraints: Rising integration challenges with legacy systems due to diverse data sources

One of the foremost restraints encountered is the rising integration complexity stemming from the coexistence of diverse data sources and the prevalence of legacy systems within retail infrastructures. As retailers strive to harness the power of data analytics to gain insights into consumer behavior, market trends, and operational efficiencies, they often grapple with the integration of disparate data streams originating from various sources such as point-of-sale (POS) systems, e-commerce platforms, customer relationship management (CRM) tools, and social media channels. These data sources may employ distinct formats, structures, and protocols, posing significant hurdles to seamless integration with existing legacy systems. The integration challenge exacerbates further due to the presence of legacy systems within many retail organizations. These legacy systems, characterized by their long-standing usage and historical significance, often lack the flexibility and compatibility required to efficiently incorporate and process data from modern sources. Attempts to integrate diverse data streams with legacy systems frequently encounter compatibility issues, data inconsistency, and processing bottlenecks, impeding the real-time analysis and utilization of critical insights. Consequently, retail enterprises face mounting pressure to modernize their data infrastructure and streamline integration processes to extract maximum value from their data assets.

Addressing the integration challenges posed by diverse data sources and legacy systems necessitates a multifaceted approach involving technological innovation, strategic planning, and organizational restructuring. Retailers increasingly seek solutions that offer seamless integration capabilities, scalability, and adaptability to accommodate evolving data landscapes. Leveraging advanced analytics platforms equipped with robust integration frameworks, retailers can consolidate data from disparate sources, standardize formats, and facilitate interoperability with legacy systems.

Opportunity: Integration of AI and ML with retail analytics will create new opportunities for innovation

AI and ML technologies offer retailers the ability to analyze vast amounts of data with unprecedented accuracy and efficiency, enabling them to gain deeper insights into consumer behavior, preferences, and trends. By leveraging AI and ML algorithms, retailers can extract valuable insights from diverse data sources such as transaction records, customer demographics, social media interactions, and even sensor data from physical stores. One of the key advantages of integrating AI and ML with retail analytics is the ability to personalize the shopping experience for individual consumers. These technologies enable retailers to create highly targeted marketing campaigns, tailored product recommendations, and personalized promotions based on each customer's unique preferences and purchasing history. By delivering personalized experiences, retailers can enhance customer satisfaction, loyalty, and ultimately drive sales and revenue growth. Additionally, AI-powered analytics can help retailers optimize pricing strategies, inventory management, and supply chain operations to maximize efficiency and profitability.

Furthermore, the integration of AI and ML with retail analytics opens up new avenues for innovation in areas such as predictive analytics, demand forecasting, and trend analysis. Retailers can use advanced predictive models to anticipate future consumer trends, identify emerging market opportunities, and optimize product assortments accordingly.

Challenge: Complexity of assortment in the retail analytics

Assortment complexity refers to the vast array of products offered by retailers, each with varying attributes such as size, color, style, and price point. Retailers must carefully curate their product assortments to meet the diverse needs and preferences of their target customers while balancing factors like shelf space, inventory costs, and seasonal demand fluctuations. Managing this complexity effectively requires sophisticated analytics solutions capable of analyzing large volumes of data to identify trends, patterns, and insights that can inform assortment decisions. The complexity of assortment management is further compounded by the dynamic nature of consumer preferences and market trends. Consumer tastes and preferences can change rapidly in response to factors such as changing demographics, cultural shifts, and emerging fashion trends. Retailers must continuously monitor market trends, gather customer feedback, and adapt their assortments accordingly to remain competitive. However, keeping pace with these changes and effectively predicting future trends requires advanced analytics capabilities that can process real-time data and generate actionable insights in a timely manner. Moreover, the proliferation of sales channels and the rise of omnichannel retailing add another layer of complexity to assortment management. With consumers increasingly shopping across multiple channels, including online, mobile, and brick-and-mortar stores, retailers must ensure consistency and coherence across all channels while optimizing assortments to meet the unique characteristics and preferences of each channel's customer base. This requires retailers to integrate data from disparate sources, such as point-of-sale systems, e-commerce platforms, and customer loyalty programs, to gain a holistic view of consumer behavior and preferences across channels and make informed assortment decisions that drive sales and customer satisfaction.

Retail Analytics market ecosystem
Top Companies in Retail Analytics Market

By professional services, the Support & Maintenance segment registered the highest CAGR during the forecast period.

As retailers increasingly rely on data-driven insights to enhance operations and customer experiences, support services become indispensable for addressing technical issues, troubleshooting, and providing timely assistance to users. Maintenance services encompass regular updates, patches, and performance optimizations to uphold system integrity and functionality. These services are crucial for minimizing downtime, maximizing system efficiency, and safeguarding against potential disruptions that could impact business operations. Moreover, support and maintenance providers often offer training and knowledge transfer sessions to empower retail teams in harnessing the full potential of analytical tools and technologies.

By application, Price Recommendation & Optimization segment to register the highest CAGR during the forecast period.

The demand for price recommendation and optimization applications is at an all-time high. These sophisticated tools leverage advanced analytics and machine learning algorithms to analyze vast amounts of data, including historical sales data, competitor pricing, market trends, and customer behavior. By doing so, they empower retailers to make data-driven pricing decisions that maximize profitability while remaining competitive in the market. These applications offer real-time insights and recommendations, enabling retailers to adjust prices dynamically based on factors such as demand fluctuations, inventory levels, and promotional effectiveness.

By end user by product type, Industry segment register the highest CAGR during the forecast period.

In the ever-evolving landscape of retail analytics, industrial product types play a pivotal role in shaping market dynamics. These products, ranging from machinery and equipment to raw materials and components, form the backbone of various industries. Retail analytics solutions tailored for industrial product types provide invaluable insights into inventory management, pricing strategies, and market trends. By harnessing data analytics technologies, businesses can identify patterns, forecast demand, and make informed decisions to stay competitive in a rapidly changing market.

By region,  North America to witness the largest market size during the forecast period.

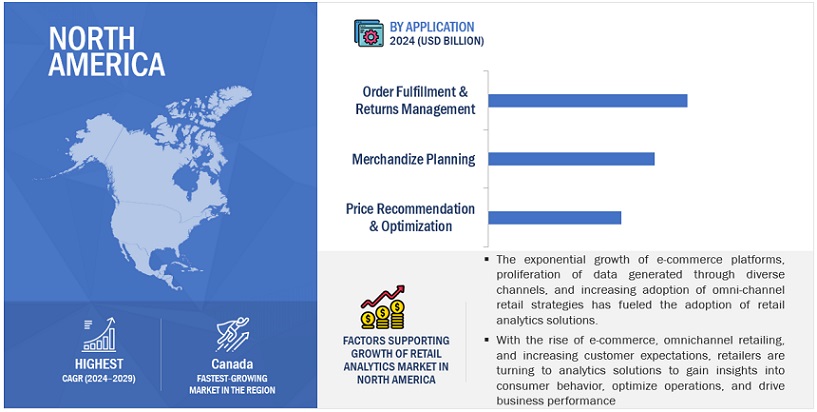
With the rise of e-commerce, omnichannel retailing, and increasing customer expectations, retailers are turning to analytics solutions to gain insights into consumer behavior, optimize operations, and drive business performance. From large retailers to small businesses, there's a growing recognition of the importance of data-driven decision-making in staying competitive in today's market. Key trends in the North American retail analytics market include the adoption of advanced technologies like artificial intelligence and machine learning to enhance predictive analytics capabilities, the integration of data from multiple sources for a holistic view of the customer journey, and the emphasis on real-time analytics for timely insights and actions.
North American Retail Analytics Market Size, and Share

Key Market Players

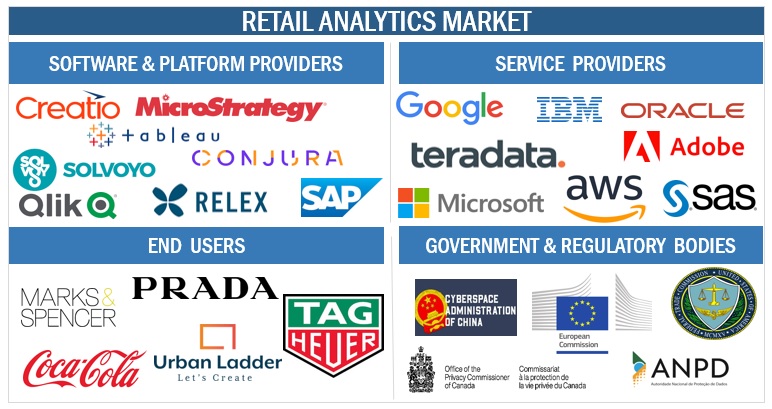
The retail analytics solution and service providers have implemented various types of organic and inorganic growth strategies, such as product upgrades, new product launches, partnerships, and agreements, business expansions, and mergers and acquisitions to strengthen their offerings in the market. Some major players in the retail analytics market include Microsoft (US), IBM (US), SAP (Germany), Oracle (US), Salesforce (US), MicroStrategy (US), SAS Institute (US), AWS (US), Qlik (US), Teradata (US), WNS (India), HCL (India), Lightspeed Commerce (Canada), RetailNext (US), Manthan Systems (India), Fit Analytics (Germany), Trax (Singapore), ThoughtSpot (US), RELEX Solutions (Finland), Tredence (US), Creatio (US), Solvoyo (US), datapine (Germany), Sisense (US), EDITED (UK), Retail Zipline (US), ThinkINside (Italy), Dor Technologies (US), Triple Whale (Israel), Flame Analytics (Spain), Alloy.ai Technologies (US), Conjura (UK), Kyvos Insights (US), Pygmalion (Slovakia), and SymphonyAI (US).

Get online access to the report on the World's First Market Intelligence Cloud

  • Easy to Download Historical Data & Forecast Numbers
  • Company Analysis Dashboard for high growth potential opportunities
  • Research Analyst Access for customization & queries
  • Competitor Analysis with Interactive dashboard
  • Latest News, Updates & Trend analysis
Request Sample

Scope of the Report

Report Metrics

Details

Market size available for years

2019–2029

Base year considered

2023

Forecast period

2024–2029

Forecast units

USD (Billion)

Segments Covered

Offering, Business Function, Application, End User, and Region

Geographies covered

North America, Asia Pacific, Europe, Middle East & Africa, and Latin America

Companies covered

Microsoft (US), IBM (US), SAP (Germany), Oracle (US), Salesforce (US), MicroStrategy (US), SAS Institute (US), AWS (US), Qlik (US), Teradata (US), WNS (India), HCL (India), Lightspeed Commerce (Canada), RetailNext (US), Manthan Systems (India), Fit Analytics (Germany), Trax (Singapore), ThoughtSpot (US), RELEX Solutions (Finland), Tredence (US), Creatio (US), Solvoyo (US), datapine (Germany), Sisense (US), EDITED (UK), Retail Zipline (US), ThinkINside (Italy), Dor Technologies (US), Triple Whale (Israel), Flame Analytics (Spain), Alloy.ai Technologies (US), Conjura (UK), Kyvos Insights (US), Pygmalios (Slovakia), and SymphonyAI (US)

This research report categorizes the retail analytics market based on offering, business function, application, end user, and region.

By Offering:
  • Software by Analytics Type
    • Descriptive Analytics
    • Diagnostic Analytics
    • Predictive Analytics
    • Prescriptive Analytics
  • Software by Deployment Mode
    • Cloud
    • On-premise
  • Services
    • Consulting & Advisory
    • Integration & Deployment
    • Support & Maintenance
    • Training & Education
By Business Function:
  • Sales & Marketing
  • Operations & Supply Chain
  • Finance & Accounting
  • HR
By Application:
  • Order Fulfillment & Returns Management
    • Order Processing & Packaging
    • Shipping & Transportation
    • Returns Processing
    • Payment Processing
  • Customer Relationship Management
    • Customer Segmentation
    • Revenue Optimization
    • Customer Retention
    • Predictive Modeling
  • Price Recommendation & Optimization
    • Prsonalised Pricing
    • Real-Time Price Adjustment
    • Price Optimization Strategy
  • Merchandise Planning
    • Demand Sensing & Forecasting
    • Trend Analysis
    • Assortment Planning
  • Supply Chain Management
    • Contract Management
    • Vendor Management
    • Work Order Management
    • Invoice Management
  • Fraud Detection & Prevention
    • Point-Of-Sale (Pos) Verification
    • Product Counterfeit Management
    • Root Cause Analysis
    • Risk Assessment & Complaince Management
  • Other Applications (Store Performance Monitoring Management And Brand Management)
By End User:
  • End User by Product Type
    • Industry
    • Consumer
  • End User by Channel
    • Online
    • Offline
By Region:
  • North America
    • US
    • Canada
  • Europe
    • UK
    • Germany
    • France
    • Italy
    • Spain
    • Rest of Europe
  • Asia Pacific
    • China
    • India
    • Japan
    • Australia and New Zealand (ANZ)
    • South Korea
    • ASEAN Countries
    • Rest of Asia Pacific
  • Middle East & Africa
    • UAE
    • Saudi Arabia
    • South Africa
    • Turkey
    • Egypt
    • Rest of the Middle East & Africa
  • Latin America
    • Brazil
    • Mexico
    • Argentina
    • Rest of Latin America

Recent Developments:

  • In February 2024, IBM announced the availability of the popular open-source Mixtral-8x7B large language model (LLM), developed by Mistral AI, on its Watsonx AI and data platform, as it continues to expand capabilities to help clients innovate with IBM's own foundation models and those from a range of open-source providers.
  • In January 2024, IBM announced its collaboration with SAP to develop solutions to help clients in the consumer-packaged goods and retail industries enhance their supply chain, finance operations, sales and services using generative AI.
  • In January 2024, Salesforce announced the availability of Einstein 1 Studio, a set of low-code tools that enables Salesforce admins and developers to customize Einstein Copilot and seamlessly embed AI across any app for every customer and employee experience.
  • In November 2023, MicroStrategy announced the availability of MicroStrategy ONE in the AWS Marketplace. By bringing together MicroStrategy's powerful generative artificial intelligence (AI) capabilities for business intelligence (BI) and the scalability and reliability of Amazon Web Services (AWS), customers can now access a ready solution for deploying trusted AI at scale for analytics.
  • In September 2023, Oracle showcased new AI-powered capabilities within Oracle Analytics Cloud. Leveraging the Oracle Cloud Infrastructure (OCI) Generative AI service, the new capabilities assist analytics self-service users to conduct sophisticated analysis and make better business decisions without having to wait for data scientists or IT teams more quickly and efficiently.

Frequently Asked Questions (FAQ):

To speak to our analyst for a discussion on the above findings, click Speak to Analyst

TABLE OF CONTENTS
 
1 INTRODUCTION (Page No. - 47)
    1.1 STUDY OBJECTIVES 
    1.2 MARKET DEFINITION 
           1.2.1 INCLUSIONS AND EXCLUSIONS
    1.3 RETAIL ANALYTICS MARKET SCOPE 
           1.3.1 MARKET SEGMENTATION
                    FIGURE 1 MARKET SEGMENTATION
                    TABLE 1 MARKET DETAILED SEGMENTATION
           1.3.2 REGIONS COVERED
                    FIGURE 2 REGIONAL SEGMENTATION
           1.3.3 YEARS CONSIDERED
    1.4 CURRENCY CONSIDERED 
           TABLE 2 USD EXCHANGE RATES, 2019–2023
    1.5 STAKEHOLDERS 
    1.6 SUMMARY OF CHANGES 
           1.6.1 RECESSION IMPACT
 
2 RESEARCH METHODOLOGY (Page No. - 53)
    2.1 RESEARCH DATA 
           FIGURE 3 MARKET: RESEARCH DESIGN
           2.1.1 SECONDARY DATA
           2.1.2 PRIMARY DATA
                    TABLE 3 PRIMARY INTERVIEWS
                    2.1.2.1 Breakup of primary profiles
                               FIGURE 4 BREAKUP OF PRIMARY PROFILES, BY COMPANY TYPE, DESIGNATION, AND REGION
                    2.1.2.2 Key industry insights
                               FIGURE 5 KEY INDUSTRY INSIGHTS FROM EXPERTS
    2.2 RETAIL ANALYTICS MARKET SIZE ESTIMATION 
           FIGURE 6 RETAIL ANALYTICS MARKET: TOP-DOWN AND BOTTOM-UP APPROACHES
           2.2.1 TOP-DOWN APPROACH
           2.2.2 BOTTOM-UP APPROACH
                    FIGURE 7 APPROACH 1 (BOTTOM-UP; SUPPLY-SIDE): REVENUE FROM SOFTWARE/SERVICE VENDORS OF RETAIL ANALYTICS
                    FIGURE 8 APPROACH 2 (BOTTOM-UP; SUPPLY-SIDE): COLLECTIVE REVENUE FROM ALL SOFTWARE/SERVICES OF RETAIL ANALYTICS MARKET
                    FIGURE 9 APPROACH 3 (BOTTOM-UP; SUPPLY-SIDE): RETAIL ANALYTICS MARKET ESTIMATION AND CORRESPONDING SOURCES
                    FIGURE 10 APPROACH 4 (BOTTOM-UP; DEMAND-SIDE): SHARE OF OFFERINGS THROUGH OVERALL RETAIL ANALYTICS SPENDING
    2.3 MARKET FORECAST 
           TABLE 4 FACTOR ANALYSIS
    2.4 DATA TRIANGULATION 
           FIGURE 11 DATA TRIANGULATION
    2.5 RESEARCH ASSUMPTIONS 
    2.6 RISK ASSESSMENT 
    2.7 STUDY LIMITATIONS 
    2.8 IMPLICATIONS OF RECESSION ON RETAIL ANALYTICS MARKET 
           TABLE 5 IMPACT OF RECESSION ON MARKET
 
3 EXECUTIVE SUMMARY (Page No. - 66)
    TABLE 6 GLOBAL RETAIL ANALYTICS MARKET SIZE AND GROWTH RATE,  2019–2023 (USD MILLION, Y-O-Y %) 
    TABLE 7 GLOBAL MARKET SIZE AND GROWTH RATE,  2024–2029 (USD MILLION, Y-O-Y %) 
    FIGURE 12 SOFTWARE SEGMENT TO DOMINATE MARKET IN 2024 
    FIGURE 13 PREDICTIVE ANALYTICS TO HOLD LARGEST MARKET SHARE IN 2024 
    FIGURE 14 ON-PREMISES SEGMENT TO DOMINATE MARKET IN 2024 
    FIGURE 15 PROFESSIONAL SERVICES TO DOMINATE MARKET IN 2024 
    FIGURE 16 INTEGRATION & DEPLOYMENT SEGMENT TO DOMINATE MARKET IN 2024 
    FIGURE 17 SALES & MARKETING TO HOLD LARGEST MARKET SHARE IN 2024 
    FIGURE 18 ORDER FULFILLMENT & RETURNS MANAGEMENT SEGMENT TO DOMINATE MARKET IN 2024 
    FIGURE 19 CONSUMER END USER SEGMENT TO HOLD LARGER SHARE IN 2024 
    FIGURE 20 RAW MATERIALS INDUSTRIAL END USER SEGMENT TO DOMINATE MARKET IN 2024 
    FIGURE 21 CONVENIENCE GOODS CONSUMER END USER SEGMENT TO HOLD LARGEST MARKET SHARE IN 2024 
    FIGURE 22 ONLINE CHANNEL SEGMENT TO DOMINATE MARKET IN 2024 
    FIGURE 23 ASIA PACIFIC TO GROW AT HIGHEST CAGR DURING FORECAST PERIOD 
 
4 PREMIUM INSIGHTS (Page No. - 73)
    4.1 ATTRACTIVE OPPORTUNITIES IN MARKET 
           FIGURE 24 EXPONENTIAL GROWTH OF E-COMMERCE PLATFORMS AND PROLIFERATION OF DATA GENERATED THROUGH DIVERSE CHANNELS TO DRIVE MARKET GROWTH
    4.2 MARKET: TOP THREE APPLICATIONS 
           FIGURE 25 PRICE RECOMMENDATIONS & OPTIMIZATION SEGMENT TO GROW AT HIGHEST CAGR DURING FORECAST PERIOD
    4.3 NORTH AMERICA: MARKET, BY OFFERING AND END USER CHANNEL 
           FIGURE 26 SOFTWARE SEGMENT AND ONLINE END USER SEGMENT TO HOLD LARGEST MARKET SHARES IN NORTH AMERICA IN 2024
    4.4 MARKET, BY REGION 
           FIGURE 27 NORTH AMERICA TO HOLD LARGEST MARKET SHARE IN 2024
 
5 RETAIL ANALYTICS MARKET OVERVIEW AND INDUSTRY TRENDS (Page No. - 75)
    5.1 INTRODUCTION 
    5.2 MARKET DYNAMICS 
           FIGURE 28 MARKET: DRIVERS, RESTRAINTS, OPPORTUNITIES, AND CHALLENGES
           5.2.1 DRIVERS
                    5.2.1.1 Exponential growth of ecommerce platforms
                               FIGURE 29 GLOBAL RETAIL ECOMMERCE SALES, 2014–2021 (USD TRILLION)
                    5.2.1.2 Proliferation of data generated through diverse channels
                               FIGURE 30 MOST VISITED ONLINE RETAIL WEBSITES WORLDWIDE, BY MONTHLY TRAFFIC, 2022
                    5.2.1.3 Increase in adoption of omnichannel retail strategies
           5.2.2 RESTRAINTS
                    5.2.2.1 Rise in integration challenges with legacy systems due to diverse data sources
                    5.2.2.2 Heightened cybersecurity threats and data breaches undermine trust in analytics as solutions
                    5.2.2.3 High substantial upfront investment to be barrier for implementing robust analytics infrastructure
           5.2.3 OPPORTUNITIES
                    5.2.3.1 Integration of AI and ML with retail analytics
                    5.2.3.2 Effective fraud detection and prevention with retail analytics
                               FIGURE 31 GLOBAL LOSSES DUE TO ECOMMERCE PAYMENT FRAUD,  2020–2023 (USD BILLION)
                    5.2.3.3 Optimization of supply chain management
           5.2.4 CHALLENGES
                    5.2.4.1 Complexity of assortment in retail analytics
                    5.2.4.2 Data silos and quality concerns
    5.3 EVOLUTION OF MARKET 
           FIGURE 32 RETAIL ANALYTICS MARKET: EVOLUTION
    5.4 MARKET ARCHITECTURE 
           FIGURE 33 MARKET: ARCHITECTURE
    5.5 VALUE/SUPPLY CHAIN ANALYSIS 
           FIGURE 34 MARKET: VALUE/SUPPLY CHAIN ANALYSIS
    5.6 ECOSYSTEM ANALYSIS/MARKET MAP 
           TABLE 8 MARKET: ECOSYSTEM
           FIGURE 35 MARKET MAP: KEY PLAYERS
           5.6.1 MARKET: PLATFORM PROVIDERS
           5.6.2 MARKET: SOFTWARE PROVIDERS
           5.6.3 MARKET: SERVICE PROVIDERS
           5.6.4 MARKET: CLOUD SERVICE PROVIDERS
           5.6.5 MARKET: END USERS
           5.6.6 MARKET: REGULATORY BODIES
    5.7 CASE STUDY ANALYSIS 
           5.7.1 TAG HEUER ENHANCED ITS ONLINE PURCHASING JOURNEY WORKING WITH IBM IX CONSULTANTS
           5.7.2 MICROSOFT 365 DIGITAL TOOLS STREAMLINED MARKS & SPENCER’S ADMINISTRATIVE ACTIVITY OVERVIEW
           5.7.3 ORACLE ELEVATED CUSTOMER EXPERIENCE FOR PRADA GROUP BY IMPLEMENTING CLOUD-BASED RETAIL SOLUTIONS
           5.7.4 RELIABILITY OF SAP ENABLED IP WORKFLOWS FOR SANSIBAR
           5.7.5 URBAN LADDER PROVIDED MORE PERSONALIZED AND PROACTIVE SERVICE WITH HELP OF SALESFORCE
    5.8 TECHNOLOGY ANALYSIS 
           5.8.1 KEY TECHNOLOGIES
                    5.8.1.1 AI/ML
                    5.8.1.2 Big Data
                    5.8.1.3 IoT
                    5.8.1.4 Cloud Computing
           5.8.2 COMPLEMENTARY TECHNOLOGIES
                    5.8.2.1 AR/VR
                    5.8.2.2 Blockchain
                    5.8.2.3 NLP
           5.8.3 ADJACENT TECHNOLOGIES
                    5.8.3.1 3D Printing
                    5.8.3.2 Biometric Authentication
                    5.8.3.3 Edge Computing
                    5.8.3.4 RPA
    5.9 REGULATORY LANDSCAPE 
           5.9.1 REGULATORY LANDSCAPE
           5.9.2 REGULATORY BODIES, GOVERNMENT AGENCIES, AND OTHER ORGANIZATIONS
                    TABLE 9 NORTH AMERICA: LIST OF REGULATORY BODIES, GOVERNMENT AGENCIES, AND OTHER ORGANIZATIONS
                    TABLE 10 EUROPE: LIST OF REGULATORY BODIES, GOVERNMENT AGENCIES, AND OTHER ORGANIZATIONS
                    TABLE 11 ASIA PACIFIC: LIST OF REGULATORY BODIES, GOVERNMENT AGENCIES, AND OTHER ORGANIZATIONS
                    TABLE 12 MIDDLE EAST & AFRICA: LIST OF REGULATORY BODIES, GOVERNMENT AGENCIES, AND OTHER ORGANIZATIONS
                    TABLE 13 LATIN AMERICA: LIST OF REGULATORY BODIES, GOVERNMENT AGENCIES, AND OTHER ORGANIZATIONS
           5.9.3 PERTINENT REGULATIONS
                    5.9.3.1 North America
                               5.9.3.1.1 General Data Protection Regulation (GDPR)
                               5.9.3.1.2 California Consumer Privacy Act (CCPA)
                               5.9.3.1.3 Fair Credit Reporting Act (FCRA)
                    5.9.3.2 Europe
                               5.9.3.2.1 General Data Protection Regulation (GDPR)
                               5.9.3.2.2 Payment Services Directive (PSD2)
                               5.9.3.2.3 ePrivacy directive
                    5.9.3.3 Asia Pacific
                               5.9.3.3.1 Personal Data Protection Acts (PDPA)
                               5.9.3.3.2 Consumer Protection Regulations
                    5.9.3.4 Middle East & Africa
                               5.9.3.4.1 UAE Data Protection Law
                               5.9.3.4.2 South Africa Protection of Personal Information Act (POPIA)
                    5.9.3.5 Latin America
                               5.9.3.5.1 General Data Protection Regulation (LGPD) - Brazil
    5.10 PATENT ANALYSIS 
           5.10.1 METHODOLOGY
           5.10.2 PATENTS FILED, BY DOCUMENT TYPE
                    TABLE 14 PATENTS FILED, 2013–2023
           5.10.3 INNOVATION AND PATENT APPLICATIONS
                    FIGURE 36 TOTAL NUMBER OF PATENTS GRANTED, 2013–2023
                    5.10.3.1 Top 10 patent applicants in MARKET
                    FIGURE 37 TOP 10 APPLICANTS IN MARKET, 2013–2023
                    TABLE 15 TOP 20 PATENT OWNERS IN MARKET, 2013–2023
                    TABLE 16 LIST OF PATENTS GRANTED IN MARKET, 2023
                    FIGURE 38 REGIONAL ANALYSIS OF PATENTS GRANTED, 2023
    5.11 PRICING ANALYSIS 
           5.11.1 AVERAGE SELLING PRICE TREND OF KEY PLAYERS, BY APPLICATION
                    FIGURE 39 AVERAGE SELLING PRICE TREND OF KEY PLAYERS, BY APPLICATION (USD/YEAR)
                    TABLE 17 AVERAGE SELLING PRICE TREND OF KEY PLAYERS, BY APPLICATION
           5.11.2 INDICATIVE PRICING ANALYSIS, BY OFFERING
                    TABLE 18 INDICATIVE PRICING LEVELS OF RETAIL ANALYTICS SOFTWARE, BY OFFERING
    5.12 KEY CONFERENCES AND EVENTS 
                    TABLE 19 RETAIL ANALYTICS MARKET: DETAILED LIST OF CONFERENCES AND EVENTS, 2024–2025
    5.13 PORTER’S FIVE FORCES ANALYSIS 
                    TABLE 20 PORTER’S FIVE FORCES IMPACT ON MARKET
                    FIGURE 40 PORTER’S FIVE FORCES ANALYSIS: MARKET
           5.13.1 THREAT FROM NEW ENTRANTS
           5.13.2 THREAT OF SUBSTITUTES
           5.13.3 BARGAINING POWER OF SUPPLIERS
           5.13.4 BARGAINING POWER OF BUYERS
           5.13.5 INTENSITY OF COMPETITIVE RIVALRY
    5.14 INVESTMENT LANDSCAPE AND FUNDING SCENARIO 
                    FIGURE 41 MARKET: INVESTMENT LANDSCAPE AND FUNDING SCENARIO (USD MILLION AND NUMBER OF FUNDING ROUNDS)
    5.15 RETAIL ANALYTICS BUSINESS MODELS 
           5.15.1 SOFTWARE-AS-A-SERVICE (SAAS) MODELS
           5.15.2 PERPETUAL LICENSING
           5.15.3 CUSTOM DEVELOPMENT
           5.15.4 CONSULTING AND PROFESSIONAL SERVICES
    5.16 TRENDS/DISRUPTIONS IMPACTING CUSTOMER’S BUSINESS 
                    FIGURE 42 TRENDS/DISRUPTIONS IMPACTING CUSTOMER’S BUSINESS
    5.17 KEY STAKEHOLDERS & BUYING CRITERIA 
           5.17.1 KEY STAKEHOLDERS IN BUYING PROCESS
                    FIGURE 43 INFLUENCE OF STAKEHOLDERS ON BUYING PROCESS FOR TOP THREE APPLICATIONS
                    TABLE 21 INFLUENCE OF STAKEHOLDERS ON BUYING PROCESS FOR TOP THREE APPLICATIONS
           5.17.2 BUYING CRITERIA
                    FIGURE 44 KEY BUYING CRITERIA FOR TOP THREE APPLICATIONS
                    TABLE 22 KEY BUYING CRITERIA FOR TOP THREE APPLICATIONS
 
6 RETAIL ANALYTICS MARKET, BY OFFERING (Page No. - 116)
    6.1 INTRODUCTION 
           6.1.1 OFFERING: MARKET DRIVERS
                    FIGURE 45 SERVICES SEGMENT TO GROW AT HIGHER CAGR DURING FORECAST PERIOD
                    TABLE 23 MARKET, BY OFFERING, 2019–2023 (USD MILLION)
                    TABLE 24 RETAIL ANALYTICS MARKET, BY OFFERING, 2024–2029 (USD MILLION)
    6.2 SOFTWARE 
           6.2.1 SOFTWARE BY ANALYTICS TYPE
                    FIGURE 46 PREDICTIVE ANALYTICS SEGMENT TO GROW AT HIGHER CAGR DURING FORECAST PERIOD
                    TABLE 25 RETAIL ANALYTICS SOFTWARE MARKET, BY REGION, 2019–2023 (USD MILLION)
                    TABLE 26 RETAIL ANALYTICS SOFTWARE MARKET, BY REGION, 2024–2029 (USD MILLION)
                    TABLE 27 RETAIL ANALYTICS SOFTWARE MARKET, BY ANALYTICS TYPE, 2019–2023 (USD MILLION)
                    TABLE 28 RETAIL ANALYTICS SOFTWARE MARKET, BY ANALYTICS TYPE, 2024–2029 (USD MILLION)
                    6.2.1.1 Descriptive Analytics
                               6.2.1.1.1 Descriptive analytics software to remain foundational component for retailers looking to gain actionable insights
                               TABLE 29 DESCRIPTIVE ANALYTICS SOFTWARE MARKET, BY REGION, 2019–2023 (USD MILLION)
                               TABLE 30 DESCRIPTIVE ANALYTICS SOFTWARE MARKET, BY REGION, 2024–2029 (USD MILLION)
                    6.2.1.2 Diagnostic Analytics
                               6.2.1.2.1 Retailers use diagnostic analytics software to analyze sales trends across different product categories
                               TABLE 31 DIAGNOSTIC ANALYTICS SOFTWARE MARKET, BY REGION, 2019–2023 (USD MILLION)
                               TABLE 32 DIAGNOSTIC ANALYTICS SOFTWARE MARKET, BY REGION, 2024–2029 (USD MILLION)
                    6.2.1.3 Predictive Analytics
                               6.2.1.3.1 Predictive analytics algorithms enabling retailers to anticipate future outcomes with high degree of accuracy
                               TABLE 33 PREDICTIVE ANALYTICS SOFTWARE MARKET, BY REGION, 2019–2023 (USD MILLION)
                               TABLE 34 PREDICTIVE ANALYTICS SOFTWARE MARKET, BY REGION, 2024–2029 (USD MILLION)
                    6.2.1.4 Prescriptive Analytics
                               6.2.1.4.1 Prescriptive analytics software to enable retailers to respond swiftly to changing market dynamics and customer preferences
                               TABLE 35 PRESCRIPTIVE ANALYTICS SOFTWARE MARKET, BY REGION, 2019–2023 (USD MILLION)
                               TABLE 36 PRESCRIPTIVE ANALYTICS SOFTWARE MARKET, BY REGION, 2024–2029 (USD MILLION)
           6.2.2 DEPLOYMENT MODE
                    FIGURE 47 CLOUD SEGMENT TO GROW AT HIGHER CAGR DURING FORECAST PERIOD
                    TABLE 37 RETAIL ANALYTICS SOFTWARE MARKET, BY DEPLOYMENT MODE,  2019–2023 (USD MILLION)
                    TABLE 38 RETAIL ANALYTICS SOFTWARE MARKET, BY DEPLOYMENT MODE,  2024–2029 (USD MILLION)
                    6.2.2.1 On-premises
                               6.2.2.1.1 On-premises deployment to offer retailers greater control over data processing and performance
                               TABLE 39 ON-PREMISES: RETAIL ANALYTICS SOFTWARE MARKET, BY REGION,  2019–2023 (USD MILLION)
                               TABLE 40 ON-PREMISES: RETAIL ANALYTICS SOFTWARE MARKET, BY REGION,  2024–2029 (USD MILLION)
                    6.2.2.2 Cloud
                               6.2.2.2.1 Cloud-based analytics solutions to facilitate seamless integration with other business systems and third-party applications
                               TABLE 41 CLOUD: RETAIL ANALYTICS SOFTWARE MARKET, BY REGION, 2019–2023 (USD MILLION)
                               TABLE 42 CLOUD: RETAIL ANALYTICS SOFTWARE MARKET, BY REGION, 2024–2029 (USD MILLION)
    6.3 SERVICES 
           FIGURE 48 MANAGED SERVICES SEGMENT TO GROW AT HIGHER CAGR DURING FORECAST PERIOD
           TABLE 43 RETAIL ANALYTICS MARKET, BY SERVICE, 2019–2023 (USD MILLION)
           TABLE 44 MARKET, BY SERVICE, 2024–2029 (USD MILLION)
           TABLE 45 RETAIL ANALYTICS SERVICES MARKET, BY REGION, 2019–2023 (USD MILLION)
           TABLE 46 RETAIL ANALYTICS SERVICES MARKET, BY REGION, 2024–2029 (USD MILLION)
           6.3.1 PROFESSIONAL SERVICES
                    FIGURE 49 SUPPORT & MAINTENANCE SEGMENT TO GROW AT HIGHEST CAGR DURING FORECAST PERIOD
                    TABLE 47 MARKET, BY PROFESSIONAL SERVICE, 2019–2023 (USD MILLION)
                    TABLE 48 RETAIL ANALYTICS MARKET, BY PROFESSIONAL SERVICE, 2024–2029 (USD MILLION)
                    TABLE 49 RETAIL ANALYTICS PROFESSIONAL SERVICES MARKET, BY REGION,  2019–2023 (USD MILLION)
                    TABLE 50 RETAIL ANALYTICS PROFESSIONAL SERVICES MARKET, BY REGION,  2024–2029 (USD MILLION)
                    6.3.1.1 Consulting & Advisory
                               6.3.1.1.1 Consultants and advisors bring deep industry expertise and technical proficiency to help retailers
                               TABLE 51 RETAIL ANALYTICS CONSULTING & ADVISORY SERVICES MARKET, BY REGION,  2019–2023 (USD MILLION)
                               TABLE 52 RETAIL ANALYTICS CONSULTING & ADVISORY SERVICES MARKET, BY REGION,  2024–2029 (USD MILLION)
                    6.3.1.2 Integration & Deployment
                               6.3.1.2.1 Facilities and frameworks to integrate various platforms with third-party environments to make retail analytics software quick and efficient
                               TABLE 53 RETAIL ANALYTICS INTEGRATION & DEPLOYMENT SERVICES MARKET, BY REGION,  2019–2023 (USD MILLION)
                               TABLE 54 RETAIL ANALYTICS INTEGRATION & DEPLOYMENT SERVICES MARKET, BY REGION,  2024–2029 (USD MILLION)
                    6.3.1.3 Support & Maintenance
                               6.3.1.3.1 Adopted by organizations that use on-premise deployment model for retail analytics software
                               TABLE 55 RETAIL ANALYTICS SUPPORT & MAINTENANCE SERVICES MARKET, BY REGION,  2019–2023 (USD MILLION)
                               TABLE 56 RETAIL ANALYTICS SUPPORT & MAINTENANCE SERVICES MARKET, BY REGION,  2024–2029 (USD MILLION)
                    6.3.1.4 Training & Education
                               6.3.1.4.1 Training and education services to help retailers navigate complex analytics tools and techniques effectively
                               TABLE 57 RETAIL ANALYTICS TRAINING & EDUCATION SERVICES MARKET, BY REGION,  2019–2023 (USD MILLION)
                               TABLE 58 RETAIL ANALYTICS TRAINING & EDUCATION SERVICES MARKET, BY REGION,  2024–2029 (USD MILLION)
           6.3.2 MANAGED SERVICES
                    TABLE 59 RETAIL ANALYTICS MANAGED SERVICES MARKET, BY REGION,  2019–2023 (USD MILLION)
                    TABLE 60 RETAIL ANALYTICS MANAGED SERVICES MARKET, BY REGION,  2024–2029 (USD MILLION)
 
7 RETAIL ANALYTICS MARKET, BY BUSINESS FUNCTION (Page No. - 135)
    7.1 INTRODUCTION 
           7.1.1 BUSINESS FUNCTION: MARKET DRIVERS
                    FIGURE 50 OPERATIONS & SUPPLY CHAIN SEGMENT TO GROW AT HIGHEST CAGR DURING FORECAST PERIOD
                    TABLE 61 MARKET, BY BUSINESS FUNCTION, 2019–2023 (USD MILLION)
                    TABLE 62 MARKET, BY BUSINESS FUNCTION, 2024–2029 (USD MILLION)
    7.2 SALES & MARKETING 
           7.2.1 RETAIL ANALYTICS FOCUSING ON USING SCENARIO ANALYSIS TO PREPARE FOR RETAIL SALES EFFECTIVELY
                    TABLE 63 MARKET IN SALES & MARKETING, BY REGION,  2019–2023 (USD MILLION)
                    TABLE 64 RETAIL ANALYTICS MARKET IN SALES & MARKETING, BY REGION,  2024–2029 (USD MILLION)
    7.3 FINANCE & ACCOUNTING 
           7.3.1 INTEGRATION OF RETAIL ANALYTICS WITH FINANCE AND ACCOUNTING FUNCTIONS TO EMPOWER BUSINESSES TO MAKE DATA-DRIVEN FINANCIAL DECISIONS
                    TABLE 65 MARKET IN FINANCE & ACCOUNTING, BY REGION,  2019–2023 (USD MILLION)
                    TABLE 66 MARKET IN FINANCE & ACCOUNTING, BY REGION,  2024–2029 (USD MILLION)
    7.4 OPERATIONS & SUPPLY CHAIN 
           7.4.1 SUPPLY CHAIN ANALYTICS TO ENABLE ORGANIZATIONS TO IDENTIFY AND ADDRESS IMMEDIATE OPERATIONAL CHALLENGES
                    TABLE 67 MARKET IN OPERATIONS & SUPPLY CHAIN, BY REGION,  2019–2023 (USD MILLION)
                    TABLE 68 MARKET IN OPERATIONS & SUPPLY CHAIN, BY REGION,  2024–2029 (USD MILLION)
    7.5 HR 
           7.5.1 HR PROFESSIONALS TO CONTRIBUTE SIGNIFICANTLY TO FOSTERING POSITIVE WORK CULTURE WITHIN RETAIL SECTOR
                    TABLE 69 MARKET IN HR, BY REGION, 2019–2023 (USD MILLION)
                    TABLE 70 MARKET IN HR, BY REGION, 2024–2029 (USD MILLION)
 
8 RETAIL ANALYTICS MARKET, BY APPLICATION (Page No. - 142)
    8.1 INTRODUCTION 
           8.1.1 APPLICATION: MARKET DRIVERS
                    FIGURE 51 PRICE RECOMMENDATION & OPTIMIZATION SEGMENT TO GROW AT HIGHEST CAGR DURING FORECAST PERIOD
                    TABLE 71 MARKET, BY APPLICATION, 2019–2023 (USD MILLION)
                    TABLE 72 RETAIL ANALYTICS MARKET, BY APPLICATION, 2024–2029 (USD MILLION)
    8.2 ORDER FULFILLMENT & RETURNS MANAGEMENT 
           TABLE 73 MARKET IN ORDER FULFILLMENT & RETURNS MANAGEMENT,  BY REGION, 2019–2023 (USD MILLION)
           TABLE 74 MARKET IN ORDER FULFILLMENT & RETURNS MANAGEMENT,  BY REGION, 2024–2029 (USD MILLION)
           8.2.1 ORDER PROCESSING & PACKAGING
                    8.2.1.1 Order processing system to accurately capture customer data and order details
           8.2.2 SHIPPING & TRANSPORTATION
                    8.2.2.1 Retailers can streamline shipping processes by leveraging historical data and real-time information
           8.2.3 RETURNS PROCESSING
                    8.2.3.1 Retailers leveraging returns processing applications integrated with advanced analytics to lead to bottom-line profitability
           8.2.4 PAYMENT PROCESSING
                    8.2.4.1 Payment processing provides invaluable insights into customer behavior, sales performance, and operational efficiency
    8.3 CUSTOMER RELATIONSHIP MANAGEMENT 
           TABLE 75 RETAIL ANALYTICS MARKET IN CUSTOMER RELATIONSHIP MANAGEMENT, BY REGION, 2019–2023 (USD MILLION)
           TABLE 76 MARKET IN CUSTOMER RELATIONSHIP MANAGEMENT, BY REGION, 2024–2029 (USD MILLION)
           8.3.1 CUSTOMER SEGMENTATION
                    8.3.1.1 Customer segmentation helps in marketing campaigns and designing overall marketing strategy and planning
           8.3.2 REVENUE OPTIMIZATION
                    8.3.2.1 Revenue optimization in retail operations maximizing revenue streams
           8.3.3 CUSTOMER RETENTION
                    8.3.3.1 Customer retention aims at fostering lasting relationships and maximizing customer lifetime value
           8.3.4 PREDICTIVE MODELING
                    8.3.4.1 Retailers gaining competitive edge and driving sustainable growth by leveraging predictive modeling
    8.4 PRICE RECOMMENDATION & OPTIMIZATION 
           TABLE 77 MARKET IN PRICE RECOMMENDATION & OPTIMIZATION, BY REGION, 2019–2023 (USD MILLION)
           TABLE 78 MARKET IN PRICE RECOMMENDATION & OPTIMIZATION, BY REGION, 2024–2029 (USD MILLION)
           8.4.1 PERSONALIZED PRICING
                    8.4.1.1 Retailers dynamically adjusting prices to maximize revenue and customer satisfaction
           8.4.2 REAL-TIME PRICE ADJUSTMENT
                    8.4.2.1 Real-time price adjustment strategies incorporate pricing rules on current market conditions
           8.4.3 PRICE OPTIMIZATION STRATEGY
                    8.4.3.1 Price optimization strategies consider various factors to determine optimal pricing levels
    8.5 MERCHANDISE PLANNING 
           TABLE 79 RETAIL ANALYTICS MARKET IN MERCHANDISE PLANNING, BY REGION,  2019–2023 (USD MILLION)
           TABLE 80 MARKET IN MERCHANDISE PLANNING, BY REGION,  2024–2029 (USD MILLION)
           8.5.1 DEMAND SENSING & FORECASTING
                    8.5.1.1 Demand sensing and forecasting enables retailers to minimize stockouts & reduce excess inventory costs
           8.5.2 TREND ANALYSIS
                    8.5.2.1 Trend analysis powered by retail analytics empowering retailers to stay ahead of competitors
           8.5.3 ASSORTMENT PLANNING
                    8.5.3.1 Retail analytics enabling retailers to simulate different assortment scenarios for maximum revenue generation
    8.6 SUPPLY CHAIN MANAGEMENT 
           TABLE 81 RETAIL ANALYTICS MARKET IN SUPPLY CHAIN MANAGEMENT, BY REGION,  2019–2023 (USD MILLION)
           TABLE 82 MARKET IN SUPPLY CHAIN MANAGEMENT, BY REGION,  2024–2029 (USD MILLION)
           8.6.1 CONTRACT MANAGEMENT
                    8.6.1.1 By analyzing contract data, retailers optimizing contract management processes to drive operational efficiency
           8.6.2 VENDOR MANAGEMENT
                    8.6.2.1 Vendor management mitigates supply chain risks to enhance overall operational performance
           8.6.3 WORK ORDER MANAGEMENT
                    8.6.3.1 Real-time analytics optimize work order management processes across supply chain
           8.6.4 INVOICE MANAGEMENT
                    8.6.4.1 Invoice management analytics ensure timely payments and strong relationships with suppliers
    8.7 FRAUD DETECTION & PREVENTION 
           TABLE 83 RETAIL ANALYTICS MARKET IN FRAUD DETECTION & PREVENTION, BY REGION,  2019–2023 (USD MILLION)
           TABLE 84 MARKET IN FRAUD DETECTION & PREVENTION, BY REGION,  2024–2029 (USD MILLION)
           8.7.1 POINT-OF-SALE (POS) VERIFICATION
                    8.7.1.1 Retailers implement proactive measures to prevent fraud at point of sale by leveraging POS verification
           8.7.2 PRODUCT COUNTERFEIT MANAGEMENT
                    8.7.2.1 Retail analytics enabling retailers to implement robust counterfeit management strategies by leveraging data-driven insights
           8.7.3 ROOT CAUSE ANALYSIS
                    8.7.3.1 Root cause analysis helps retailers pinpoint vulnerabilities in processes, systems, or internal controls exploited by fraudsters
           8.7.4 RISK ASSESSMENT & COMPLIANCE MANAGEMENT
                    8.7.4.1 Retailers identify potential areas of vulnerability and prioritize resources for mitigating risks
    8.8 OTHER APPLICATIONS 
           TABLE 85 RETAIL ANALYTICS MARKET IN OTHER APPLICATIONS, BY REGION,  2019–2023 (USD MILLION)
           TABLE 86 MARKET IN OTHER APPLICATIONS, BY REGION,  2024–2029 (USD MILLION)
 
9 RETAIL ANALYTICS MARKET, BY END USER (Page No. - 156)
    9.1 INTRODUCTION 
           9.1.1 END USER: MARKET DRIVERS
    9.2 END USER BY PRODUCT TYPE 
           FIGURE 52 INDUSTRIAL SEGMENT TO GROW AT HIGHER CAGR DURING FORECAST PERIOD
           TABLE 87 RETAIL ANALYTICS END USER MARKET, BY PRODUCT TYPE, 2019–2023 (USD MILLION)
           TABLE 88 RETAIL ANALYTICS END USER MARKET, BY PRODUCT TYPE, 2024–2029 (USD MILLION)
           9.2.1 INDUSTRIAL
                    9.2.1.1 Retail analytics to empower industrial product retailers to stay agile, responsive, and competitive
                               FIGURE 53 FABRICATED ITEMS SEGMENT TO GROW AT HIGHEST CAGR DURING FORECAST PERIOD
                               TABLE 89 RETAIL ANALYTICS END USER MARKET, BY INDUSTRIAL PRODUCT TYPE,  2019–2023 (USD MILLION)
                               TABLE 90 RETAIL ANALYTICS END USER MARKET, BY INDUSTRIAL PRODUCT TYPE,  2024–2029 (USD MILLION)
                               TABLE 91 INDUSTRIAL END USER: MARKET, BY REGION,  2019–2023 (USD MILLION)
                               TABLE 92 INDUSTRIAL END USER: MARKET, BY REGION,  2024–2029 (USD MILLION)
                    9.2.1.2 Raw materials
                               TABLE 93 RAW MATERIALS: RETAIL ANALYTICS MARKET, BY REGION, 2019–2023 (USD MILLION)
                               TABLE 94 RAW MATERIALS: MARKET, BY REGION, 2024–2029 (USD MILLION)
                    9.2.1.3 Equipment
                               TABLE 95 EQUIPMENT: MARKET, BY REGION, 2019–2023 (USD MILLION)
                               TABLE 96 EQUIPMENT: MARKET, BY REGION, 2024–2029 (USD MILLION)
                    9.2.1.4 Fabricated items
                               TABLE 97 FABRICATED ITEMS: RETAIL ANALYTICS MARKET, BY REGION, 2019–2023 (USD MILLION)
                               TABLE 98 FABRICATED ITEMS: MARKET, BY REGION, 2024–2029 (USD MILLION)
                    9.2.1.5 Operating supplies
                               TABLE 99 OPERATING SUPPLIES: MARKET, BY REGION,  2019–2023 (USD MILLION)
                               TABLE 100 OPERATING SUPPLIES: MARKET, BY REGION,  2024–2029 (USD MILLION)
           9.2.2 CONSUMER
                    9.2.2.1 Retail analytics to encourage consumer product retailers to adapt to changing market conditions and capitalize on emerging trends
                               FIGURE 54 SPECIALTY GOODS SEGMENT TO GROW AT HIGHEST CAGR DURING FORECAST PERIOD
                               TABLE 101 RETAIL ANALYTICS END USER MARKET, BY CONSUMER PRODUCT TYPE,  2019–2023 (USD MILLION)
                               TABLE 102 RETAIL ANALYTICS END USER MARKET, BY CONSUMER PRODUCT TYPE,  2024–2029 (USD MILLION)
                               TABLE 103 CONSUMER END USER: RETAIL ANALYTICS MARKET, BY REGION,  2019–2023 (USD MILLION)
                               TABLE 104 CONSUMER END USER: MARKET, BY REGION,  2024–2029 (USD MILLION)
                    9.2.2.2 Convenience goods
                               TABLE 105 CONVENIENCE GOODS: MARKET, BY REGION,  2019–2023 (USD MILLION)
                               TABLE 106 CONVENIENCE GOODS: MARKET, BY REGION,  2024–2029 (USD MILLION)
                    9.2.2.3 Shopping goods
                               TABLE 107 SHOPPING GOODS: MARKET, BY REGION, 2019–2023 (USD MILLION)
                               TABLE 108 SHOPPING GOODS: RETAIL ANALYTICS MARKET, BY REGION, 2024–2029 (USD MILLION)
                    9.2.2.4 Specialty goods
                               TABLE 109 SPECIALTY GOODS: MARKET, BY REGION, 2019–2023 (USD MILLION)
                               TABLE 110 SPECIALTY GOODS: MARKET, BY REGION, 2024–2029 (USD MILLION)
                    9.2.2.5 Unsought goods
                               TABLE 111 UNSOUGHT GOODS: MARKET, BY REGION, 2019–2023 (USD MILLION)
                               TABLE 112 UNSOUGHT GOODS: MARKET, BY REGION, 2024–2029 (USD MILLION)
    9.3 END USER BY CHANNEL TYPE 
           FIGURE 55 ONLINE SEGMENT TO GROW AT HIGHER CAGR DURING FORECAST PERIOD
           TABLE 113 RETAIL ANALYTICS END USER MARKET, BY CHANNEL TYPE, 2019–2023 (USD MILLION)
           TABLE 114 RETAIL ANALYTICS END USER MARKET, BY CHANNEL TYPE, 2024–2029 (USD MILLION)
           9.3.1 ONLINE
                    9.3.1.1 Demand for intelligent analytical solutions in online retail sector to drive growth of MARKET
                               TABLE 115 ONLINE: RETAIL ANALYTICS END USER MARKET, BY REGION, 2019–2023 (USD MILLION)
                               TABLE 116 ONLINE: RETAIL ANALYTICS END USER MARKET, BY REGION, 2024–2029 (USD MILLION)
           9.3.2 OFFLINE
                    9.3.2.1 Integration of offline channel data into retail analytics solutions to be instrumental in shaping future of retail
                               TABLE 117 OFFLINE: RETAIL ANALYTICS END USER MARKET, BY REGION, 2019–2023 (USD MILLION)
                               TABLE 118 OFFLINE: RETAIL ANALYTICS END USER MARKET, BY REGION, 2024–2029 (USD MILLION)
 
10 RETAIL ANALYTICS MARKET, BY REGION (Page No. - 171)
     10.1 INTRODUCTION 
               FIGURE 56 INDIA TO REGISTER HIGHEST CAGR DURING FORECAST PERIOD
               FIGURE 57 ASIA PACIFIC TO WITNESS HIGHEST CAGR DURING FORECAST PERIOD
               TABLE 119 MARKET, BY REGION, 2019–2023 (USD MILLION)
               TABLE 120 RETAIL ANALYTICS MARKET, BY REGION, 2024–2029 (USD MILLION)
     10.2 NORTH AMERICA 
             10.2.1 NORTH AMERICA: MARKET DRIVERS
             10.2.2 NORTH AMERICA: IMPACT OF RECESSION
                       FIGURE 58 NORTH AMERICA: MARKET SNAPSHOT
                       TABLE 121 NORTH AMERICA: MARKET, BY OFFERING, 2019–2023 (USD MILLION)
                       TABLE 122 NORTH AMERICA: MARKET, BY OFFERING, 2024–2029 (USD MILLION)
                       TABLE 123 NORTH AMERICA: RETAIL ANALYTICS SOFTWARE MARKET, BY ANALYTICS TYPE,  2019–2023 (USD MILLION)
                       TABLE 124 NORTH AMERICA: RETAIL ANALYTICS SOFTWARE MARKET, BY ANALYTICS TYPE,  2024–2029 (USD MILLION)
                       TABLE 125 NORTH AMERICA: RETAIL ANALYTICS SOFTWARE MARKET, BY DEPLOYMENT MODE,  2019–2023 (USD MILLION)
                       TABLE 126 NORTH AMERICA: RETAIL ANALYTICS SOFTWARE MARKET, BY DEPLOYMENT MODE, 2024–2029 (USD MILLION)
                       TABLE 127 NORTH AMERICA: RETAIL ANALYTICS MARKET, BY SERVICE, 2019–2023 (USD MILLION)
                       TABLE 128 NORTH AMERICA: MARKET, BY SERVICE, 2024–2029 (USD MILLION)
                       TABLE 129 NORTH AMERICA: MARKET, BY PROFESSIONAL SERVICE,  2019–2023 (USD MILLION)
                       TABLE 130 NORTH AMERICA: MARKET, BY PROFESSIONAL SERVICE,  2024–2029 (USD MILLION)
                       TABLE 131 NORTH AMERICA: MARKET, BY BUSINESS FUNCTION,  2019–2023 (USD MILLION)
                       TABLE 132 NORTH AMERICA: MARKET, BY BUSINESS FUNCTION,  2024–2029 (USD MILLION)
                       TABLE 133 NORTH AMERICA: MARKET, BY APPLICATION,  2019–2023 (USD MILLION)
                       TABLE 134 NORTH AMERICA: MARKET, BY APPLICATION,  2024–2029 (USD MILLION)
                       TABLE 135 NORTH AMERICA: RETAIL ANALYTICS END USER MARKET, BY PRODUCT TYPE,  2019–2023 (USD MILLION)
                       TABLE 136 NORTH AMERICA: RETAIL ANALYTICS END USER MARKET, BY PRODUCT TYPE,  2024–2029 (USD MILLION)
                       TABLE 137 NORTH AMERICA: MARKET, BY INDUSTRIAL PRODUCT TYPE,  2019–2023 (USD MILLION)
                       TABLE 138 NORTH AMERICA: MARKET, BY INDUSTRIAL PRODUCT TYPE,  2024–2029 (USD MILLION)
                       TABLE 139 NORTH AMERICA: MARKET, BY CONSUMER PRODUCT TYPE,  2019–2023 (USD MILLION)
                       TABLE 140 NORTH AMERICA: RETAIL ANALYTICS MARKET, BY CONSUMER PRODUCT TYPE,  2024–2029 (USD MILLION)
                       TABLE 141 NORTH AMERICA: RETAIL ANALYTICS END USER MARKET, BY CHANNEL,  2019–2023 (USD MILLION)
                       TABLE 142 NORTH AMERICA: RETAIL ANALYTICS END USER MARKET, BY CHANNEL,  2024–2029 (USD MILLION)
                       TABLE 143 NORTH AMERICA: MARKET, BY COUNTRY, 2019–2023 (USD MILLION)
                       TABLE 144 NORTH AMERICA: MARKET, BY COUNTRY, 2024–2029 (USD MILLION)
             10.2.3 US
                       10.2.3.1 US MARKET poised for continued growth
             10.2.4 CANADA
                       10.2.4.1 Advancements highlight Canada's potential as hub for innovative retail analytics solutions
     10.3 EUROPE 
             10.3.1 EUROPE: MARKET DRIVERS
             10.3.2 EUROPE: IMPACT OF RECESSION
                       TABLE 145 EUROPE: MARKET, BY OFFERING, 2019–2023 (USD MILLION)
                       TABLE 146 EUROPE: RETAIL ANALYTICS MARKET, BY OFFERING, 2024–2029 (USD MILLION)
                       TABLE 147 EUROPE: RETAIL ANALYTICS SOFTWARE MARKET, BY ANALYTICS TYPE,  2019–2023 (USD MILLION)
                       TABLE 148 EUROPE: RETAIL ANALYTICS SOFTWARE MARKET, BY ANALYTICS TYPE,  2024–2029 (USD MILLION)
                       TABLE 149 EUROPE: RETAIL ANALYTICS SOFTWARE MARKET, BY DEPLOYMENT MODE,  2019–2023 (USD MILLION)
                       TABLE 150 EUROPE: RETAIL ANALYTICS SOFTWARE MARKET, BY DEPLOYMENT MODE,  2024–2029 (USD MILLION)
                       TABLE 151 EUROPE: MARKET, BY SERVICE, 2019–2023 (USD MILLION)
                       TABLE 152 EUROPE: MARKET, BY SERVICE, 2024–2029 (USD MILLION)
                       TABLE 153 EUROPE: MARKET, BY PROFESSIONAL SERVICE,  2019–2023 (USD MILLION)
                       TABLE 154 EUROPE: MARKET, BY PROFESSIONAL SERVICE,  2024–2029 (USD MILLION)
                       TABLE 155 EUROPE: MARKET, BY BUSINESS FUNCTION,  2019–2023 (USD MILLION)
                       TABLE 156 EUROPE: RETAIL ANALYTICS MARKET, BY BUSINESS FUNCTION,  2024–2029 (USD MILLION)
                       TABLE 157 EUROPE: MARKET, BY APPLICATION, 2019–2023 (USD MILLION)
                       TABLE 158 EUROPE: MARKET, BY APPLICATION, 2024–2029 (USD MILLION)
                       TABLE 159 EUROPE: RETAIL ANALYTICS END USER MARKET, BY PRODUCT TYPE,  2019–2023 (USD MILLION)
                       TABLE 160 EUROPE: RETAIL ANALYTICS END USER MARKET, BY PRODUCT TYPE,  2024–2029 (USD MILLION)
                       TABLE 161 EUROPE: MARKET, BY INDUSTRIAL PRODUCT TYPE,  2019–2023 (USD MILLION)
                       TABLE 162 EUROPE: MARKET, BY INDUSTRIAL PRODUCT TYPE,  2024–2029 (USD MILLION)
                       TABLE 163 EUROPE: MARKET, BY CONSUMER PRODUCT TYPE,  2019–2023 (USD MILLION)
                       TABLE 164 EUROPE: MARKET, BY CONSUMER PRODUCT TYPE,  2024–2029 (USD MILLION)
                       TABLE 165 EUROPE: RETAIL ANALYTICS END USER MARKET, BY CHANNEL,  2019–2023 (USD MILLION)
                       TABLE 166 EUROPE: RETAIL ANALYTICS END USER MARKET, BY CHANNEL,  2024–2029 (USD MILLION)
                       TABLE 167 EUROPE: MARKET, BY COUNTRY, 2019–2023 (USD MILLION)
                       TABLE 168 EUROPE: MARKET, BY COUNTRY, 2024–2029 (USD MILLION)
             10.3.3 UK
                       10.3.3.1 Domestic companies to shape future of retail analytics in UK
             10.3.4 GERMANY
                       10.3.4.1 German companies to be at forefront of advancements in retail analytics
             10.3.5 FRANCE
                       10.3.5.1 France's retail sector to present unique environment for MARKET
             10.3.6 ITALY
                       10.3.6.1 Italian government's initiatives toward digital transformation to create favorable environment for market
             10.3.7 SPAIN
                       10.3.7.1 Spanish retailers increasingly turning to analytics to enhance their marketing strategies
             10.3.8 REST OF EUROPE
     10.4 ASIA PACIFIC 
             10.4.1 ASIA PACIFIC: MARKET DRIVERS
             10.4.2 ASIA PACIFIC: IMPACT OF RECESSION
                       FIGURE 59 ASIA PACIFIC: MARKET SNAPSHOT
                       TABLE 169 ASIA PACIFIC: RETAIL ANALYTICS MARKET, BY OFFERING, 2019–2023 (USD MILLION)
                       TABLE 170 ASIA PACIFIC: MARKET, BY OFFERING, 2024–2029 (USD MILLION)
                       TABLE 171 ASIA PACIFIC: RETAIL ANALYTICS SOFTWARE MARKET, BY ANALYTICS TYPE,  2019–2023 (USD MILLION)
                       TABLE 172 ASIA PACIFIC: RETAIL ANALYTICS SOFTWARE MARKET, BY ANALYTICS TYPE,  2024–2029 (USD MILLION)
                       TABLE 173 ASIA PACIFIC: RETAIL ANALYTICS SOFTWARE MARKET, BY DEPLOYMENT MODE,  2019–2023 (USD MILLION)
                       TABLE 174 ASIA PACIFIC: RETAIL ANALYTICS SOFTWARE MARKET, BY DEPLOYMENT MODE,  2024–2029 (USD MILLION)
                       TABLE 175 ASIA PACIFIC: MARKET, BY SERVICE, 2019–2023 (USD MILLION)
                       TABLE 176 ASIA PACIFIC: MARKET, BY SERVICE, 2024–2029 (USD MILLION)
                       TABLE 177 ASIA PACIFIC: MARKET, BY PROFESSIONAL SERVICE,  2019–2023 (USD MILLION)
                       TABLE 178 ASIA PACIFIC: MARKET, BY PROFESSIONAL SERVICE,  2024–2029 (USD MILLION)
                       TABLE 179 ASIA PACIFIC: MARKET, BY BUSINESS FUNCTION,  2019–2023 (USD MILLION)
                       TABLE 180 ASIA PACIFIC: MARKET, BY BUSINESS FUNCTION,  2024–2029 (USD MILLION)
                       TABLE 181 ASIA PACIFIC: RETAIL ANALYTICS MARKET, BY APPLICATION, 2019–2023 (USD MILLION)
                       TABLE 182 ASIA PACIFIC: MARKET, BY APPLICATION, 2024–2029 (USD MILLION)
                       TABLE 183 ASIA PACIFIC: RETAIL ANALYTICS END USER MARKET, BY PRODUCT TYPE,  2019–2023 (USD MILLION)
                       TABLE 184 ASIA PACIFIC: RETAIL ANALYTICS END USER MARKET, BY PRODUCT TYPE,  2024–2029 (USD MILLION)
                       TABLE 185 ASIA PACIFIC: MARKET, BY INDUSTRIAL PRODUCT TYPE,  2019–2023 (USD MILLION)
                       TABLE 186 ASIA PACIFIC: MARKET, BY INDUSTRIAL PRODUCT TYPE,  2024–2029 (USD MILLION)
                       TABLE 187 ASIA PACIFIC: MARKET, BY CONSUMER PRODUCT TYPE,  2019–2023 (USD MILLION)
                       TABLE 188 ASIA PACIFIC: MARKET, BY CONSUMER PRODUCT TYPE,  2024–2029 (USD MILLION)
                       TABLE 189 ASIA PACIFIC: RETAIL ANALYTICS END USER MARKET, BY CHANNEL,  2019–2023 (USD MILLION)
                       TABLE 190 ASIA PACIFIC: RETAIL ANALYTICS END USER MARKET, BY CHANNEL,  2024–2029 (USD MILLION)
                       TABLE 191 ASIA PACIFIC: MARKET, BY COUNTRY/REGION,  2019–2023 (USD MILLION)
                       TABLE 192 ASIA PACIFIC: MARKET, BY COUNTRY/REGION,  2024–2029 (USD MILLION)
             10.4.3 INDIA
                       10.4.3.1 Developments in Indian MARKET to showcase its dynamism
             10.4.4 JAPAN
                       10.4.4.1 Japanese companies to underscore region's commitment to driving growth and innovation within retail analytics sector
             10.4.5 CHINA
                       10.4.5.1 Increase in investment and shift in customer demands to drive market growth in China
             10.4.6 ASEAN COUNTRIES
                       10.4.6.1 ASEAN MARKET brimming with potential
             10.4.7 SOUTH KOREA
                       10.4.7.1 South Korean MARKET to thrive on innovation and data-driven approach
             10.4.8 AUSTRALIA & NEW ZEALAND (ANZ)
                       10.4.8.1 Potential for market expansion with growing technologies in Australian and New Zealand markets
             10.4.9 REST OF ASIA PACIFIC
     10.5 MIDDLE EAST & AFRICA 
             10.5.1 MIDDLE EAST & AFRICA: MARKET DRIVERS
             10.5.2 MIDDLE EAST & AFRICA: IMPACT OF RECESSION
                       TABLE 193 MIDDLE EAST & AFRICA: RETAIL ANALYTICS MARKET, BY OFFERING,  2019–2023 (USD MILLION)
                       TABLE 194 MIDDLE EAST & AFRICA: MARKET, BY OFFERING,  2024–2029 (USD MILLION)
                       TABLE 195 MIDDLE EAST & AFRICA: RETAIL ANALYTICS SOFTWARE MARKET, BY ANALYTICS TYPE, 2019–2023 (USD MILLION)
                       TABLE 196 MIDDLE EAST & AFRICA: RETAIL ANALYTICS SOFTWARE MARKET, BY ANALYTICS TYPE,  2024–2029 (USD MILLION)
                       TABLE 197 MIDDLE EAST & AFRICA: RETAIL ANALYTICS SOFTWARE MARKET SIZE, BY DEPLOYMENT MODE, 2019–2023 (USD MILLION)
                       TABLE 198 MIDDLE EAST & AFRICA: RETAIL ANALYTICS SOFTWARE MARKET, BY DEPLOYMENT MODE, 2024–2029 (USD MILLION)
                       TABLE 199 MIDDLE EAST & AFRICA: MARKET, BY SERVICE,  2019–2023 (USD MILLION)
                       TABLE 200 MIDDLE EAST & AFRICA: MARKET, BY SERVICE,  2024–2029 (USD MILLION)
                       TABLE 201 MIDDLE EAST & AFRICA: MARKET, BY PROFESSIONAL SERVICE,  2019–2023 (USD MILLION)
                       TABLE 202 MIDDLE EAST & AFRICA: MARKET, BY PROFESSIONAL SERVICE,  2024–2029 (USD MILLION)
                       TABLE 203 MIDDLE EAST & AFRICA: MARKET, BY BUSINESS FUNCTION,  2019–2023 (USD MILLION)
                       TABLE 204 MIDDLE EAST & AFRICA: MARKET, BY BUSINESS FUNCTION,  2024–2029 (USD MILLION)
                       TABLE 205 MIDDLE EAST & AFRICA: MARKET, BY APPLICATION,  2019–2023 (USD MILLION)
                       TABLE 206 MIDDLE EAST & AFRICA: MARKET, BY APPLICATION,  2024–2029 (USD MILLION)
                       TABLE 207 MIDDLE EAST & AFRICA: RETAIL ANALYTICS END USER MARKET, BY PRODUCT TYPE,  2019–2023 (USD MILLION)
                       TABLE 208 MIDDLE EAST & AFRICA: RETAIL ANALYTICS END USER MARKET, BY PRODUCT TYPE,  2024–2029 (USD MILLION)
                       TABLE 209 MIDDLE EAST & AFRICA: MARKET, BY INDUSTRIAL PRODUCT TYPE,  2019–2023 (USD MILLION)
                       TABLE 210 MIDDLE EAST & AFRICA: RETAIL ANALYTICS MARKET, BY INDUSTRIAL PRODUCT TYPE,  2024–2029 (USD MILLION)
                       TABLE 211 MIDDLE EAST & AFRICA: MARKET, BY CONSUMER PRODUCT TYPE,  2019–2023 (USD MILLION)
                       TABLE 212 MIDDLE EAST & AFRICA: MARKET, BY CONSUMER PRODUCT TYPE,  2024–2029 (USD MILLION)
                       TABLE 213 MIDDLE EAST & AFRICA: RETAIL ANALYTICS END USER MARKET, BY CHANNEL,  2019–2023 (USD MILLION)
                       TABLE 214 MIDDLE EAST & AFRICA: RETAIL ANALYTICS END USER MARKET, BY CHANNEL,  2024–2029 (USD MILLION)
                       TABLE 215 MIDDLE EAST & AFRICA: MARKET, BY COUNTRY,  2019–2023 (USD MILLION)
                       TABLE 216 MIDDLE EAST & AFRICA: MARKET, BY COUNTRY,  2024–2029 (USD MILLION)
             10.5.3 SAUDI ARABIA
                       10.5.3.1 Increase in Saudi government's initiatives to promote digital transformation and innovation support retailers to invest in technology to modernize their operations
             10.5.4 UAE
                       10.5.4.1 Retail analytics enable unprecedented insights into consumer behavior, operational efficiency, and competitive strategy in UAE's dynamic retail landscape
             10.5.5 SOUTH AFRICA
                       10.5.5.1 Rise of e-commerce platforms and shifting consumer preferences toward online shopping further propel demand for analytics solutions
             10.5.6 TURKEY
                       10.5.6.1 Shift toward online shopping necessitate use of analytics to optimize digital channels and improve efficiency of online operations
             10.5.7 EGYPT
                       10.5.7.1 Rising need to streamline operations, improve inventory management, and enhance overall business efficiency to accelerate adoption of retail analytics software
             10.5.8 REST OF MIDDLE EAST & AFRICA
     10.6 LATIN AMERICA 
             10.6.1 LATIN AMERICA: MARKET DRIVERS
             10.6.2 LATIN AMERICA: IMPACT OF RECESSION
                       TABLE 217 LATIN AMERICA: RETAIL ANALYTICS MARKET, BY OFFERING, 2019–2023 (USD MILLION)
                       TABLE 218 LATIN AMERICA: MARKET, BY OFFERING, 2024–2029 (USD MILLION)
                       TABLE 219 LATIN AMERICA: RETAIL ANALYTICS SOFTWARE MARKET, BY ANALYTICS TYPE,  2019–2023 (USD MILLION)
                       TABLE 220 LATIN AMERICA: RETAIL ANALYTICS SOFTWARE MARKET, BY ANALYTICS TYPE,  2024–2029 (USD MILLION)
                       TABLE 221 LATIN AMERICA: RETAIL ANALYTICS SOFTWARE MARKET SIZE, BY DEPLOYMENT MODE,  2019–2023 (USD MILLION)
                       TABLE 222 LATIN AMERICA: RETAIL ANALYTICS SOFTWARE MARKET, BY DEPLOYMENT MODE, 2024–2029 (USD MILLION)
                       TABLE 223 LATIN AMERICA: MARKET, BY SERVICE, 2019–2023 (USD MILLION)
                       TABLE 224 LATIN AMERICA: MARKET, BY SERVICE, 2024–2029 (USD MILLION)
                       TABLE 225 LATIN AMERICA: MARKET, BY PROFESSIONAL SERVICE,  2019–2023 (USD MILLION)
                       TABLE 226 LATIN AMERICA: MARKET, BY PROFESSIONAL SERVICE,  2024–2029 (USD MILLION)
                       TABLE 227 LATIN AMERICA: MARKET, BY BUSINESS FUNCTION,  2019–2023 (USD MILLION)
                       TABLE 228 LATIN AMERICA: MARKET, BY BUSINESS FUNCTION,  2024–2029 (USD MILLION)
                       TABLE 229 LATIN AMERICA: MARKET, BY APPLICATION,  2019–2023 (USD MILLION)
                       TABLE 230 LATIN AMERICA: MARKET, BY APPLICATION,  2024–2029 (USD MILLION)
                       TABLE 231 LATIN AMERICA: RETAIL ANALYTICS END USER MARKET, BY PRODUCT TYPE,  2019–2023 (USD MILLION)
                       TABLE 232 LATIN AMERICA: RETAIL ANALYTICS END USER MARKET, BY PRODUCT TYPE,  2024–2029 (USD MILLION)
                       TABLE 233 LATIN AMERICA: RETAIL ANALYTICS MARKET, BY INDUSTRIAL PRODUCT TYPE,  2019–2023 (USD MILLION)
                       TABLE 234 LATIN AMERICA: MARKET, BY INDUSTRIAL PRODUCT TYPE,  2024–2029 (USD MILLION)
                       TABLE 235 LATIN AMERICA: MARKET, BY CONSUMER PRODUCT TYPE,  2019–2023 (USD MILLION)
                       TABLE 236 LATIN AMERICA: MARKET, BY CONSUMER PRODUCT TYPE,  2024–2029 (USD MILLION)
                       TABLE 237 LATIN AMERICA: RETAIL ANALYTICS END USER MARKET, BY CHANNEL,  2019–2023 (USD MILLION)
                       TABLE 238 LATIN AMERICA: RETAIL ANALYTICS END USER MARKET, BY CHANNEL,  2024–2029 (USD MILLION)
                       TABLE 239 LATIN AMERICA: MARKET, BY COUNTRY, 2019–2023 (USD MILLION)
                       TABLE 240 LATIN AMERICA: MARKET, BY COUNTRY, 2024–2029 (USD MILLION)
             10.6.3 BRAZIL
                       10.6.3.1 Rise of e-commerce platforms and shifting consumer preferences towards online shopping to optimize digital channels and improve efficiency of online operations
             10.6.4 MEXICO
                       10.6.4.1 Mexican retailers to leverage analytics solutions to understand consumer preferences better, optimize inventory management, and enhance overall shopping experience
             10.6.5 ARGENTINA
                       10.6.5.1 Rise of e-commerce platforms and digitalization of retail to drive demand for analytics tools
             10.6.6 REST OF LATIN AMERICA
 
11 COMPETITIVE LANDSCAPE (Page No. - 223)
     11.1 OVERVIEW 
     11.2 KEY PLAYER STRATEGIES 
               TABLE 241 OVERVIEW OF STRATEGIES ADOPTED BY KEY RETAIL ANALYTICS VENDORS
     11.3 REVENUE ANALYSIS 
               FIGURE 60 TOP FIVE PLAYERS DOMINATING MARKET FROM 2019 TO 2023 (USD MILLION)
     11.4 MARKET SHARE ANALYSIS 
               FIGURE 61 SHARE OF LEADING COMPANIES IN MARKET, 2023
             11.4.1 RETAIL ANALYTICS MARKET RANKING ANALYSIS
                       TABLE 242 MARKET: DEGREE OF COMPETITION
     11.5 BRAND/PRODUCT COMPARATIVE ANALYSIS 
               FIGURE 62 BRAND/PRODUCT COMPARATIVE ANALYSIS
     11.6 COMPANY VALUATION AND FINANCIAL METRICS OF KEY VENDORS 
               FIGURE 63 COMPANY VALUATION AND FINANCIAL METRICS OF KEY VENDORS
               FIGURE 64 YEAR-TO-DATE (YTD) PRICE TOTAL RETURN AND 5-YEAR STOCK BETA OF KEY VENDORS
     11.7 COMPANY EVALUATION MATRIX: KEY PLAYERS 
             11.7.1 STARS
             11.7.2 EMERGING LEADERS
             11.7.3 PERVASIVE PLAYERS
             11.7.4 PARTICIPANTS
                       FIGURE 65 MARKET: COMPANY EVALUATION MATRIX (KEY PLAYERS), 2023
             11.7.5 COMPANY FOOTPRINT: KEY PLAYERS
                       11.7.5.1 Overall company footprint
                                   FIGURE 66 RETAIL ANALYTICS MARKET: OVERALL COMPANY FOOTPRINT (25 COMPANIES)
                       11.7.5.2 Region footprint
                                   TABLE 243 MARKET: REGIONAL FOOTPRINT (25 COMPANIES)
                       11.7.5.3 End user footprint
                                   TABLE 244 MARKET: END USER FOOTPRINT (25 COMPANIES)
                       11.7.5.4 Application footprint
                                   TABLE 245 MARKET: APPLICATION FOOTPRINT (25 COMPANIES)
                       11.7.5.5 Product footprint
                                   TABLE 246 RETAIL ANALYTICS MARKET: PRODUCT FOOTPRINT (25 COMPANIES)
     11.8 COMPANY EVALUATION MATRIX: STARTUPS/SMES 
             11.8.1 PROGRESSIVE COMPANIES
             11.8.2 RESPONSIVE COMPANIES
             11.8.3 DYNAMIC COMPANIES
             11.8.4 STARTING BLOCKS
                       FIGURE 67 RETAIL ANALYTICS MARKET: COMPANY EVALUATION MATRIX (STARTUPS/SMES), 2023
             11.8.5 COMPETITIVE BENCHMARKING: STARTUPS/SMES
                       11.8.5.1 Detailed list of key startups/SMEs
                                   TABLE 247 MARKET: DETAILED LIST OF KEY STARTUPS/SMES
                       11.8.5.2 Competitive benchmarking of key startups/SMEs
                                   TABLE 248 MARKET: COMPETITIVE BENCHMARKING OF STARTUPS/SMES
     11.9 COMPETITIVE SCENARIO AND TRENDS 
             11.9.1 PRODUCT LAUNCHES & ENHANCEMENTS
                       TABLE 249 MARKET: PRODUCT LAUNCHES & ENHANCEMENTS, JANUARY 2021–FEBRUARY 2024
             11.9.2 DEALS
                       TABLE 250 MARKET: DEALS, JANUARY 2021–FEBRUARY 2024
 
12 COMPANY PROFILES (Page No. - 246)
     12.1 INTRODUCTION 
     12.2 KEY PLAYERS 
(Business overview, Products/Solutions/Services offered, Recent developments, MnM view, Key strategies, Strategic choices made, and Weaknesses and Competitive threats)*
             12.2.1 MICROSOFT
                       TABLE 251 MICROSOFT: BUSINESS OVERVIEW
                       FIGURE 68 MICROSOFT: COMPANY SNAPSHOT
                       TABLE 252 MICROSOFT: PRODUCTS/SOLUTIONS/SERVICES OFFERED
                       TABLE 253 MICROSOFT: PRODUCT LAUNCHES & ENHANCEMENTS
                       TABLE 254 MICROSOFT: DEALS
             12.2.2 IBM
                       TABLE 255 IBM: BUSINESS OVERVIEW
                       FIGURE 69 IBM: COMPANY SNAPSHOT
                       TABLE 256 IBM: PRODUCTS/SOLUTIONS/SERVICES OFFERED
                       TABLE 257 IBM: PRODUCT LAUNCHES & ENHANCEMENTS
                       TABLE 258 IBM: DEALS
             12.2.3 SAP
                       TABLE 259 SAP: BUSINESS OVERVIEW
                       FIGURE 70 SAP: COMPANY SNAPSHOT
                       TABLE 260 SAP: PRODUCTS/SOLUTIONS/SERVICES OFFERED
                       TABLE 261 SAP: PRODUCT LAUNCHES AND ENHANCEMENTS
             12.2.4 ORACLE
                       TABLE 262 ORACLE: BUSINESS OVERVIEW
                       FIGURE 71 ORACLE: COMPANY SNAPSHOT
                       TABLE 263 ORACLE: PRODUCTS/SOLUTIONS/SERVICES OFFERED
                       TABLE 264 ORACLE: PRODUCT LAUNCHES AND ENHANCEMENTS
                       TABLE 265 ORACLE: DEALS
             12.2.5 SALESFORCE
                       TABLE 266 SALESFORCE: BUSINESS OVERVIEW
                       FIGURE 72 SALESFORCE: COMPANY SNAPSHOT
                       TABLE 267 SALESFORCE: PRODUCTS/SOLUTIONS/SERVICES OFFERED
                       TABLE 268 SALESFORCE: PRODUCT LAUNCHES AND ENHANCEMENTS
                       TABLE 269 SALESFORCE: DEALS
             12.2.6 MICROSTRATEGY
                       TABLE 270 MICROSTRATEGY: BUSINESS OVERVIEW
                       FIGURE 73 MICROSTRATEGY: COMPANY SNAPSHOT
                       TABLE 271 MICROSTRATEGY: PRODUCTS/SOLUTIONS/SERVICES OFFERED
                       TABLE 272 MICROSTRATEGY: PRODUCT LAUNCHES AND ENHANCEMENTS
                       TABLE 273 MICROSTRATEGY: DEALS
             12.2.7 SAS INSTITUTE
                       TABLE 274 SAS INSTITUTE: BUSINESS OVERVIEW
                       TABLE 275 SAS INSTITUTE: PRODUCTS/SOLUTIONS/SERVICES OFFERED
                       TABLE 276 SAS INSTITUTE: PRODUCT LAUNCHES AND ENHANCEMENTS
                       TABLE 277 SAS INSTITUTE: DEALS
             12.2.8 AWS
                       TABLE 278 AWS: BUSINESS OVERVIEW
                       FIGURE 74 AWS: COMPANY SNAPSHOT
                       TABLE 279 AWS: PRODUCTS/SOLUTIONS/SERVICES OFFERED
                       TABLE 280 AWS: PRODUCT LAUNCHES AND ENHANCEMENTS
                       TABLE 281 AWS: DEALS
             12.2.9 QLIK
                       TABLE 282 QLIK: BUSINESS OVERVIEW
                       TABLE 283 QLIK: PRODUCTS/SOLUTIONS/SERVICES OFFERED
                       TABLE 284 QLIK: PRODUCT LAUNCHES AND ENHANCEMENTS
                       TABLE 285 QLIK: DEALS
             12.2.10 TERADATA
                                   TABLE 286 TERADATA: BUSINESS OVERVIEW
                                   FIGURE 75 TERADATA: COMPANY SNAPSHOT
                                   TABLE 287 TERADATA: PRODUCTS/SOLUTIONS/SERVICES OFFERED
                                   TABLE 288 TERADATA: PRODUCT LAUNCHES AND ENHANCEMENTS
                                   TABLE 289 TERADATA: DEALS
     12.3 OTHER PLAYERS 
             12.3.1 WNS
             12.3.2 HCL
             12.3.3 LIGHTSPEED COMMERCE
             12.3.4 RETAILNEXT
             12.3.5 MANTHAN SYSTEMS
             12.3.6 FIT ANALYTICS
             12.3.7 TRAX
             12.3.8 THOUGHTSPOT
             12.3.9 RELEX SOLUTIONS
             12.3.10 TREDENCE
             12.3.11 CREATIO
             12.3.12 SOLVOYO
             12.3.13 DATAPINE
             12.3.14 SISENSE
             12.3.15 EDITED
     12.4 STARTUP/SME PROFILES 
             12.4.1 RETAIL ZIPLINE
             12.4.2 SYMPHONYAI
             12.4.3 THINKINSIDE
             12.4.4 DOR TECHNOLOGIES
             12.4.5 TRIPLE WHALE
             12.4.6 FLAME ANALYTICS
             12.4.7 ALLOY.AI TECHNOLOGIES
             12.4.8 CONJURA
             12.4.9 KYVOS INSIGHTS
             12.4.10 PYGMALIOS
*Details on Business overview, Products/Solutions/Services offered, Recent developments, MnM view, Key strategies, Strategic choices made, and Weaknesses and Competitive threats might not be captured in case of unlisted companies.
 
13 ADJACENT AND RELATED MARKETS (Page No. - 299)
     13.1 INTRODUCTION 
     13.2 CUSTOMER EXPERIENCE MANAGEMENT MARKET - GLOBAL FORECAST TO 2028 
             13.2.1 RETAIL ANALYTICS MARKET DEFINITION
             13.2.2 MARKET OVERVIEW
                       13.2.2.1 Customer experience management market, by offering
                                   TABLE 290 CUSTOMER EXPERIENCE MANAGEMENT MARKET, BY OFFERING,  2017–2022 (USD MILLION)
                                   TABLE 291 CUSTOMER EXPERIENCE MANAGEMENT MARKET, BY OFFERING,  2023–2028 (USD MILLION)
                       13.2.2.2 Customer experience management market, by deployment type
                                   TABLE 292 CUSTOMER EXPERIENCE MANAGEMENT MARKET, BY DEPLOYMENT TYPE,  2017–2022 (USD MILLION)
                                   TABLE 293 CUSTOMER EXPERIENCE MANAGEMENT MARKET, BY DEPLOYMENT TYPE,  2023–2028 (USD MILLION)
                       13.2.2.3 Customer experience management market, by organization size
                                   TABLE 294 CUSTOMER EXPERIENCE MANAGEMENT MARKET, BY ORGANIZATION SIZE,  2017–2022 (USD MILLION)
                                   TABLE 295 CUSTOMER EXPERIENCE MANAGEMENT MARKET, BY ORGANIZATION SIZE,  2023–2028 (USD MILLION)
                       13.2.2.4 Customer experience management market, by vertical
                                   TABLE 296 CUSTOMER EXPERIENCE MANAGEMENT MARKET, BY VERTICAL,  2017–2022 (USD MILLION)
                                   TABLE 297 CUSTOMER EXPERIENCE MANAGEMENT MARKET, BY VERTICAL,  2023–2028 (USD MILLION)
                       13.2.2.5 Customer experience management market, by region
                                   TABLE 298 CUSTOMER EXPERIENCE MANAGEMENT MARKET, BY REGION,  2017–2022 (USD MILLION)
                                   TABLE 299 CUSTOMER EXPERIENCE MANAGEMENT MARKET, BY REGION,  2023–2028 (USD MILLION)
     13.3 SUPPLY CHAIN ANALYTICS MARKET - GLOBAL FORECAST TO 2027 
             13.3.1 MARKET DEFINITION
             13.3.2 MARKET OVERVIEW
                       13.3.2.1 Supply chain analytics market, by component
                                   TABLE 300 SUPPLY CHAIN ANALYTICS MARKET, BY COMPONENT, 2016–2021 (USD MILLION)
                                   TABLE 301 SUPPLY CHAIN ANALYTICS MARKET, BY COMPONENT, 2022–2027 (USD MILLION)
                       13.3.2.2 Supply chain analytics market, by service
                                   TABLE 302 SUPPLY CHAIN ANALYTICS MARKET, BY SERVICE, 2016–2021 (USD MILLION)
                                   TABLE 303 SUPPLY CHAIN ANALYTICS MARKET, BY SERVICE, 2022–2027 (USD MILLION)
                       13.3.2.3 Supply chain analytics market, by deployment mode
                                   TABLE 304 SUPPLY CHAIN ANALYTICS MARKET, BY DEPLOYMENT MODE, 2016–2021 (USD MILLION)
                                   TABLE 305 SUPPLY CHAIN ANALYTICS MARKET, BY DEPLOYMENT MODE, 2022–2027 (USD MILLION)
                       13.3.2.4 Supply chain analytics market, by organization size
                                   TABLE 306 SUPPLY CHAIN ANALYTICS MARKET, BY ORGANIZATION SIZE, 2016–2021 (USD MILLION)
                                   TABLE 307 SUPPLY CHAIN ANALYTICS MARKET, BY ORGANIZATION SIZE, 2022–2027 (USD MILLION)
                       13.3.2.5 Supply chain analytics market, by vertical
                                   TABLE 308 SUPPLY CHAIN ANALYTICS MARKET, BY VERTICAL, 2016–2021 (USD MILLION)
                                   TABLE 309 SUPPLY CHAIN ANALYTICS MARKET, BY VERTICAL, 2022–2027 (USD MILLION)
                       13.3.2.6 Supply chain analytics market, by region
                                   TABLE 310 SUPPLY CHAIN ANALYTICS MARKET, BY REGION, 2016–2021 (USD MILLION)
                                   TABLE 311 SUPPLY CHAIN ANALYTICS MARKET, BY REGION, 2022–2027 (USD MILLION)
 
14 APPENDIX (Page No. - 309)
     14.1 DISCUSSION GUIDE 
     14.2 KNOWLEDGESTORE: MARKETSANDMARKETS’  SUBSCRIPTION PORTAL 
     14.3 CUSTOMIZATION OPTIONS 
     14.4 RELATED REPORTS 
     14.5 AUTHOR DETAILS 

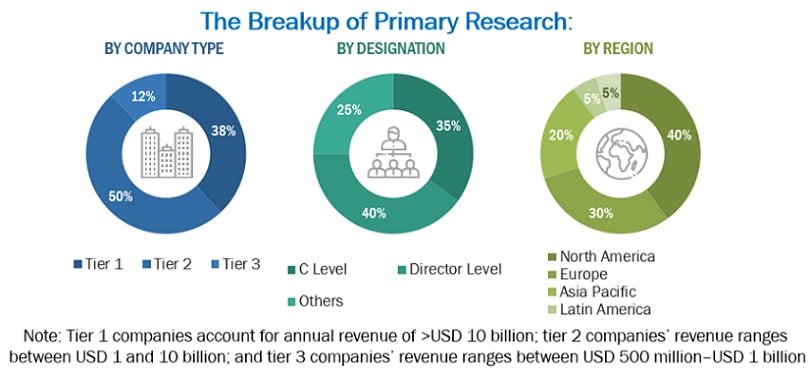
The retail analytics market research study involved extensive secondary sources, directories, journals, and paid databases. Primary sources were mainly industry experts from the core and related industries, preferred retail analytics providers, third-party service providers, consulting service providers, end users, and other commercial enterprises. In-depth interviews were conducted with various primary respondents, including key industry participants and subject matter experts, to obtain and verify critical qualitative and quantitative information, and assess the market’s prospects.

Secondary Research

In the secondary research process, various sources were referred to, for identifying and collecting information for this study. Secondary sources included annual reports, press releases, and investor presentations of companies; white papers, journals, and certified publications; and articles from recognized authors, directories, and databases. The data was also collected from other secondary sources, such as journals, government websites, blogs, and vendors' websites. Additionally, retail analytics spending of various countries were extracted from the respective sources. Secondary research was mainly used to obtain key information related to the industry’s value chain and supply chain to identify key players based on software, services, market classification, and segmentation according to offerings of major players, industry trends related to software, services, deployment modes, business function, application, end user, and regions, and key developments from both market- and technology-oriented perspectives.

Primary Research

In the primary research process, various primary sources from both the supply and demand sides were interviewed to obtain qualitative and quantitative information on the market. The primary sources from the supply side included various industry experts, including Chief Experience Officers (CXOs); Vice Presidents (VPs); directors from business development, marketing, and retail analytics expertise; related key executives from retail analytics solution vendors, SIs, professional service providers, and industry associations; and key opinion leaders.

Primary interviews were conducted to gather insights, such as market statistics, revenue data collected from software and services, market breakups, market size estimations, market forecasts, and data triangulation. Primary research also helped understand various trends related to technologies, applications, deployments, and regions. Stakeholders from the demand side, such as Chief Information Officers (CIOs), Chief Technology Officers (CTOs), Chief Strategy Officers (CSOs), and end users using retail analytics solutions, were interviewed to understand the buyer’s perspective on suppliers, products, service providers, and their current usage of retail analytics software and services, which would impact the overall retail analytics market.
Retail Analytics  Market Size, and Share

To know about the assumptions considered for the study, download the pdf brochure

Market Size Estimation

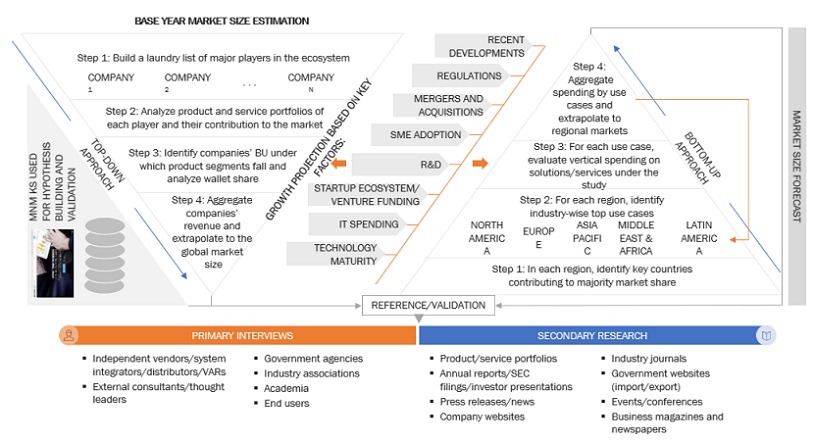
In the bottom-up approach, the adoption rate of retail analytics solutions and services among different end users in key countries concerning their regions contributing the most to the market share was identified. For cross-validation, the adoption of retail analytics solutions and services among industries and different use cases concerning their regions was identified and extrapolated. Weightage was given to use cases identified in different regions for the market size calculation.

Based on the market numbers, the regional split was determined by primary and secondary sources. The procedure included the analysis of the retail analytics market’s regional penetration. Based on secondary research, the regional spending on Information and Communications Technology (ICT), socio-economic analysis of each country, strategic vendor analysis of major retail analytics providers, and organic and inorganic business development activities of regional and global players were estimated. With the data triangulation procedure and data validation through primaries, the exact values of the overall retail analytics market size and segments’ size were determined and confirmed using the study.

Global Retail Analytics Market Size: Bottom-Up and Top-Down Approach:
Retail Analytics  Market Bottom Up and Top Down Approach

To know about the assumptions considered for the study, Request for Free Sample Report

Data Triangulation

Based on the market numbers, the regional split was determined by primary and secondary sources. The procedure included the analysis of the retail analytics market’s regional penetration. Based on secondary research, the regional spending on Information and Communications Technology (ICT), socio-economic analysis of each country, strategic vendor analysis of major retail analytics providers, and organic and inorganic business development activities of regional and global players were estimated. With the data triangulation procedure and data validation through primaries, the exact values of the overall retail analytics market size and segments’ size were determined and confirmed using the study.

Market Definition

Retail analytics involves using software to collect and analyze data from physical, online, and catalog outlets to provide retailers with insights into customer behavior and shopping trends. It can also be used to inform and improve decisions about pricing, inventory, marketing, merchandising, and store operations by applying predictive algorithms against data from both internal sources (such as customer purchase histories) and external repositories (such as weather forecasts).

STAKEHOLDERS

  • Application design and software developers
  • Retail analytics vendors
  • Business analysts
  • Cloud service providers
  • Consulting service providers
  • Data scientists
  • Distributors and Value-added Resellers (VARs)
  • Government agencies
  • Independent Software Vendors (ISV)
  • Market research and consulting firms
  • Support and maintenance service providers
  • System Integrators (SIs)/migration service providers
  • Technology providers
  • Value-added resellers (VARs)

Report Objectives

  • To define, describe, and predict the retail analytics market by offering (software and services), business function, application, end user, and region
  • To provide detailed information related to major factors (drivers, restraints, opportunities, and industry-specific challenges) influencing the market growth
  • To analyze the micro markets with respect to individual growth trends, prospects, and their contribution to the total market
  • To analyze the opportunities in the market for stakeholders by identifying the high-growth segments of the retail analytics market
  • To analyze opportunities in the market and provide details of the competitive landscape for stakeholders and market leaders
  • To forecast the market size of segments for five main regions: North America, Europe, Asia Pacific, Middle East & Africa, and Latin America
  • To profile key players and comprehensively analyze their market rankings and core competencies.
  • To analyze competitive developments, such as partnerships, new product launches, and mergers and acquisitions, in the retail analytics market
  • To analyze the impact of recession across all the regions across the retail analytics market

Available Customizations

With the given market data, MarketsandMarkets offers customizations as per your company’s specific needs. The following customization options are available for the report:

Product Analysis

  • Product quadrant, which gives a detailed comparison of the product portfolio of each company.

Geographic Analysis

  • Further breakup of the North American retail analytics market
  • Further breakup of the European market
  • Further breakup of the Asia Pacific market
  • Further breakup of the Middle Eastern & African market
  • Further breakup of the Latin America retail analytics market

Company Information

  • Detailed analysis and profiling of additional market players (up to five)
Custom Market Research Services

We will customize the research for you, in case the report listed above does not meet with your exact requirements. Our custom research will comprehensively cover the business information you require to help you arrive at strategic and profitable business decisions.

Request Customization
Report Code
TC 2663
Published ON
Mar, 2024
Choose License Type
BUY NOW
  • SHARE
X
Request Customization
Speak to Analyst
Speak to Analyst
OR FACE-TO-FACE MEETING
PERSONALIZE THIS RESEARCH
  • Triangulate with your Own Data
  • Get Data as per your Format and Definition
  • Gain a Deeper Dive on a Specific Application, Geography, Customer or Competitor
  • Any level of Personalization
REQUEST A FREE CUSTOMIZATION
LET US HELP YOU!
  • What are the Known and Unknown Adjacencies Impacting the Retail Analytics Market
  • What will your New Revenue Sources be?
  • Who will be your Top Customer; what will make them switch?
  • Defend your Market Share or Win Competitors
  • Get a Scorecard for Target Partners
CUSTOMIZED WORKSHOP REQUEST
+1-888-600-6441
  • Call Us
  • +1-888-600-6441 (Corporate office hours)
  • +1-888-600-6441 (US/Can toll free)
  • +44-800-368-9399 (UK office hours)
CONNECT WITH US
ABOUT TRUST ONLINE
©2024 MarketsandMarkets Research Private Ltd. All rights reserved
DMCA.com Protection Status Website Feedback