RF Semiconductor Market by Device (Filter, Power Amplifier, Switch, Low Noise Amplifier), Frequency Band, Material (GaAs, GaN, Si) Application (Consumer Devices, Automotive, Telecommunication, Aerospace & Defense), and Region - Global Forecast to 2025


The RF Semiconductor Market is projected to grow from USD 17.4 billion in 2020 to USD 26.2 billion in 2025, at a CAGR of 8.5% between 2020-2025. RF semiconductor devices are used to convert low-power radio frequency signals to high-power signals. The RF semiconductor market includes devices such as power amplifiers, filters, switches, and low noise amplifiers. RF devices are made up of materials such as silicon, silicon germanium, gallium arsenide, gallium nitride, and indium phosphide.

RF Power Semiconductor Market Forecast to 2025
To know about the assumptions considered for the study, Request for Free Sample Report
RF devices include filters, power amplifiers, switches, low noise amplifiers, and others. By material segment comprises of gallium arsenide & piezoelectric substrate, silicon, silicon germanium, gallium nitride, and indium phosphide. By frequency band comprises of very high frequency (VHF) & ultra-high frequency (UHF), super high frequency (SHF), and extremely high frequency (EHF). RF semiconductor market, by voltage upto 5 V; 5.1-20 V and above 20 V. These semiconductor devices serve various applications such as aerospace & defense, automotive, consumer devices, telecommunication, CATV & broadband, and others.
RF Semiconductor Market Dynamics:
Driver: Increasing penetration of LTE and advanced technologies
This increasing penetration of LTE technology has led to an increase in demand for high-efficiency RF devices, particularly from developing countries such as India. This is expected to drive the market for RF semiconductors in developing countries across the world. Also, advanced technologies, such as 5G, are trending in developed countries such as the US and Japan. According to a 2019 report by the GSM Association, the 5G penetration in North America will reach ~47% by 2025, while that of Europe will be ~29%..
Restraint: Increasing cost of RF devices with performance improvement
The use of alternative materials such as gallium arsenide or gallium nitride improves the efficiency of the devices, but it also increases the cost of the RF devices. The use of gallium nitride for manufacturing RF devices helps to increase the efficiency and performance of devices, particularly at high frequencies, but they are expensive as compared to silicon-based RF devices. Therefore, high cost is one of the major factors expected to restrain the growth of the RF semiconductor market across the globe.
Opportunity: Increasing application of RF energy
Due to the growing demand and integration of optoelectronic components with various consumer devices, manufacturers and various R&D communities have become more focused on research & development to develop new technologies. These companies and communities are investing in optical and optoelectronic technologies for next-generation communication networks and high-speed optical computing. Research divisions are also trying to make functional elements by optimally combining materials and devices to perform advanced functions for use in various photonics systems.
Challenge: Regulatory barriers
RF energy applications have seen an increase in recent years. These applications utilize controlled electromagnetic radiation to heat products or to control all kinds of processes. RF energy applications majorly include automotive ignition, industrial cooking, industrial drying, and medical resonance imaging (MRI). In majority of the RF energy applications, RF power amplifiers are used. Increasing demand for MRI systems due to the increasing geriatric population and the rising awareness of early diagnosis is expected to propel the demand for RF semiconductor devices.
RF Semiconductor Market Segment Insights:

Based on application, the consumer electronics segment to dominate the RF semiconductor market during the forecast years
The consumer electronics industry is one of the leading markets for RF semiconductors. Consumer devices include communication devices such as smartphones, tablets and laptops, and Wi-Fi devices. The growing use of smartphones and demand for high-speed data are the major drivers for the consumer electronics industry in the RF semiconductor market. The growth of LTE is also one of the major drivers for the growth of the RF semiconductor market. The increasing adoption of RF filters in various high-end mobile phones, tablets, laptops, PCs, and other consumer electronic devices is another factor driving the growth of the RF semiconductor market for the consumer devices application.
Regional Insights:
The European region is projected to grow at the third highest CAGR during the forecast period
Europe. Europe has taken significant steps to lead global developments toward 5G technology. The European Commission identifies the 5G standards as one of the 5 priority areas under the recently launched Digitizing European Industry initiative and has allocated public funding of EUR 700 million (~USD 775 million) through the Horizon 2020 Program to accelerate research and innovation in 5G technology. These factors are expected to drive the market for RF semiconductors in Europe. NXP Semiconductors is one of the major players in the European RF semiconductor market.

RF Power Semiconductor Market by Region
To know about the assumptions considered for the study, download the pdf brochure
Key Market Players:
Some of the Major players in the RF Semiconductor Market are Qorvo - Qorvo (US); Skyworks (US), Qualcomm (US), Analog Devices (US) and NXP� Semiconductors (Netherlands). These players have adopted various growth strategies such as contracts, joint ventures, partnerships & agreements, acquisitions, and new product launches to expand their presence in the RF Semiconductor Market.
Qorvo (US) is among the leading suppliers of RF solutions with broad product portfolio serving defense, base station, Wi-Fi customer premises equipment, automotive, and smart home IoT applications. The company is a major supplier of GaN-based products to the global defense and aerospace serving the US government through contracts with the Defense Advanced Research Project Agency, the Air Force Research Laboratory, and the Office of Naval Research. It is also helping the industry with the ongoing 5G field trials with its current product portfolio. Qorvo has widespread presence across the world with engineering and manufacturing facilities located in North America, Europe, and Asia. It also has global sales and engineering support network to serve its customers efficiently. The company is developing and investing in GaN process technologies for manufacturing new GaN-based products exploiting GaN�s performance advantages.
Skyworks (US) is focused on wireless infrastructure applications. The company is expected to focus on IoT and 5G technologies that support wireless connectivity to a large extent. It is expected to make strategic investments and partnerships to accelerate the deployment of 5G technology; for this, the company has launched the Sky5 platform, specifically focused on empowering revolutionary 5G communications. The company has a major focus on the launching of RF-based devices, thus planning to conquer the opportunities in the telecommunications sector. It launched Sky5, to empower the 5G revolution, thus launching various products for 5G applications. The company is planning to further expand its product portfolio for high bandwidth applications in fast-growing sectors such as automotive, connected home, and IoT.
Get online access to the report on the World's First Market Intelligence Cloud
- Easy to Download Historical Data & Forecast Numbers
- Company Analysis Dashboard for high growth potential opportunities
- Research Analyst Access for customization & queries
- Competitor Analysis with Interactive dashboard
- Latest News, Updates & Trend analysis
Request Sample Scope of the Report
:
Get online access to the report on the World's First Market Intelligence Cloud
- Easy to Download Historical Data & Forecast Numbers
- Company Analysis Dashboard for high growth potential opportunities
- Research Analyst Access for customization & queries
- Competitor Analysis with Interactive dashboard
- Latest News, Updates & Trend analysis

|
Report Metric |
Details |
|
Market size available for years |
2017�2025 |
|
Base year |
2019 |
|
Forecast period |
2020�2025 |
|
Units |
Value (USD) |
|
Segments covered |
Device, Frequency Band, Material, and Application |
|
Geographic regions covered |
North America, APAC, Europe, and RoW |
|
Companies covered |
Qorvo (US), Skyworks (US), Analog Devices (US), Qualcomm (US), NXP Semiconductors (Netherlands), Cree (US), MACOM (US), Microchip Technology (US), Murata Manufacturing (Japan), Texas Instruments (US), Maxim Integrated (US), Mercury Systems (US), ON Semiconductor (US), RFHIC (South Korea), RichWave (Taiwan), STMicroelectronics (Switzerland), Sumitomo Electric Drives Innovations (Japan), TDK Electronics (Germany), Teledyne (US), and Toshiba (Japan) A total of 20 players are covered. |
This report categorizes the RF semiconductor market based on device, frequency band, material, application, and region.
By Device:
- Power Amplifier
- Filter
- Switch
- Low Noise Amplifier
- Others (Phase Shifters, Oscillators, Attenuators, Couplers, and Antenna Tuners)
By Frequency Band:
- VHF & UHF
- SHF
- EHF
By Material:
- Silicon (Si)
- Silicon-Germanium (SiGe)
- Gallium Arsenide (GaAs) & Piezoelectric Substrate
- Gallium Nitride (GaN)
- Indium Phosphide (InP)
By Application:
- Consumer Devices
- Telecommunication
- Aerospace & Defense
- Automotive
- CATV & Wired Broadband
- Others (RF Energy, and Test & Measurement)
By Region:
- North America
- US
- Mexico
- Canada
- Europe
- UK
- Germany
- France
- Italy
- Rest of Europe
- APAC
- China
- Japan
- South Korea
- Rest of APAC
- RoW
- Middle East & Africa
- South America
RF Power Semiconductor Market Highlights:

What is new?
- Major developments that can change the business landscape as well as market forecasts.
The demand for gallium nitride (GaN)-based RF devices is on the rise as these devices provide enhanced performance with better power densities in systems such as missile defense, radar, and infrastructure equipment. These devices are replacing silicon-based devices in wireless base stations. GaN technology is increasingly implemented in base stations as it�s a wide-bandgap technology and thus is faster and delivers higher breakdown voltage than silicon and other compound semiconductors. GaN-based RF devices are considered to be an ideal choice for 5G and advanced 4G systems as they operate better at higher frequency ranges.
- Addition/refinement in segmentation�Increase the depth or width of market segmentation.
- Filter
- Power Amplifier
- Switch
- Low Noise Amplifier
- Others
- VHF and UHF
- SHF
- EHF
- Gallium Arsenide and Piezoelectric Substrate
- Silicon
- Silicon Germanium
- Gallium Nitride
- Indium Phosphide
- Upto 5V
- 5.1-20V
- Above 20V
- Consumer Devices
- Telecommunication
- Aerospace & Defense
- Automotive
- CATV & wired broadband
- Others
- Inclusion of new players and change in the market share of existing players � RF Semiconductor Market
Company profiles: Company profiles give a glimpse of the key players in the market with respect to their business overviews, financials, product offerings, recent developments undertaken by them, and MnM view. In the new edition of the report, we have a total of 25 players (15 major, 10 Startups/SME). Moreover, the share of companies operating in the RF Semiconductor Market and start-up matrix have also been provided in the report.
- Updated financial information and product portfolios of players operating in the RF Semiconductor Market
Newer and improved representation of financial information: The latest edition of the report provides updated financial information in the RF Semiconductor Market till 2020/2019 for each listed company in the graphical representation in a single diagram (instead of multiple tables). This would help to easily analyze the present status of profiled companies in terms of their financial strength, profitability, key revenue-generating region/country, business segment focus in terms of the highest revenue-generating segment, and investment in research and development activities.
- Recent market developments of the profiled players
Recent Developments: Updated market developments such as contracts, joint ventures, partnerships & agreements, acquisitions, new product launches, investments, funding, and certification have been mapped for 2018 to 2020.
The edition of the report consists of trends/disruptions in customer business, tariff & regulatory landscape, pricing analysis, and a market ecosystem map to better understand RF Semiconductor market dynamics.
Recent Developments
- In February 2020, Qorvo, announced the completion of its acquisition of Custom MMIC, a leading supplier of high-performance GaAs and GaN monolithic microwave integrated circuits (MMICs) for defense, aerospace, and commercial applications. This acquisition is expected to enhance the company�s offerings for aerospace & defense applications.
- In June 2019, Skyworks, launched 2 power amplifiers for applications in the aerospace & defense industry. The SKYH22001 and SKY22002 are internally tuned for 700 MHz to 2.7 GHz frequency range and are tunable up to 6 GHz.
Frequently Asked Questions (FAQ)
What is the current size of the RF Semiconductor Market?
The RF Semiconductor Market is projected to grow to USD 17.4 billion in 2020 to USD 26.2 Billion by 2025, at a CAGR of 8.5% between 2020-2025.
Who are the winners in the RF Semiconductor Market?
Qorvo (US); Skyworks (US); Qualcomm (US); Analog Devices (US); NXP Semiconductors (Netherlands).
What are some of the challenges faced by the market?
Design challenges for RF devices at higher frequency is one major challenge faced by the RF Semiconductor market.
What are the factors driving the growth of the market?
Increasing demand of RF devices for smartphones
Increasing importance of advanced RF devices in radar and electronic warfare devices are some of the factors driving the growth of the market.
To speak to our analyst for a discussion on the above findings, click Speak to Analyst
TABLE OF CONTENTS
1 INTRODUCTION (Page No. - 1)
1.1 STUDY OBJECTIVES
1.2 MARKET DEFINITION AND SCOPE
1.3 INCLUSIONS AND EXCLUSIONS
1.4 STUDY SCOPE
1.4.1 MARKETS COVERED
1.4.2 YEARS CONSIDERED
1.5 CURRENCY
1.6 LIMITATIONS
1.7 STAKEHOLDERS
2 RESEARCH METHODOLOGY (Page No. - 5)
2.1 RESEARCH DATA
2.1.1 SECONDARY DATA
2.1.1.1 Secondary sources
2.1.2 PRIMARY DATA
2.1.2.1 Breakdown of primaries
2.1.2.2 Key data from primary sources
2.1.2.3 Key industry insights
2.2 MARKET SIZE ESTIMATION
2.2.1 BOTTOM-UP APPROACH
2.2.1.1 Approach for capturing market size by bottom-up analysis (demand side)
2.2.2 TOP-DOWN APPROACH
2.2.2.1 Approach for capturing market size by top-down analysis (supply side)
2.3 MARKET BREAKDOWN AND DATA TRIANGULATION
2.4 RESEARCH ASSUMPTIONS
3 EXECUTIVE SUMMARY (Page No. - 16)
4 PREMIUM INSIGHTS (Page No. - 20)
4.1 ATTRACTIVE OPPORTUNITIES IN RF SEMICONDUCTOR MARKET
4.2 MARKET IN APAC, BY DEVICE AND APPLICATION
4.3 MARKET, BY FREQUENCY BAND
4.4 COUNTRY-WISE RF SEMICONDUCTOR MARKET GROWTH RATE
5 MARKET OVERVIEW (Page No. - 23)
6 RF SEMICONDUCTOR MARKET, BY DEVICE (Page No. - 30)
6.1 INTRODUCTION
6.2 FILTER & DUPLEXER
1.2.1 FILTERS TO HOLD LARGEST MARKET SHARE DURING FORECAST PERIOD
6.3 POWER AMPLIFIER
1.3.1 GAN-BASED POWER AMPLIFIERS FIND INCREASING APPLICATIONS IN BASE STATIONS
6.4 SWITCH
6.4.1 TECHNOLOGICAL ADVANCEMENTS IN TELECOM INDUSTRY TO DRIVE MARKET GROWTH
6.5 LOW NOISE AMPLIFIER
6.5.1 LOW NOISE AMPLIFIER FINDS INCREASED APPLICATIONS IN AEROSPACE & DEFENSE, AUTOMOTIVE, CONSUMER DEVICES, AND TELECOMMUNICATION
6.6 OTHERS (OSCILLATORS, ATTENUATORS, ANTENNA TUNERS, PHASE SHIFTERS, AND COUPLERS)
7 RF SEMICONDUCTOR MARKET, BY FREQUENCY BAND (Page No. - 41)
7.1 INTRODUCTION
7.2 VHF AND UHF
7.2.1 VHF & UHF FREQUENCY BANDS ARE AMONG MOST IMPORTANT FREQUENCY BANDS FOR MODERN WIRELESS COMMUNICATION SYSTEMS
7.3 SHF
7.3.1 SHF FREQUENCY BAND IS EXPECTED TO GROW AT HIGHEST CAGR DURING FORECAST PERIOD
7.4 EHF
7.4.1 EHF FREQUENCY BAND IS HIGHEST AVAILABLE FREQUENCY BAND IN RF SPECTRUM
8 RF SEMICONDUCTOR MARKET, BY MATERIAL (Page No. - 47)
8.1 INTRODUCTION
8.2 GALLIUM ARSENIDE (GaAs) AND PIEZOELECTRIC SUBSTRATE
8.2.1 GALLIUM ARSENIDE HAS MAJOR APPLICATIONS IN SMARTPHONES
8.3 SILICON (Si)/LDMOS
8.3.1 SILICON DEVICES ARE LEAST EXPENSIVE TO MANUFACTURE AS COMPARED TO OTHER DEVICES
8.4 SILICON GERMANIUM (SiGe)
8.4.1 SILICON GERMANIUM-BASED RF DEVICES FIND APPLICATIONS IN CONSUMER DEVICES, TELECOMMUNICATION, AND CATV & WIRED BROADBAND
8.5 GALLIUM NITRIDE (GaN) and GaN-on-SiC
8.5.1 MARKET FOR GALLIUM NITRIDE-BASED RF DEVICES EXPECTED TO GROW AT HIGHEST CAGR DURING FORECAST PERIOD
8.6 INDIUM PHOSPHIDE (InP)
8.6.1 InP OFFERS AN ALTERNATIVE TO GAAS IN PROVIDING INCREASED PERFORMANCE AT HIGHER PERFORMANCE WITH LOWER POWER CONSUMPTION
9 RF SEMICONDUCTOR, BY OPERATING VOLTAGE (Page No. - 54)
9.1 INTRODUCTION
9.2 UP TO 5 V
9.3 5.1 TO 20 V
9.4 ABOVE 20 V
10 RF SEMICONDUCTOR MARKET, BY APPLICATION (Page No. - 56)
10.1 INTRODUCTION
10.2 CONSUMER DEVICES
10.2.1 SMARTPHONES
10.2.1.1 Increasing adoption of smartphones and increasing RF components in smartphones drives market growth
10.2.2 LAPTOPS & TABLETS
10.2.2.1 Increasing adoption of GaAs-based RF devices in laptops and tablets to drive market
10.3 TELECOMMUNICATION
10.3.1.1 Telecommunication infrastructure expected to provide opportunities for GaN RF devices
10.4 AEROSPACE & DEFENSE AND SATCOM
10.4.1 RADAR
10.4.1.1 Increasing importance of advanced radar systems for aerospace & defense applications to drive market
10.4.2 ELECTRONIC WARFARE
10.4.2.1 Growing usage of RF jammers in military installations to drive market growth
10.5 AUTOMOTIVE
10.5.1 INCREASING ADOPTION OF ADAS SYSTEMS IN VEHICLES TO CREATE OPPORTUNITIES FOR RF MARKET
10.6 CATV & WIRED BROADBAND
10.6.1 CATV & WIRED BROADBAND NETWORKS ARE INCREASINGLY OPERATING IN FULLY-LOADED SPECTRUM
10.7 OTHERS
10.7.1 RF ENERGY
10.7.2 TEST & MEASUREMENT
11 GEOGRAPHIC ANALYSIS (Page No. - 68)
11.1 INTRODUCTION
11.2 NORTH AMERICA
11.2.1 US
11.2.1.1 US held largest share in North American RF semiconductor market
11.2.2 CANADA
11.2.2.1 Increasing investments in defense application to drive market in Canada
11.2.3 MEXICO
11.2.3.1 Growing demand for smartphones to drive market growth
11.3 EUROPE
11.3.1 UK
11.3.1.1 UK expected to grow at highest CAGR during forecast period
11.3.2 GERMANY
11.3.2.1 Growing investments in automotive sector to drive market in Germany
11.3.3 FRANCE
11.3.3.1 Development of infrastructure to support 5G technology expected to propel market
11.3.4 ITALY
11.3.4.1 Increasing penetration of broadband subscriptions to drive market growth
11.3.5 REST OF EUROPE
11.3.5.1 Rest of Europe held a significant market share of market
11.4 ASIA PACIFIC (APAC)
11.4.1 CHINA
11.4.1.1 China to hold largest market share in APAC RF semiconductor market
11.4.2 JAPAN
11.4.2.1 Ongoing implementation of 5G services in Japan to drive market
11.4.3 SOUTH KOREA
11.4.3.1 Increasing penetration of 5G technology and growing subscribers onto 5G network to drive market in South Korea
11.4.4 REST OF APAC
11.4.4.1 Rest of APAC presents an attractive opportunity for market players
11.5 REST OF THE WORLD (ROW)
11.5.1 SOUTH AMERICA
11.5.1.1 Growing penetration of LTE technology in Brazil to drive market
11.5.2 MIDDLE EAST AND AFRICA
11.5.2.1 Growing demand for broadband communication to drive market in Middle East & Africa
12 COMPANY PROFILES (Page No. - 111)
12.1 KEY PLAYERS
12.1.1 QORVO
12.1.1.1 Business overview
12.1.1.2 Products offered
12.1.1.3 Recent developments
12.1.1.4 SWOT analysis
12.1.1.5 MnM view
12.1.2 SKYWORKS
12.1.2.1 Business overview
12.1.2.2 Products offered
12.1.2.3 Recent developments
12.1.2.4 SWOT analysis
12.1.2.5 MnM view
12.1.3 QUALCOMM
12.1.3.1 Business overview
12.1.3.2 Products offered
12.1.3.3 Recent developments
12.1.3.4 SWOT analysis
12.1.3.5 MnM view
12.1.4 ANALOG DEVICES
12.1.4.1 Business overview
12.1.4.2 Products offered
12.1.4.3 Recent developments
12.1.4.4 SWOT analysis
12.1.4.5 MnM view
12.1.5 NXP SEMICONDUCTORS
12.1.5.1 Business overview
12.1.5.2 Products offered
12.1.5.3 Recent developments
12.1.5.4 SWOT analysis
12.1.5.5 MnM view
12.1.6 CREE
12.1.6.1 Business overview
12.1.6.2 Products offered
12.1.6.3 Recent developments
12.1.7 MACOM
12.1.7.1 Business overview
12.1.7.2 Products offered
12.1.7.3 Recent developments
12.1.8 MICROCHIP TECHNOLOGY
12.1.8.1 Business overview
12.1.8.2 Products offered
12.1.8.3 Recent developments
12.1.9 MURATA MANUFACTURING
12.1.9.1 Business overview
12.1.9.2 Products offered
12.1.9.3 Recent developments
12.1.10 TEXAS INSTRUMENTS
12.1.10.1 Business overview
12.1.10.2 Products offered
12.1.10.3 Recent developments
12.2 RIGHT TO WIN
12.3 OTHER PLAYERS
12.3.1 MAXIM INTEGRATED
12.3.2 MERCURY SYSTEMS
12.3.3 MITSUBISHI ELECTRIC
12.3.4 ON SEMICONDUCTOR
12.3.5 RFHIC
12.3.6 RICHWAVE
12.3.7 STMICROELECTRONICS
12.3.8 SUMITOMO ELECTRIC DRIVE INNOVATIONS
12.3.9 TDK ELECTRONICS
12.3.10 TELEDYNE
12.3.11 TOSHIBA
13 APPENDIX (Page No. - 144)
13.1 DISCUSSION GUIDE
13.2 KNOWLEDGE STORE: MARKETSANDMARKETS� SUBSCRIPTION PORTAL
13.3 AVAILABLE CUSTOMIZATIONS
13.4 RELATED REPORTS
LIST OF TABLES (104 Tables)
TABLE 1 RF SEMICONDUCTOR MARKET, BY DEVICE, 2017�2025 (USD MILLION)
TABLE 2 MARKET FOR FILTER, BY APPLICATION 2017�2025 (USD MILLION)
TABLE 3 MARKET FOR FILTER, BY FREQUENCY, 2017�2025 (USD MILLION)
TABLE 4 MARKET FOR FILTER, BY REGION, 2017�2025 (USD MILLION)
TABLE 5 MARKET FOR POWER AMPLIFIER, BY APPLICATION, 2017�2025 (USD MILLION)
TABLE 6 MARKET FOR POWER AMPLIFIER, BY FREQUENCY, 2017�2025 (USD MILLION)
TABLE 7 MARKET FOR POWER AMPLIFIER, BY REGION, 2017�2025 (USD MILLION)
TABLE 8 MARKET FOR SWITCH, BY APPLICATION, 2017�2025 (USD MILLION)
TABLE 9 MARKET FOR SWITCH, BY FREQUENCY, 2017�2025 (USD MILLION)
TABLE 10 MARKET FOR SWITCH, BY REGION, 2017�2025 (USD MILLION)
TABLE 11 MARKET FOR LOW NOISE AMPLIFIER, BY APPLICATION, 2017�2025 (USD MILLION)
TABLE 12 MARKET FOR LOW NOISE AMPLIFIER, BY FREQUENCY, 2017�2025 (USD MILLION)
TABLE 13 MARKET FOR LOW NOISE AMPLIFIER, BY REGION, 2017�2025 (USD MILLION)
TABLE 14 MARKET FOR OTHER DEVICES, BY APPLICATION, 2017�2025 (USD MILLION)
TABLE 15 MARKET FOR OTHER DEVICES, BY FREQUENCY, 2017�2025 (USD MILLION)
TABLE 16 MARKET FOR OTHER DEVICES, BY REGION, 2017�2025 (USD MILLION)
TABLE 17 MARKET, BY FREQUENCY BAND, 2017�2025 (USD MILLION)
TABLE 18 MARKET FOR VHF AND UHF FREQUENCY BAND, BY DEVICE, 2017�2025 (UD MILLION)
TABLE 19 MARKET FOR VHF AND UHF FREQUENCY BANDS BY REGION, 2017�2025 (USD MILLION)
TABLE 20 MARKET FOR SHF FREQUENCY BAND, BY DEVICE, 2017�2025 (USD MILLION)
TABLE 21 MARKET FOR SHF FREQUENCY BAND BY REGION, 2017�2025 (USD MILLION)
TABLE 22 MARKET FOR EHF FREQUENCY BAND, BY DEVICE, 2017�2025 (USD MILLION)
TABLE 23 MARKET FOR EHF FREQUENCY BAND BY REGION, 2017�2025 (USD MILLION)
TABLE 24 MARKET, BY MATERIAL 2017�2025 (USD MILLION)
TABLE 25 MARKET FOR GALLIUM ARSENIDE (GaAs) AND PIEZOELECTRIC SUBSTRATE, BY REGION, 2017�2025 (USD MILLION)
TABLE 26 MARKET FOR SILICON (Si), BY REGION, 2017�2025 (USD MILLION)
TABLE 27 MARKET FOR SILICON GERMANIUM (SiGe), BY REGION, 2017�2025 (USD MILLION)
TABLE 28 MARKET FOR GALLIUM NITRIDE (GaN), BY REGION, 2017�2025 (USD MILLION)
TABLE 29 MARKET FOR INDIUM PHOSPHIDE (InP), BY REGION, 2017�2025 (USD MILLION)
TABLE 30 RF SEMICONDUCTOR DEVICES WITH OPERATING VOLTAGE UP TO 5 V
TABLE 31 RF SEMICONDUCTOR DEVICES WITH OPERATING VOLTAGE FROM 5.1 TO 20 V
TABLE 32 RF SEMICONDUCTOR DEVICES WITH OPERATING VOLTAGE ABOVE 20 V
TABLE 33 RF SEMICONDUCTOR MARKET, BY APPLICATION, 2017�2025 (USD MILLION)
TABLE 34 MARKET FOR CONSUMER DEVICES, BY DEVICE, 2017�2025 (USD MILLION)
TABLE 35 MARKET FOR CONSUMER DEVICES, BY REGION, 2017�2025 (USD MILLION)
TABLE 36 MARKET FOR TELECOMMUNICATION, BY DEVICE, 2017�2025 (USD MILLION)
TABLE 37 MARKET FOR TELECOMMUNICATION, BY REGION, 2017�2025 (USD MILLION)
TABLE 38 MARKET FOR AEROSPACE & DEFENCE, BY DEVICE, 2017�2025 (USD MILLION)
TABLE 39 MARKET FOR AEROSPACE & DEFENCE, BY REGION, 2017�2025 (USD MILLION)
TABLE 40 MARKET FOR AUTOMOTIVE, BY DEVICE, 2017�2025 (USD MILLION)
TABLE 41 MARKET FOR AUTOMOTIVE, BY REGION, 2017�2025 (USD MILLION)
TABLE 42 MARKET FOR CATV & WIRED BROADBAND, BY DEVICE, 2017�2025 (USD MILLION)
TABLE 43 MARKET FOR CATV & WIRED BROADBAND, BY REGION, 2017�2025 (USD MILLION)
TABLE 44 MARKET FOR OTHER APPLICATIONS, BY DEVICE, 2017�2025 (USD MILLION)
TABLE 45 MARKET FOR OTHER APPLICATIONS, BY REGION, 2017�2025 (USD MILLION)
TABLE 46 MARKET, BY REGION, 2017�2025 (USD MILLION)
TABLE 47 MARKET IN NORTH AMERICA, BY COUNTRY, 2017�2025 (USD MILLION)
TABLE 48 MARKET IN NORTH AMERICA, BY DEVICE, 2017�2025 (USD MILLION)
TABLE 49 MARKET IN NORTH AMERICA, BY FREQUENCY BAND, 2017�2025 (USD MILLION)
TABLE 50 MARKET IN NORTH AMERICA, BY MATERIAL, 2017�2025 (USD MILLION)
TABLE 51 MARKET IN NORTH AMERICA, BY APPLICATION, 2017�2025 (USD MILLION)
TABLE 52 MARKET FOR CONSUMER DEVICES APPLICATION IN NORTH AMERICA, BY COUNTRY, 2017�2025 (USD MILLION)
TABLE 53 MARKET FOR TELECOMMUNICATION APPLICATION IN NORTH AMERICA, BY COUNTRY, 2017�2025 (USD MILLION)
TABLE 54 MARKET FOR AEROSPACE & DEFENSE APPLICATION IN NORTH AMERICA, BY COUNTRY, 2017�2025 (USD MILLION)
TABLE 55 MARKET FOR AUTOMOTIVE APPLICATION IN NORTH AMERICA, BY COUNTRY, 2017�2025 (USD MILLION)
TABLE 56 MARKET FOR CATV & WIRED BROADBAND APPLICATION IN NORTH AMERICA, BY COUNTRY, 2017�2025 (USD MILLION)
TABLE 57 MARKET FOR OTHER APPLICATIONS IN NORTH AMERICA, BY COUNTRY, 2017�2025 (USD MILLION)
TABLE 58 MARKET IN US, BY APPLICATION, 2017�2025 (USD MILLION)
TABLE 59 MARKET IN CANADA, BY APPLICATION, 2017�2025 (USD MILLION)
TABLE 60 MARKET IN MEXICO, BY APPLICATION, 2017�2025 (USD MILLION)
TABLE 61 MARKET IN EUROPE, BY COUNTRY, 2017�2025 (USD MILLION)
TABLE 62 MARKET IN EUROPE, BY DEVICE, 2017�2025 (USD MILLION)
TABLE 63 MARKET IN EUROPE, BY FREQUENCY BAND, 2017�2025 (USD MILLION)
TABLE 64 MARKET IN EUROPE, BY MATERIAL, 2017�2025 (USD MILLION)
TABLE 65 MARKET IN EUROPE, BY APPLICATION, 2017�2025 (USD MILLION)
TABLE 66 MARKET FOR CONSUMER DEVICES APPLICATION IN EUROPE, BY COUNTRY, 2017�2025 (USD MILLION)
TABLE 67 MARKET FOR TELECOMMUNICATION APPLICATION IN EUROPE, BY COUNTRY, 2017�2025 (USD MILLION)
TABLE 68 MARKET FOR AEROSPACE & DEFENSE APPLICATION IN EUROPE, BY COUNTRY, 2017�2025 (USD MILLION)
TABLE 69 MARKET FOR AUTOMOTIVE APPLICATION IN EUROPE, BY COUNTRY, 2017�2025 (USD MILLION)
TABLE 70 MARKET FOR CATV & WIRED BROADBAND IN EUROPE, BY COUNTRY, 2017�2025 (USD MILLION)
TABLE 71 MARKET FOR OTHER APPLICATIONS IN EUROPE, BY COUNTRY, 2017�2025 (USD MILLION)
TABLE 72 MARKET IN UK, BY APPLICATION, 2017�2025 (USD MILLION)
TABLE 73 MARKET IN GERMANY, BY APPLICATION, 2017�2025 (USD MILLION)
TABLE 74 MARKET IN FRANCE, BY APPLICATION, 2017�2025 (USD MILLION)
TABLE 75 MARKET IN ITALY, BY APPLICATION, 2017�2025 (USD MILLION)
TABLE 76 MARKET IN REST OF EUROPE, BY APPLICATION, 2017�2025 (USD MILLION)
TABLE 77 MARKET IN APAC, BY COUNTRY, 2017�2025 (USD MILLION)
TABLE 78 MARKET IN APAC, BY DEVICE, 2017�2025 (USD MILLION)
TABLE 79 MARKET IN APAC, BY FREQUENCY BAND, 2017�2025 (USD MILLION)
TABLE 80 MARKET IN APAC, BY MATERIAL, 2017-2025 (USD MILLION)
TABLE 81 MARKET IN APAC, BY APPLICATION, 2017�2025 (USD MILLION)
TABLE 82 MARKET FOR CONSUMER DEVICES APPLICATION IN APAC, BY COUNTRY, 2017�2025 (USD MILLION)
TABLE 83 MARKET FOR TELECOMMUNICATION APPLICATION IN APAC, BY COUNTRY, 2017�2025 (USD MILLION)
TABLE 84 MARKET FOR AEROSPACE & DEFENSE APPLICATION IN APAC, BY COUNTRY, 2017�2025 (USD MILLION)
TABLE 85 MARKET FOR AUTOMOTIVE APPLICATION IN APAC, BY COUNTRY, 2017�2025 (USD MILLION)
TABLE 86 MARKET FOR CATV & WIRED BROADBAND APPLICATION IN APAC, BY COUNTRY, 2017�2025 (USD MILLION)
TABLE 87 MARKET FOR OTHER APPLICATIONS IN APAC, BY COUNTRY, 2017�2025 (USD MILLION)
TABLE 88 MARKET IN CHINA, BY APPLICATION, 2017�2025 (USD MILLION)
TABLE 89 MARKET IN JAPAN, BY APPLICATION, 2017�2025 (USD MILLION)
TABLE 90 MARKET IN SOUTH KOREA, BY APPLICATION, 2017�2025 (USD MILLION)
TABLE 91 MARKET IN REST OF APAC, BY APPLICATION, 2017�2025 (USD MILLION)
TABLE 92 MARKET IN ROW, BY REGION, 2017�2025 (USD MILLION)
TABLE 93 MARKET IN ROW, BY DEVICE, 2017�2025 (USD MILLION)
TABLE 94 MARKET IN ROW, BY FREQUENCY BAND, 2017�2025 (USD MILLION)
TABLE 95 MARKET IN ROW, BY MATERIAL, 2017�2025 (USD MILLION)
TABLE 96 MARKET IN ROW, BY APPLICATION, 2017�2025 (USD MILLION)
TABLE 97 MARKET FOR CONSUMER DEVICES APPLICATION IN ROW, BY REGION, 2017�2025 (USD MILLION)
TABLE 98 MARKET FOR TELECOMMUNICATION APPLICATION IN ROW, BY REGION, 2017�2025 (USD MILLION)
TABLE 99 MARKET FOR AEROSPACE & DEFENSE APPLICATION IN ROW, BY REGION, 2017�2025 (USD MILLION)
TABLE 100 MARKET FOR AUTOMOTIVE APPLICATION IN ROW, BY REGION, 2017�2025 (USD MILLION)
TABLE 101 MARKET FOR CATV & WIRED BROADBAND APPLICATION IN ROW, BY REGION, 2017�2025 (USD MILLION)
TABLE 102 MARKET FOR OTHER APPLICATIONS IN ROW, BY REGION, 2017�2025 (USD MILLION)
TABLE 103 MARKET IN SOUTH AMERICA, BY APPLICATION, 2017�2025 (USD MILLION)
TABLE 104 MARKET IN MIDDLE EAST & AFRICA, BY APPLICATION, 2017�2025 (USD MILLION)
LIST OF FIGURES (42 Figures)
FIGURE 1 RF SEMICONDUCTOR MARKET: PROCESS FLOW OF MARKET SIZE ESTIMATION
FIGURE 2 MARKET: RESEARCH DESIGN
FIGURE 3 RF SEMICONDUCTOR MARKET: BOTTOM-UP APPROACH
FIGURE 4 MARKET: TOP-DOWN APPROACH
FIGURE 5 DATA TRIANGULATION
FIGURE 6 ASSUMPTIONS FOR RESEARCH STUDY
FIGURE 7 FILTERS TO DOMINATE MARKET DURING FORECAST PERIOD
FIGURE 8 GALLIUM NITRIDE (GaN) BASED RF DEVICES TO EXHIBIT HIGHEST CAGR IN MARKET DURING FORECAST PERIOD
FIGURE 9 CONSUMER DEVICES TO LEAD MARKET DURING FORECAST PERIOD
FIGURE 10 MARKET IN APAC TO GROW AT HIGHEST CAGR DURING FORECAST PERIOD
FIGURE 11 RISING TRENDS OF 5G ADOPTION IN VARIOUS COUNTRIES TO DRIVE GROWTH OF RF SEMICONDUCTOR MARKET
FIGURE 12 FILTER AND CONSUMER DEVICES HELD LARGEST MARKET SHARE IN APAC, BY DEVICE AND APPLICATION, RESPECTIVELY, IN 2019
FIGURE 13 RF DEVICES OPERATING IN VHF AND UHF FREQUENCY BAND TO HOLD LARGEST MARKET SIZE DURING FORECAST PERIOD
FIGURE 14 CHINA TO RECORD HIGHEST CAGR IN MARKET DURING FORECAST PERIOD
FIGURE 15 FILTER TO DOMINATE MARKET DURING FORECAST PERIOD
FIGURE 16 RF SEMICONDUCTOR MARKET FOR FILTER IN APAC TO GROW AT HIGHEST CAGR DURING FORECAST PERIOD
FIGURE 17 APAC TO LEAD FOR RF SEMICONDUCTOR MARKET FOR POWER AMPLIFIER, DURING FORECAST PERIOD
FIGURE 18 FIGURE 1 SHF BAND TO GROW AT HIGHEST CAGR DURING FORECAST PERIOD
FIGURE 19 GALLIUM NITRIDE (GaN) BASED RF DEVICES TO GROW AT HIGHEST CAGR DURING FORECAST PERIOD
FIGURE 20 GaAs AND PIEZOELECTRIC SUBSTRATE BASED RF DEVICES TO GROW AT HIGHEST CAGR IN APAC DURING FORECAST PERIOD
FIGURE 21 CONSUMER DEVICES TO LEAD MARKET DURING FORECAST PERIOD
FIGURE 22 APAC TO DOMINATE MARKET FOR CONSUMER DEVICES DURING FORECAST PERIOD
FIGURE 23 MARKET IN APAC TO GROW AT HIGHEST CAGR FOR TELECOMMUNICATION APPLICATION DURING FORECAST PERIOD
FIGURE 24 NORTH AMERICA TO LEAD MARKET FOR AEROSPACE & DEFENSE DURING FORECAST PERIOD
FIGURE 25 MARKET IN APAC TO GROW AT HIGHEST CAGR DURING FORECAST PERIOD
FIGURE 26 NORTH AMERICA: SNAPSHOT OF MARKET
FIGURE 27 MARKET IN US EXPECTED TO GROW AT HIGHEST CAGR IN NORTH AMERICA DURING FORECAST PERIOD
FIGURE 28 EUROPE: SNAPSHOT OF MARKET
FIGURE 29 AUTOMOTIVE APPLICATION IN EUROPE TO GROW AT HIGHEST CAGR FOR MARKET DURING FORECAST PERIOD
FIGURE 30 APAC: SNAPSHOT OF MARKET
FIGURE 31 RF SEMICONDUCTOR MARKET IN CHINA TO GROW AT HIGHEST CAGR DURING FORECAST PERIOD
FIGURE 32 RF SEMICONDUCTOR MARKET IN SOUTH AMERICA TO GROW AT HIGHER CAGR IN ROW DURING FORECAST PERIOD
FIGURE 33 QORVO: COMPANY SNAPSHOT
FIGURE 34 SKYWORKS: COMPANY SNAPSHOT
FIGURE 35 QUALCOMM: COMPANY SNAPSHOT
FIGURE 36 ANALOG DEVICES: COMPANY SNAPSHOT
FIGURE 37 NXP SEMICONDUCTORS: COMPANY SNAPSHOT
FIGURE 38 CREE: COMPANY SNAPSHOT
FIGURE 39 MACOM: COMPANY SNAPSHOT
FIGURE 40 MICROCHIP TECHNOLOGY: COMPANY SNAPSHOT
FIGURE 41 MURATA MANUFACTURING: COMPANY SNAPSHOT
FIGURE 42 TEXAS INSTRUMENTS: COMPANY SNAPSHOT
The study involved four major activities in estimating the current size of the global RF semiconductor market. Exhaustive secondary research has been done to collect information about the market, the peer market, and the parent market. Validating findings, assumptions, and sizing with industry experts across the value chain through primary research has been the next step. Both top-down and bottom-up approaches have been employed to estimate the complete market size. After that, market breakdown and data triangulation methods have been used to estimate the market size of segments and subsegments.
Secondary Research
The research methodology used to estimate and forecast the RF semiconductor market begins with capturing data on revenues of the key vendors in the market through secondary research. This study incorporates the use of extensive secondary sources, directories, and databases such as Hoovers, Bloomberg Businessweek, Factiva, and OneSource to identify and collect information useful for the technical, market-oriented, and commercial study of the RF semiconductor market. Vendor offerings have also been considered to determine the market segmentation. This entire research methodology includes the study of annual and financial reports of top players, presentations, press releases, journals, paid databases, trade directories, and regulatory bodies.
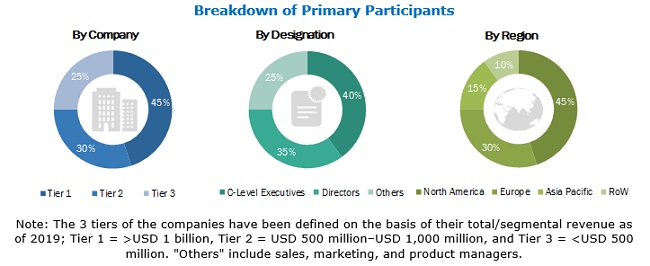
Primary Research
The RF semiconductor market comprises several stakeholders, such as wafer manufacturers and suppliers, integrated device manufacturers, and original equipment manufacturers. Demand-side of this market includes end-users from various applications such as consumer devices, telecommunication, and automotive. Several primary interviews have been conducted with market experts from both the demand and supply sides across four major regions: North America, Europe, APAC, and RoW to gather qualitative and quantitative information. Following is the breakdown of primary respondents.
To know about the assumptions considered for the study, download the pdf brochure
Market Size Estimation
The top-down and bottom-up approaches have been used to estimate and validate the overall size of the RF semiconductor market. These methods have also been used extensively to estimate the size of various market subsegments. The research methodology used to estimate the market size includes the following:
- Key players in major applications and markets have been identified through extensive secondary research.
- The industry's supply chain and market size, in terms of value, have been determined through primary and secondary research processes.
- Players offering different components such as power amplifiers, filters, and switches are considered, and their revenues are observed to arrive at a global number.
- All percentage shares, splits, and breakdowns have been determined using secondary sources and verified through primary sources.
Data Triangulation
After arriving at the overall market size using the estimation processes as explained above, the market was split into several segments and subsegments. To complete the overall market engineering process and arrive at the exact statistics of each market segment and subsegment, data triangulation, and market breakdown procedures have been employed, wherever applicable. The data has been triangulated by studying various factors and trends from both the demand and supply sides in the RF semiconductor market.
Report Objectives
- To describe and forecast the RF semiconductor market by device, material, frequency band, and application in terms of value
- To describe and forecast the market for various segments with regard to main regions, namely, North America, Europe, Asia Pacific (APAC), and Rest of the World (RoW), in terms of value
- To provide detailed information regarding major factors including drivers, restraints, opportunities, and challenges that influence the growth of the RF semiconductor market
- To provide a comprehensive overview of the value chain pertaining to the RF semiconductor ecosystem
- To strategically analyze micromarkets1 with respect to individual growth trends, prospects, and contribution to the total market
- To strategically profile key players and comprehensively analyze their market position in terms of revenue and core competencies2, along with detailing the competitive landscape for market leaders
- To analyze competitive developments such as acquisitions, agreements, partnerships, and product launches in the RF semiconductor market
- To benchmark players within the market using proprietary "Competitive Leadership Mapping" framework, which analyzes market players on various parameters within the broad categories of business and product strategy
Available Customizations
With the given market data, MarketsandMarkets offers customizations according to the company's specific needs. The following customization options are available for the RF semiconductor market report:
Product Analysis
- Product matrix that gives a detailed comparison of the product portfolio of each company
Company Information
- Detailed analysis and profiling of additional market players (up to 5).


Growth opportunities and latent adjacency in RF Semiconductor Market