Robotic Vision Market

Robotic Vision Market by Type (2D Vision, 3D Vision Systems), Hardware (Cameras, Lighting, Optics, Processors & Controllers, Frame Grabbers), Software(Traditional software, Deep Learning Software), Application, Industry, Region - Global Forecast to 2028

Report Code: SE 4176 Jul, 2023, by marketsandmarkets.com

The Robotic Vision market is expected to grow from USD 2.6 billion in 2023 to USD 4.0 billion by 2028, registering a CAGR of 9.1%. The major factors driving the robotic vision market are the growing need for automation and quality inspection in the industries and the capability of 3D vision systems allowing robotic systems to perform more than one task without reprogramming.
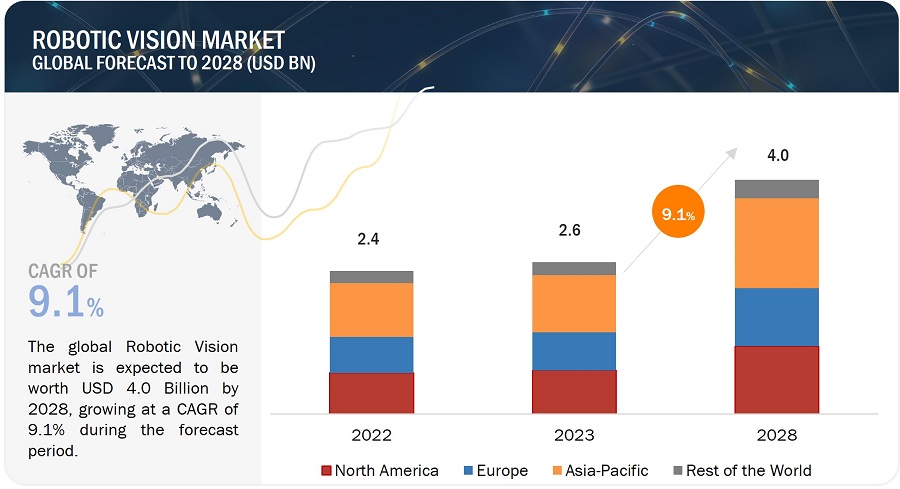
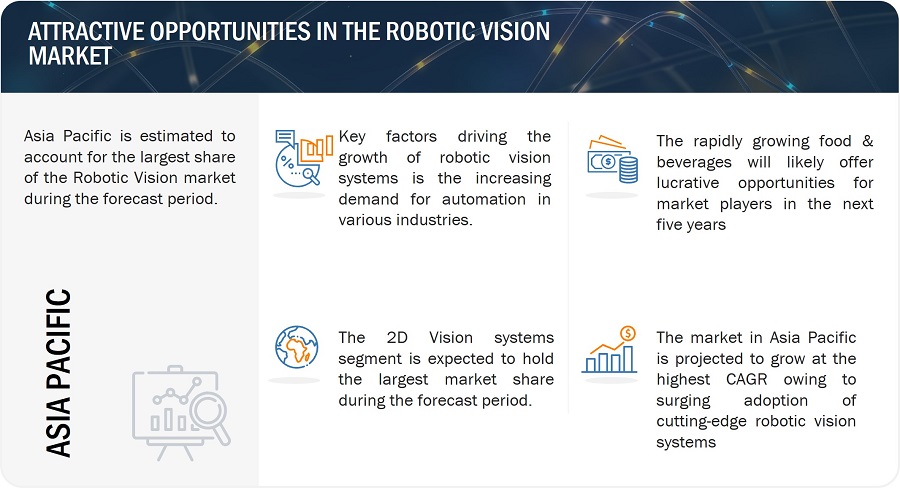
Robotic Vision Market

Robotic Vision Market

Robotic Vision Market Forecast to 2028

To know about the assumptions considered for the study, Request for Free Sample Report

Market Dynamics

Driver: Increase in use of smart cameras in robotic vision

Smart cameras are compact, highly integrated, and easily programmed. It offers an attractive alternative to more complex PC-based vision systems. Smart cameras have traditionally provided more robust processing; however, embedded systems are blurring the line with the emergence of highly functional embedded cameras with MIPI interfaces, image pre-processing, and even IP cores for decoding video streams in an onboard FPGA. Smart cameras still pack more processing power, as a rule. They are further distinguished by incorporating system storage, digital I/O, and standard industrial communication interfaces within an often-ruggedized stand-alone housing.

As self-contained vision solutions, smart cameras offer speedier integration and more straightforward programming than PC-based systems. They also tend to offer a lower price point and a cost-effective solution. Smart camera systems are also best suited for harsh industrial environments. Any industry with messy factory floors, irregularly sanitized workspaces, or typified by a dirty, dusty environment is a natural fit for a smart camera. Besides, pharmaceutical and food & beverage production are early adopters of smart camera technologies.

Besides the integrated processors for faster data processing, smart cameras have easy-to-use software. Smart cameras reduce the efforts required for integration and configuration, as external components, such as processors and lighting, are integrated within the camera. It also reduces overall costs. Hence, smart cameras drive the widespread adoption of robotic vision systems due to their tightly integrated hardware and software design.

Restraint: Limited awareness of Robotic Vision Systems

Due to the lack of awareness about robotic vision systems, customers do not adopt them widely in developing countries. For instance, in India, industrial robots are primarily deployed in more significant industries, such as automotive and metals. Hence, 3D vision systems are mainly used in industrial manufacturing processes, whereas there is a lower penetration of 2D vision systems, as robot automation is not common in smaller industries. The benefits of a robotic vision system should be known to end users to encourage its use. Robotic vision systems are also becoming more affordable over time, and the growing number of smart cameras and robust software packages is making vision systems more accessible to a wide range of users. There is also a shortage of a skilled workforce to program vision systems effectively. The younger generation often views manufacturing as a dirty and dangerous job. This issue is further amplified in the case of developing countries. In North America and Europe, robotic vision companies are sending engineers to universities to showcase the benefits of modern vision system solutions in manufacturing. Although such activities have improved the collaboration between industries and educational institutions, a talent shortage for robotic vision professionals is still prevalent.

Opportunity: Increasing customization of Robotic Vision systems

With the rising demand for robotic vision, the need for customization is also growing globally. The robotic vision systems are customized and delivered to the end users. Automotive assembly, food packaging, medical device manufacturing, and pharmaceutical manufacturing are the early adopters of leading-edge robotic vision technology. These industries highly demand customized robotic vision systems to meet the rising demand of customers for quality products. Over the past decade, manufacturers have increasingly turned to flexible, customizable automation platforms to meet the needs of high/low volume orders and ensure their long-term survival in a competitive manufacturing environment. This trend has seen collaborative robots—low-cost, industrial robot platforms designed to work safely alongside humans on various tasks, including quality inspection-grow from niche product status in the past few years. For instance, Sick Ag (Germany) provides customizable 2D and 3D vision sensors that can be tailored to the business. These are ready-to-use solutions that can be easily configured without a vision or programming expert or modified to solve applications.

Similarly, Cotmac Electronics is Cognex's Authorized Solution Partner (ASP). Cotmac offers customized vision-based inspection, guidance, and identification systems that give machines the power to see. Vision systems detect process errors early, ensure the shipment is free from all defects, and reduce the quantity of scrapped components. These systems are rugged, easy to use, reliable, and more efficient. Through robotics and intelligent material handling systems, Cotmac helps to optimize production to match process speed and positioning accurately. Thus, the rising adoption of customized robotic vision systems will likely drive the market’s growth.

Challenge: Programming the complex inspection task

Robotic vision systems primarily utilize step-by-step filtering and rule-based algorithms to detect deviations and defects in the target part. With consistent and well-manufactured features, such algorithms perform reliably with reasonable accuracy. However, as the number of defects and exceptions increases, it becomes challenging to program the robotic vision to account for new anomalies. These challenges sometimes do not identify the object per the algorithm, impacting the whole process. For instance, in the food & beverages industries, if the robotic vision system does not recognize the rotten potatoes while making potato chips, it will impact the whole production process, including waste of product prepared, time consumption, etc. Vision systems allow for some minor tolerance in the variability of a part due to factors such as scale, rotation, and pose distortion. Complex surface textures and image distortion due to improper lighting further add to this challenge. Although functional anomalies can be accurately detected through robust programming, visual and cosmetic anomalies are often difficult to distinguish through a vision system. Hence, robotic vision systems can be challenging to program and maintain over time for complex inspections involving deviation and unpredictable defects. However, the current development of AI-based software solutions for vision processing systems is expected to solve a few of these challenges.

Robotic Vision Market Ecosystem

Component suppliers and system integrators have witnessed a decline in production activities. Consequently, OEMs have needed more essential components. The figure below shows the Robotic Vision ecosystem.
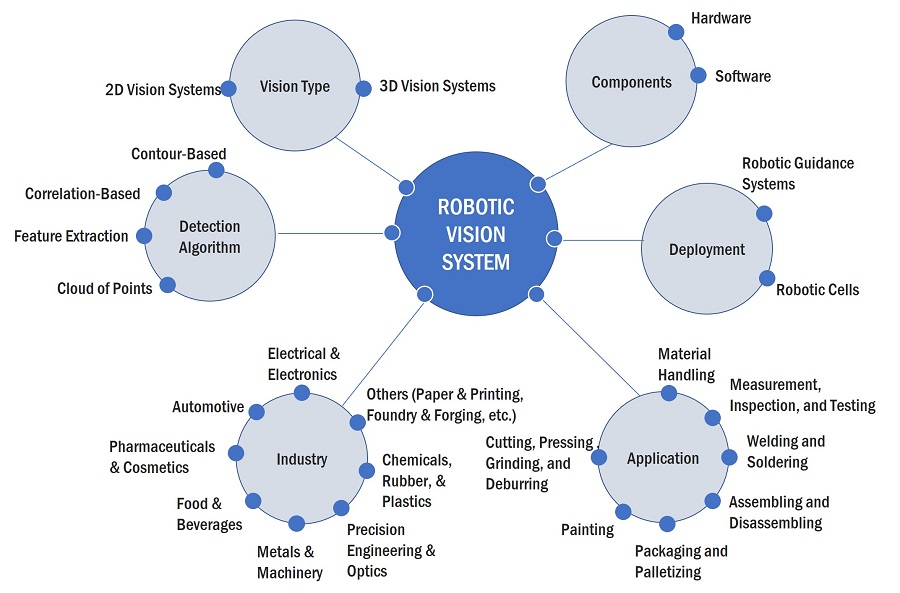
Robotic Vision Market by Ecosystem

3D Vision Systems segment to grow at highest CAGR in the forecast period 2023-2028

A convergence of factors is propelling the expansion of 3D vision systems. Technological breakthroughs in hardware, sensors, and imaging technologies have enhanced accuracy and affordability. The versatility of these systems is reflected in their diverse applications across industries, including robotics, manufacturing, healthcare, and entertainment. The demand for automation, improved safety, and security further drive the adoption of 3D vision systems. Advancements in machine learning techniques have also played a pivotal role in augmenting the understanding and interpretation of complex visual data. With continued innovation, the future holds immense potential for further growth in this field.

Software segment to grow at highest CAGR in the forecast period 2023-2028.

The software segment will likely grow at the highest CAGR during the forecast period. Integrating AI in robotic vision software is expected to fuel the growth of the robotic vision market for software during the forecast period, as deep learning enables robots to recognize objects. Deep learning-based vision software helps minimize human intervention and provides a real-time solution by distinguishing the acceptable product variations and defects in manufacturing industries.

Food & Beverages Industry is expected to register highest CAGR during the forecast period.

Robotic vision has revolutionized the food and beverages industry, experiencing remarkable growth. Robots can visually perceive and comprehend their environment by leveraging advanced cameras and image-processing algorithms. This technology finds application in quality inspection, packaging, sorting, pick-and-place operations, food safety, traceability, and even autonomous vehicles within the industry. With increased efficiency, enhanced product quality, and improved safety standards, robotic vision is reshaping the future of food and beverages, paving the way for unprecedented advancements and possibilities.
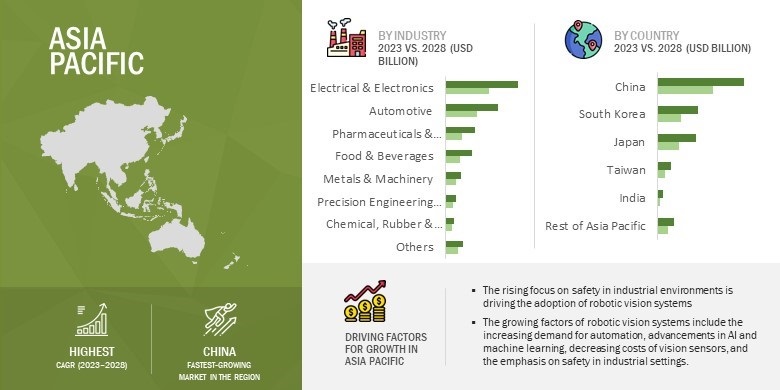
Robotic Vision Market by Region

Robotic Vision Market by Region

To know about the assumptions considered for the study, download the pdf brochure

Asia Pacific to grow at highest CAGR during the forecast period

Asia Pacific is the largest market for robotic vision and is home to some of the fastest-growing economies in the world. Asia Pacific is expected to provide significant growth opportunities for the robotic vision market since the region is considered the manufacturing hub for most industries. China has been a potential market for all emerging technologies, including industrial robots and vision systems. The large scale of manufacturing industries in other countries in the Asia Pacific, such as Japan and South Korea, have also contributed to the market growth in the region.

Key Market Players

The Robotic Vision market players have implemented various organic and inorganic growth strategies, such as product launches, collaborations, partnerships, and acquisitions, to strengthen their offerings in the market. The major players in the market are Cognex Corporation (US), Basler AG (Germany), OMRON Corporation (Japan), National Instruments Corporation (US), Keyence Corporation (Japan), Teledyne DALSA (Canada), Sick AG (Germany), Torvidel AS (Norway), Hexagon AB (Sweden), Advantech (Taiwan), Yaskawa America, Inc. (Japan), ISRA VISION (Germany), FANUC CORPORATION (Japan), ABB (Switzerland), Qualcomm Incorporated (US).

The study includes an in-depth competitive analysis of these key players in the Robotic Vision market with their company profiles, recent developments, and key market strategies.

Get online access to the report on the World's First Market Intelligence Cloud

  • Easy to Download Historical Data & Forecast Numbers
  • Company Analysis Dashboard for high growth potential opportunities
  • Research Analyst Access for customization & queries
  • Competitor Analysis with Interactive dashboard
  • Latest News, Updates & Trend analysis
Request Sample

Scope of the Report

Report Metric

Details

Estimated Value USD 2.6 billion in 2023
Projected Value USD 4.0 billion by 2028
Growth Rate CAGR of 9.1%

Years Considered

2019–2028

Base Year Considered

2022

Forecast Period

2023–2028

Forecast Units

Value (USD Million/Billion)

Segments Covered

By Type, By Component, By Industry, and Region

Regions Covered

North America, Asia Pacific, Europe, and the Rest of the World

Companies Covered

Cognex Corporation (US), Basler AG (Germany), OMRON Corporation (Japan), National Instruments Corporation (US), Keyence Corporation (Japan), Teledyne DALSA (Canada), Sick AG (Germany), Torvidel AS (Norway), Hexagon AB (Sweden), Advantech (Taiwan), Yaskawa America, Inc. (Japan), ISRA VISION (Germany), FANUC CORPORATION (Japan), ABB (Switzerland), Qualcomm Incorporated (US) and  total of 25 players covered

This report has segmented the Robotic Vision market based on offerings, By product type and component, Installation type application, and region.

Segment

Subsegment

By Type

  • 2D Vision Systems
  • 3D Vision Systems

By Component

  • Hardware
    • Camera
      • Visible
      • Visible + IR
    • Lighting
    • Optics
    • Processors and Controllers
    • Frame Grabber
    • Others
  • Software
    • Traditional Software
    • Deep Learning Software

By Industry

  • Automotive
  • Electrical & Electronics
  • Chemical, Rubber, & Plastic
  • Metals & Machinery
  • Food & Beverages
  • Precision Engineering & Optics
  • Pharmaceuticals & Cosmetics
  • Others

By Region

  • North America
    • US
    • Canada
    • Mexico
  • Europe
    • UK
    • Germany
    • France
    • Spain
    • Italy
    • Rest of Europe
  • Asia Pacific
    • China
    • Japan
    • South Korea
    • Taiwan
    • India
    • Rest of Asia Pacific
  • Rest of the World
    • Middle East & Africa
    • South America

Recent Developments

  • In May 2023, Cognex Corporation unveiled the Advantage 182 vision system. This cutting-edge system is precisely engineered to streamline intricate tasks such as location identification, classification, and inspection. This solution integrates machine vision capabilities, barcode reading functionality, and advanced edge learning technology. With these advanced features, the Advantage 182 enables automation across various applications, from essential presence/absence detection and track-and-trace functions to particular alignment tasks and comprehensive color inspections.
  • In April 2023, Cognex Corporation, a renowned industrial robotic leader, introduced the In-Sight 3800 Vision System. This advanced system is engineered to cater to high-speed production lines. The In-Sight 3800 boasts a comprehensive array of vision tools, exceptional imaging capabilities, and adaptable software, resulting in a seamlessly integrated solution for various inspection applications.
  • In March 2023, Teledyne introduced the Sapera Vision Software Edition 2023-03. Teledyne DALSA's Sapera Vision Software offers reliable features for image acquisition, control, image processing, and artificial intelligence capabilities, enabling the creation, advancement, and implementation of top-notch machine vision applications. The latest updates encompass improvements to the AI training graphical tool Astrocyte 1.40 and enhancements to the image processing and AI libraries tool Sapera Processing 9.40.

Frequently Asked Questions (FAQ):

To speak to our analyst for a discussion on the above findings, click Speak to Analyst

TABLE OF CONTENTS
 
1 INTRODUCTION (Page No. - 31)
    1.1 STUDY OBJECTIVES 
    1.2 MARKET DEFINITION 
    1.3 INCLUSIONS AND EXCLUSIONS 
    1.4 STUDY SCOPE 
           1.4.1 MARKETS COVERED
                    FIGURE 1 ROBOTIC VISION MARKET SEGMENTATION
           1.4.2 YEARS CONSIDERED
    1.5 CURRENCY CONSIDERED 
    1.6 LIMITATIONS 
    1.7 STAKEHOLDERS 
    1.8 SUMMARY OF CHANGES 
           1.8.1 IMPACT OF RECESSION
 
2 RESEARCH METHODOLOGY (Page No. - 35)
    2.1 RESEARCH DATA 
           FIGURE 2 ROBOTIC VISION MARKET: RESEARCH DESIGN
           2.1.1 SECONDARY DATA
                    2.1.1.1 List of major secondary sources
                    2.1.1.2 Key data from secondary sources
           2.1.2 PRIMARY DATA
                    2.1.2.1 Breakdown of primaries
                    2.1.2.2 Key data from primary sources
           2.1.3 SECONDARY AND PRIMARY RESEARCH
                    2.1.3.1 Key industry insights
    2.2 MARKET SIZE ESTIMATION 
           FIGURE 3 MARKET SIZE ESTIMATION METHODOLOGY (SUPPLY SIDE): REVENUE FROM ROBOTIC VISION MARKET
           2.2.1 BOTTOM-UP APPROACH
                    2.2.1.1 Approach to arrive at market size using bottom-up analysis
                               FIGURE 4 MARKET SIZE ESTIMATION METHODOLOGY: BOTTOM-UP APPROACH
           2.2.2 TOP-DOWN APPROACH
                    2.2.2.1 Approach to arrive at market size using top-down analysis
                               FIGURE 5 MARKET SIZE ESTIMATION METHODOLOGY: TOP-DOWN APPROACH
    2.3 MARKET BREAKDOWN AND DATA TRIANGULATION 
           FIGURE 6 MARKET BREAKDOWN AND DATA TRIANGULATION
    2.4 RESEARCH ASSUMPTIONS 
           FIGURE 7 ASSUMPTIONS FOR RESEARCH STUDY
    2.5 APPROACH TO ANALYZE IMPACT OF RECESSION 
    2.6 RISK ASSESSMENT 
           TABLE 1 LIMITATIONS AND ASSOCIATED RISKS
 
3 EXECUTIVE SUMMARY (Page No. - 45)
    FIGURE 8 2D VISION SYSTEMS SEGMENT TO HOLD LARGER MARKET SHARE IN 2028
    FIGURE 9 HARDWARE SEGMENT TO LEAD MARKET DURING FORECAST PERIOD
    FIGURE 10 FOOD & BEVERAGES SEGMENT TO EXHIBIT HIGHEST CAGR DURING FORECAST PERIOD
    FIGURE 11 ROBOTIC VISION MARKET IN ASIA PACIFIC TO DISPLAY HIGHEST CAGR DURING FORECAST PERIOD
 
4 PREMIUM INSIGHTS (Page No. - 49)
    4.1 ATTRACTIVE OPPORTUNITIES FOR PLAYERS IN ROBOTIC VISION MARKET 
           FIGURE 12 INCREASING DEMAND FOR AUTOMATION IN VARIOUS INDUSTRIES TO CREATE LUCRATIVE OPPORTUNITIES FOR ROBOTIC VISION MARKET
    4.2 ROBOTIC VISION MARKET, BY TYPE 
           FIGURE 13 3D VISION SYSTEMS SEGMENT TO EXHIBIT HIGHER CAGR DURING FORECAST PERIOD
    4.3 ROBOTIC VISION MARKET, BY COMPONENT 
           FIGURE 14 HARDWARE SEGMENT TO HOLD LARGER MARKET SHARE IN 2028
    4.4 ROBOTIC VISION MARKET, BY INDUSTRY 
           FIGURE 15 ELECTRICAL & ELECTRONICS SEGMENT TO DOMINATE MARKET DURING FORECAST PERIOD
    4.5 ROBOTIC VISION MARKET, BY REGION 
           FIGURE 16 ASIA PACIFIC TO HOLD LARGEST MARKET SHARE IN 2023
    4.6 ROBOTIC VISION MARKET, BY COUNTRY 
           FIGURE 17 INDIA TO EXHIBIT HIGHEST CAGR IN ROBOTIC VISION MARKET FROM 2023 TO 2028
 
5 MARKET OVERVIEW (Page No. - 52)
    5.1 INTRODUCTION 
    5.2 MARKET DYNAMICS 
           FIGURE 18 ROBOTIC VISION MARKET: DRIVERS, RESTRAINTS, OPPORTUNITIES, AND CHALLENGES
           5.2.1 DRIVERS
                    5.2.1.1 Growing need for quality inspection using automated robotic vision systems
                    5.2.1.2 Rising use of 3D vision systems in industrial robotics
                    5.2.1.3 Increasing demand for safety and high-quality products in industrial sector
                    5.2.1.4 Increasing use of smart cameras in robotic vision systems
                               FIGURE 19 ROBOTIC VISION MARKET: DRIVERS AND THEIR IMPACT
           5.2.2 RESTRAINTS
                    5.2.2.1 High installation cost
                    5.2.2.2 Limited adaptability in different applications
                    5.2.2.3 Less awareness regarding robotic vision systems
                               FIGURE 20 ROBOTIC VISION MARKET: RESTRAINTS AND THEIR IMPACT
           5.2.3 OPPORTUNITIES
                    5.2.3.1 Government-led initiatives for boosting industrial automation
                               TABLE 2 SUMMARY OF GOVERNMENT-LED INVESTMENTS IN INDUSTRIAL AUTOMATION
                    5.2.3.2 Integration of AI and deep learning technologies into robotic vision systems
                    5.2.3.3 Customization of robotic vision systems
                               FIGURE 21 ROBOTIC VISION MARKET: OPPORTUNITIES AND THEIR IMPACT
           5.2.4 CHALLENGES
                    5.2.4.1 Difficulties in manufacturing robotic vision systems
                    5.2.4.2 Programming of complex inspection tasks
                               FIGURE 22 ROBOTIC VISION MARKET: CHALLENGES AND THEIR IMPACT
    5.3 VALUE CHAIN ANALYSIS 
           FIGURE 23 ROBOTIC VISION MARKET: VALUE CHAIN ANALYSIS
    5.4 ECOSYSTEM ANALYSIS 
           FIGURE 24 ROBOTIC VISION MARKET: ECOSYSTEM ANALYSIS
           TABLE 3 ROBOTIC VISION MARKET: ECOSYSTEM ANALYSIS
    5.5 PRICING ANALYSIS 
           5.5.1 AVERAGE SELLING PRICE (ASP) OF ROBOTIC VISION SYSTEM COMPONENTS OFFERED BY THREE KEY PLAYERS
                    FIGURE 25 AVERAGE SELLING PRICE (ASP) OF ROBOTIC VISION SYSTEM COMPONENTS OFFERED BY THREE KEY PLAYERS
                    TABLE 4 AVERAGE SELLING PRICE (ASP) OF ROBOTIC VISION SYSTEM COMPONENTS OFFERED BY THREE KEY PLAYERS (USD)
                    TABLE 5 AVERAGE SELLING PRICE (ASP) OF OPTICS, BY REGION (USD)
    5.6 TRENDS/DISRUPTIONS IMPACTING CUSTOMERS’ BUSINESSES 
           FIGURE 26 REVENUE SHIFT AND NEW REVENUE POCKETS FOR PLAYERS IN ROBOTIC VISION MARKET
    5.7 TECHNOLOGY ANALYSIS 
           5.7.1 3D VISION SYSTEM
           5.7.2 HYPERSPECTRAL IMAGING
           5.7.3 ARTIFICIAL INTELLIGENCE (AI) IN ROBOTIC VISION SYSTEM
           5.7.4 LIQUID LENSES IN ROBOTIC VISION SYSTEM
           5.7.5 4D VISION SYSTEM
    5.8 PORTER’S FIVE FORCES ANALYSIS 
           TABLE 6 ROBOTIC VISION MARKET: PORTER’S FIVE FORCES ANALYSIS
           5.8.1 THREAT OF NEW ENTRANTS
           5.8.2 THREAT OF SUBSTITUTES
           5.8.3 BARGAINING POWER OF SUPPLIERS
           5.8.4 BARGAINING POWER OF BUYERS
           5.8.5 INTENSITY OF COMPETITIVE RIVALRY
    5.9 KEY STAKEHOLDERS AND BUYING CRITERIA 
           5.9.1 KEY STAKEHOLDERS IN BUYING PROCESS
                    FIGURE 27 INFLUENCE OF STAKEHOLDERS ON BUYING PROCESS FOR TOP THREE INDUSTRIES
                    TABLE 7 INFLUENCE OF STAKEHOLDERS ON BUYING PROCESS FOR TOP THREE INDUSTRIES (%)
           5.9.2 BUYING CRITERIA
                    FIGURE 28 KEY BUYING CRITERIA FOR TOP THREE INDUSTRIES
                    TABLE 8 KEY BUYING CRITERIA FOR TOP THREE INDUSTRIES
    5.10 CASE STUDY ANALYSIS 
           5.10.1 AEROBOTIX DEVELOPED AUTOMATED PART LOCATION AND VERIFICATION (APLV) SYSTEM TO SIMPLIFY PROCESS OF UPDATING ROBOT PATHS IN VERSATILE, EVER-CHANGING WORK ENVIRONMENTS
           5.10.2 MWES ENGINEERED SYSTEMS DEVELOPED TWO WALL-MOUNTED KAWASAKI RS007L ROBOTS EQUIPPED WITH VACUUM GRIPPERS
           5.10.3 VARTA USED VISIONPRO 3D TO ACHIEVE HIGH PRODUCTION SPEED AND PRODUCT QUALITY
    5.11 TRADE ANALYSIS 
           FIGURE 29 IMPORT DATA FOR HS CODE 852580, BY KEY COUNTRY, 2018–2022 (USD MILLION)
           FIGURE 30 EXPORT DATA FOR HS CODE 852580, BY KEY COUNTRY, 2018–2022 (USD MILLION)
    5.12 PATENT ANALYSIS 
           FIGURE 31 TOP 10 COMPANIES WITH HIGHEST NUMBER OF PATENT APPLICATIONS IN LAST 10 YEARS
           FIGURE 32 ROBOTIC VISION MARKET: PATENT ANALYSIS
           TABLE 9 TOP 20 PATENT OWNERS IN LAST 10 YEARS
           5.12.1 LIST OF MAJOR PATENTS
    5.13 KEY CONFERENCES AND EVENTS, 2023–2024 
           TABLE 10 ROBOTIC VISION MARKET: LIST OF CONFERENCES AND EVENTS
    5.14 REGULATIONS 
           5.14.1 REGULATORY BODIES, GOVERNMENT AGENCIES, AND OTHER ORGANIZATIONS
                    TABLE 11 NORTH AMERICA: LIST OF REGULATORY BODIES, GOVERNMENT AGENCIES, AND OTHER ORGANIZATIONS
                    TABLE 12 EUROPE: LIST OF REGULATORY BODIES, GOVERNMENT AGENCIES, AND OTHER ORGANIZATIONS
                    TABLE 13 ASIA PACIFIC: LIST OF REGULATORY BODIES, GOVERNMENT AGENCIES, AND OTHER ORGANIZATIONS
                    TABLE 14 ROW: LIST OF REGULATORY BODIES, GOVERNMENT AGENCIES, AND OTHER ORGANIZATIONS
    5.15 STANDARDS 
           5.15.1 INTERFACE/CONNECTIVITY
                    5.15.1.1 GigE Vision
                    5.15.1.2 USB3 Vision
                    5.15.1.3 CoaXPress (CXP)
           5.15.2 CAMERA
                    5.15.2.1 EMVA 1288
                    5.15.2.2 ASTM E57
           5.15.3 LENS
                    5.15.3.1 Japan Industrial Imaging Association (JIAA)
           5.15.4 PROGRAMMING INTERFACE
                    5.15.4.1 GenICam
                                 TABLE 15 ROBOTIC VISION MARKET: REGULATORY ANALYSIS
 
6 ROBOTIC VISION MARKET, BY DEPLOYMENT (Page No. - 86)
    6.1 INTRODUCTION 
           FIGURE 33 ROBOTIC VISION MARKET, BY DEPLOYMENT
    6.2 ROBOTIC GUIDANCE SYSTEMS 
           6.2.1 ABILITY TO MANIPULATE AND ASSEMBLE OBJECTS OF ANY SIZE AND SHAPE TO SUPPORT USE OF ROBOTIC GUIDANCE SYSTEMS
    6.3 ROBOTIC CELLS 
           6.3.1 RISING ADOPTION IN TASKS WITH DEFINED TARGET POSITION AND ORIENTATION TO DRIVE DEMAND FOR ROBOTIC CELLS
 
7 ROBOTIC VISION MARKET, BY DETECTION ALGORITHM (Page No. - 88)
    7.1 INTRODUCTION 
           FIGURE 34 ROBOTIC VISION MARKET, BY DETECTION ALGORITHM
    7.2 CONTOUR-BASED 
    7.3 CORRELATION-BASED 
    7.4 FEATURE EXTRACTION 
    7.5 CLOUD OF POINT 
 
8 ROBOTIC VISION MARKET, BY APPLICATION (Page No. - 91)
    8.1 INTRODUCTION 
           FIGURE 35 ROBOTIC VISION MARKET, BY APPLICATION
           FIGURE 36 MATERIAL HANDLING SEGMENT TO HOLD LARGEST MARKET SHARE IN 2022
    8.2 WELDING AND SOLDERING 
           8.2.1 NEED TO MAXIMIZE WELDING AND SOLDERING EFFICIENCY TO DRIVE MARKET
    8.3 MATERIAL HANDLING 
           8.3.1 OPTIMIZING MATERIAL HANDLING AND ENHANCING EFFICIENCY, ACCURACY, AND SAFETY OF WORKPLACES TO PROPEL MARKET
    8.4 PACKAGING AND PALLETIZING 
           8.4.1 PACKAGING NEEDS IN FOOD & BEVERAGE INDUSTRY TO DRIVE ADOPTION OF ROBOTIC VISION
    8.5 PAINTING 
           8.5.1 COST-EFFECTIVENESS IN PAINTING AND COATING APPLICATIONS TO BOOST MARKET
    8.6 ASSEMBLING AND DISASSEMBLING 
           8.6.1 DEMAND FOR ENHANCING PRODUCTIVITY AND PRECISION IN ASSEMBLING PROCESSES TO DRIVE MARKET
    8.7 CUTTING, PRESSING, GRINDING, AND DEBURRING 
           8.7.1 NEED TO ELIMINATE RISKS IN CUTTING, PRESSING, GRINDING, AND DEBURRING PROCESSES TO DRIVE USE OF ROBOTIC VISION SYSTEMS
    8.8 MEASUREMENT, INSPECTION, AND TESTING 
           8.8.1 PRECISE MEASUREMENT, INSPECTION, AND TESTING TASKS TO SUPPORT MARKET GROWTH
 
9 ROBOTIC VISION MARKET, BY TYPE (Page No. - 98)
    9.1 INTRODUCTION 
           FIGURE 37 ROBOTIC VISION MARKET, BY TYPE
           FIGURE 38 MARKET FOR 3D VISION SYSTEMS TO EXHIBIT HIGHER CAGR DURING FORECAST PERIOD
           TABLE 16 ROBOTIC VISION MARKET, BY TYPE, 2019–2022 (USD MILLION)
           TABLE 17 ROBOTIC VISION MARKET, BY TYPE, 2023–2028 (USD MILLION)
    9.2 2D VISION SYSTEMS 
           9.2.1 INCREASED DEPLOYMENT IN CONVENTIONAL APPLICATIONS TO DRIVE GROWTH OF 2D VISION SYSTEMS
                    TABLE 18 2D VISION SYSTEMS: ROBOTIC VISION MARKET, BY INDUSTRY, 2019–2022 (USD MILLION)
                    TABLE 19 2D VISION SYSTEMS: ROBOTIC VISION MARKET, BY INDUSTRY, 2023–2028 (USD MILLION)
                    TABLE 20 2D VISION SYSTEMS: ROBOTIC VISION MARKET, BY REGION, 2019–2022 (USD MILLION)
                    TABLE 21 2D VISION SYSTEMS: ROBOTIC VISION MARKET, BY REGION, 2023–2028 (USD MILLION)
    9.3 3D VISION SYSTEMS 
           9.3.1 SINGLE- AND MULTI-CAMERA TRIANGULATION
                    9.3.1.1 Growth in robotics field to drive adoption of single and multi-camera triangulation
           9.3.2 STRUCTURED LIGHT
                    9.3.2.1 Accurate object-mapping feature to boost use of structured light
           9.3.3 TIME-OF-FLIGHT (TOF)
                    9.3.3.1 Implementation in vision-guided solutions in large workspaces to drive market
           9.3.4 STEREO VISION
                    9.3.4.1 Suitability for 3D construction to drive demand for stereo vision
           9.3.5 LASER-BASED
                    9.3.5.1 Utilization in extracting geometric information of objects to propel laser-based vision market
                               TABLE 22 3D VISION SYSTEMS: ROBOTIC VISION MARKET, BY INDUSTRY, 2019–2022 (USD MILLION)
                               TABLE 23 3D VISION SYSTEMS: ROBOTIC VISION MARKET, BY INDUSTRY, 2023–2028 (USD MILLION)
                               TABLE 24 3D VISION SYSTEMS: ROBOTIC VISION MARKET, BY REGION, 2019–2022 (USD MILLION)
                               TABLE 25 3D VISION SYSTEMS: ROBOTIC VISION MARKET, BY REGION, 2023–2028 (USD MILLION)
 
10 ROBOTIC VISION MARKET, BY COMPONENT (Page No. - 107)
     10.1 INTRODUCTION 
             FIGURE 39 ROBOTIC VISION MARKET, BY COMPONENT
             FIGURE 40 HARDWARE SEGMENT TO HOLD LARGER MARKET SHARE DURING FORECAST PERIOD
             TABLE 26 ROBOTIC VISION MARKET, BY COMPONENT, 2019–2022 (USD MILLION)
             TABLE 27 ROBOTIC VISION MARKET, BY COMPONENT, 2023–2028 (USD MILLION)
     10.2 HARDWARE 
             TABLE 28 ROBOTIC VISION MARKET, BY HARDWARE, 2019–2022 (USD MILLION)
             TABLE 29 ROBOTIC VISION MARKET, BY HARDWARE, 2023–2028 (USD MILLION)
             10.2.1 CAMERAS
                        10.2.1.1 Smart cameras combine image capture and processing in one system
                                     TABLE 30 CAMERAS: ROBOTIC VISION MARKET, BY IMAGING SPECTRUM, 2019–2022 (USD MILLION)
                                     TABLE 31 CAMERAS: ROBOTIC VISION MARKET, BY IMAGING SPECTRUM, 2023–2028 (USD MILLION)
                        10.2.1.2 Format
                                     10.2.1.2.1 Line scan
                                                    10.2.1.2.1.1 Line scan cameras used for rapid data capturing
                                     10.2.1.2.2 Area scan
                                                    10.2.1.2.2.1 Area scan cameras capture images in fast-moving scenes
                                     10.2.1.2.3 CMOS
                                                    10.2.1.2.3.1 CMOS sensors based on photoelectric effect
                                     10.2.1.2.4 CCD
                                                    10.2.1.2.4.1 CCDs capable of creating high-quality images
                        10.2.1.3 Imaging spectrum
                                     10.2.1.3.1 Visible light
                                                    10.2.1.3.1.1 Robotic vision systems in visible spectrum have wavelengths between 400 and 700 nm
                                     10.2.1.3.2 Visible + IR
                                                    10.2.1.3.2.1 Visible + IR cameras use NIR LEDs for visible + NIR imaging
             10.2.2 LIGHTING
                        10.2.2.1 Lighting guides cameras to function properly and precisely
             10.2.3 OPTICS
                        10.2.3.1 Optical lens defines field of view for vision cameras
             10.2.4 PROCESSORS AND CONTROLLERS
                        10.2.4.1 Processors perform arithmetic operations on external data sources
                        10.2.4.2 FPGA
                                                    10.2.4.2.1.1 FPGA finds applications in various industries
                        10.2.4.3 DSP
                                     10.2.4.3.1 DSPs help fetch multiple data and instructions simultaneously
                        10.2.4.4 Microcontrollers and microprocessors
                                     10.2.4.4.1 Microcontrollers and microprocessors are specifically designed for real-time applications
                        10.2.4.5 VPU
                                     10.2.4.5.1 VPUs fulfill need for faster processing in vision-related applications
             10.2.5 FRAME GRABBERS
                        10.2.5.1 Frame grabbers process, store, and visualize multiple images simultaneously
             10.2.6 OTHERS
     10.3 SOFTWARE 
             TABLE 32 ROBOTIC VISION MARKET, BY SOFTWARE, 2019–2022 (USD MILLION)
             TABLE 33 ROBOTIC VISION MARKET, BY SOFTWARE, 2023–2028 (USD MILLION)
             10.3.1 TRADITIONAL SOFTWARE
                        10.3.1.1 Traditional software provide framework for developing robotic vision applications
             10.3.2 DEEP LEARNING SOFTWARE
                        10.3.2.1 Deep learning frameworks offer high flexibility for program developers
 
11 ROBOTIC VISION MARKET, BY INDUSTRY (Page No. - 119)
     11.1 INTRODUCTION 
             FIGURE 41 ROBOTIC VISION MARKET, BY INDUSTRY
             FIGURE 42 AUTOMOTIVE INDUSTRY TO HOLD SECOND-LARGEST MARKET SHARE IN 2023
             TABLE 34 ROBOTIC VISION MARKET, BY INDUSTRY, 2019–2022 (USD MILLION)
             TABLE 35 ROBOTIC VISION MARKET, BY INDUSTRY, 2023–2028 (USD MILLION)
     11.2 AUTOMOTIVE 
             11.2.1 AUTOMATED MANUFACTURING PROCESSES TO DRIVE MARKET
                        TABLE 36 AUTOMOTIVE: ROBOTIC VISION MARKET, BY TYPE, 2019–2022 (USD MILLION)
                        TABLE 37 AUTOMOTIVE: ROBOTIC VISION MARKET, BY TYPE, 2023–2028 (USD MILLION)
                        TABLE 38 AUTOMOTIVE: ROBOTIC VISION MARKET, BY COMPONENT, 2019–2022 (USD MILLION)
                        TABLE 39 AUTOMOTIVE: ROBOTIC VISION MARKET, BY COMPONENT, 2023–2028 (USD MILLION)
                        TABLE 40 AUTOMOTIVE: ROBOTIC VISION MARKET, BY REGION, 2019–2022 (USD MILLION)
                        TABLE 41 AUTOMOTIVE: ROBOTIC VISION MARKET, BY REGION, 2023–2028 (USD MILLION)
     11.3 ELECTRICAL & ELECTRONICS 
             11.3.1 NEED FOR IMPROVED QUALITY CONTROL, AUTOMATION, AND OBJECT RECOGNITION TO PROPEL MARKET
                        TABLE 42 ELECTRICAL & ELECTRONICS: ROBOTIC VISION MARKET, BY TYPE, 2019–2022 (USD MILLION)
                        TABLE 43 ELECTRICAL & ELECTRONICS: ROBOTIC VISION MARKET, BY TYPE, 2023–2028 (USD MILLION)
                        TABLE 44 ELECTRICAL & ELECTRONICS: ROBOTIC VISION MARKET, BY COMPONENT, 2019–2022 (USD MILLION)
                        TABLE 45 ELECTRICAL & ELECTRONICS: ROBOTIC VISION MARKET, BY COMPONENT, 2023–2028 (USD MILLION)
                        TABLE 46 ELECTRICAL & ELECTRONICS: ROBOTIC VISION MARKET, BY REGION, 2019–2022 (USD MILLION)
                        TABLE 47 ELECTRICAL & ELECTRONICS: ROBOTIC VISION MARKET, BY REGION, 2023–2028 (USD MILLION)
     11.4 CHEMICALS, RUBBER, & PLASTICS 
             11.4.1 USE IN MATERIAL HANDLING AND INSPECTION TASKS TO SUPPORT DEMAND FOR ROBOTIC VISION
                        TABLE 48 CHEMICALS, RUBBER, & PLASTICS: ROBOTIC VISION MARKET, BY TYPE, 2019–2022 (USD MILLION)
                        TABLE 49 CHEMICALS, RUBBER, & PLASTICS: ROBOTIC VISION MARKET, BY TYPE, 2023–2028 (USD MILLION)
                        TABLE 50 CHEMICALS, RUBBER, & PLASTICS: ROBOTIC VISION MARKET, BY COMPONENT, 2019–2022 (USD MILLION)
                        TABLE 51 CHEMICALS, RUBBER, & PLASTICS: ROBOTIC VISION MARKET, BY COMPONENT, 2023–2028 (USD MILLION)
                        TABLE 52 CHEMICALS, RUBBER, & PLASTICS: ROBOTIC VISION MARKET, BY REGION, 2019–2022 (USD MILLION)
                        TABLE 53 CHEMICALS, RUBBER, & PLASTICS: ROBOTIC VISION MARKET, BY REGION, 2023–2028 (USD MILLION)
     11.5 METALS & MACHINERY 
             11.5.1 SHORTAGE OF SKILLED LABOR TO FUEL MARKET GROWTH
                        TABLE 54 METALS & MACHINERY: ROBOTIC VISION MARKET, BY TYPE, 2019–2022 (USD MILLION)
                        TABLE 55 METALS & MACHINERY: ROBOTIC VISION MARKET, BY TYPE, 2023–2028 (USD MILLION)
                        TABLE 56 METALS & MACHINERY: ROBOTIC VISION MARKET, BY COMPONENT, 2019–2022 (USD MILLION)
                        TABLE 57 METALS & MACHINERY: ROBOTIC VISION MARKET, BY COMPONENT, 2023–2028 (USD MILLION)
                        TABLE 58 METALS & MACHINERY: ROBOTIC VISION MARKET, BY REGION, 2019–2022 (USD MILLION)
                        TABLE 59 METALS & MACHINERY: ROBOTIC VISION MARKET, BY REGION, 2023–2028 (USD MILLION)
     11.6 FOOD & BEVERAGES 
             11.6.1 NEED TO MAINTAIN PRODUCT CONSISTENCY AND FOOD & BEVERAGE SAFETY TO FUEL ADOPTION OF VISION-GUIDED ROBOTS
                        TABLE 60 FOOD & BEVERAGES: ROBOTIC VISION MARKET, BY TYPE, 2019–2022 (USD MILLION)
                        TABLE 61 FOOD & BEVERAGES: ROBOTIC VISION MARKET, BY TYPE, 2023–2028 (USD MILLION)
                        TABLE 62 FOOD & BEVERAGES: ROBOTIC VISION MARKET, BY COMPONENT, 2019–2022 (USD MILLION)
                        TABLE 63 FOOD & BEVERAGES: ROBOTIC VISION MARKET, BY COMPONENT, 2023–2028 (USD MILLION)
                        TABLE 64 FOOD & BEVERAGES: ROBOTIC VISION MARKET, BY REGION, 2019–2022 (USD MILLION)
                        TABLE 65 FOOD & BEVERAGES: ROBOTIC VISION MARKET, BY REGION, 2023–2028 (USD MILLION)
     11.7 PRECISION ENGINEERING & OPTICS 
             11.7.1 GROWING REQUIREMENT FOR SUPPLY OF PRECISION-ENGINEERED COMPONENTS TO MAJOR INDUSTRIES TO PROPEL MARKET
                        TABLE 66 PRECISION ENGINEERING & OPTICS: ROBOTIC VISION MARKET, BY TYPE, 2019–2022 (USD MILLION)
                        TABLE 67 PRECISION ENGINEERING & OPTICS: ROBOTIC VISION MARKET, BY TYPE, 2023–2028 (USD MILLION)
                        TABLE 68 PRECISION ENGINEERING & OPTICS: ROBOTIC VISION MARKET, BY COMPONENT, 2019–2022 (USD MILLION)
                        TABLE 69 PRECISION ENGINEERING & OPTICS: ROBOTIC VISION MARKET, BY COMPONENT, 2023–2028 (USD MILLION)
                        TABLE 70 PRECISION ENGINEERING & OPTICS: ROBOTIC VISION MARKET, BY REGION, 2019–2022 (USD MILLION)
                        TABLE 71 PRECISION ENGINEERING & OPTICS: ROBOTIC VISION MARKET, BY REGION, 2023–2028 (USD MILLION)
     11.8 PHARMACEUTICALS & COSMETICS 
             11.8.1 CRUCIAL INSPECTION TASKS IN PHARMACEUTICAL PLANTS TO BOOST DEMAND FOR ROBOTIC VISION
                        TABLE 72 PHARMACEUTICALS & COSMETICS: ROBOTIC VISION MARKET, BY TYPE, 2019–2022 (USD MILLION)
                        TABLE 73 PHARMACEUTICALS & COSMETICS: ROBOTIC VISION MARKET, BY TYPE, 2023–2028 (USD MILLION)
                        TABLE 74 PHARMACEUTICALS & COSMETICS: ROBOTIC VISION MARKET, BY COMPONENT, 2019–2022 (USD MILLION)
                        TABLE 75 PHARMACEUTICALS & COSMETICS: ROBOTIC VISION MARKET, BY COMPONENT, 2023–2028 (USD MILLION)
                        TABLE 76 PHARMACEUTICALS & COSMETICS: ROBOTIC VISION MARKET, BY REGION, 2019–2022 (USD MILLION)
                        TABLE 77 PHARMACEUTICALS & COSMETICS: ROBOTIC VISION MARKET, BY REGION, 2023–2028 (USD MILLION)
     11.9 OTHERS 
             TABLE 78 OTHERS: ROBOTIC VISION MARKET, BY TYPE, 2019–2022 (USD MILLION)
             TABLE 79 OTHERS: ROBOTIC VISION MARKET, BY TYPE, 2023–2028 (USD MILLION)
             TABLE 80 OTHERS: ROBOTIC VISION MARKET, BY COMPONENT, 2019–2022 (USD MILLION)
             TABLE 81 OTHERS: ROBOTIC VISION MARKET, BY COMPONENT, 2023–2028 (USD MILLION)
             TABLE 82 OTHERS: ROBOTIC VISION MARKET, BY REGION, 2019–2022 (USD MILLION)
             TABLE 83 OTHERS: ROBOTIC VISION MARKET, BY REGION, 2023–2028 (USD MILLION)
 
12 ROBOTIC VISION MARKET, BY REGION (Page No. - 142)
     12.1 INTRODUCTION 
             FIGURE 43 ROBOTIC VISION MARKET: REGIONAL SNAPSHOT
             FIGURE 44 ROBOTIC VISION MARKET IN ASIA PACIFIC TO RECORD HIGHEST CAGR DURING FORECAST PERIOD
             TABLE 84 ROBOTIC VISION MARKET, BY REGION, 2019–2022 (USD MILLION)
             TABLE 85 ROBOTIC VISION MARKET, BY REGION, 2023–2028 (USD MILLION)
     12.2 NORTH AMERICA 
             12.2.1 IMPACT OF RECESSION ON ROBOTIC VISION MARKET IN NORTH AMERICA
                        FIGURE 45 NORTH AMERICA: ROBOTIC VISION MARKET SNAPSHOT
                        TABLE 86 NORTH AMERICA: ROBOTIC VISION MARKET, BY COUNTRY, 2019–2022 (USD MILLION)
                        TABLE 87 NORTH AMERICA: ROBOTIC VISION MARKET, BY COUNTRY, 2023–2028 (USD MILLION)
                        TABLE 88 NORTH AMERICA: ROBOTIC VISION MARKET, BY TYPE, 2019–2022 (USD MILLION)
                        TABLE 89 NORTH AMERICA: ROBOTIC VISION MARKET, BY TYPE, 2023–2028 (USD MILLION)
                        TABLE 90 NORTH AMERICA: ROBOTIC VISION MARKET, BY INDUSTRY, 2019–2022 (USD MILLION)
                        TABLE 91 NORTH AMERICA: ROBOTIC VISION MARKET, BY INDUSTRY, 2023–2028 (USD MILLION)
             12.2.2 US
                        12.2.2.1 Automotive industry to offer lucrative opportunities
             12.2.3 CANADA
                        12.2.3.1 Government initiatives to favor market growth
             12.2.4 MEXICO
                        12.2.4.1 Growing focus of manufacturing sector on automation to boost market
     12.3 EUROPE 
             12.3.1 IMPACT OF RECESSION ON ROBOTIC VISION MARKET IN EUROPE
                        FIGURE 46 EUROPE: ROBOTIC VISION MARKET SNAPSHOT
                        TABLE 92 EUROPE: ROBOTIC VISION MARKET, BY COUNTRY, 2019–2022 (USD MILLION)
                        TABLE 93 EUROPE: ROBOTIC VISION MARKET, BY COUNTRY, 2023–2028 (USD MILLION)
                        TABLE 94 EUROPE: ROBOTIC VISION MARKET, BY TYPE, 2019–2022 (USD MILLION)
                        TABLE 95 EUROPE: ROBOTIC VISION MARKET, BY TYPE, 2023–2028 (USD MILLION)
                        TABLE 96 EUROPE: ROBOTIC VISION MARKET, BY INDUSTRY, 2019–2022 (USD MILLION)
                        TABLE 97 EUROPE: ROBOTIC VISION MARKET, BY INDUSTRY, 2023–2028 (USD MILLION)
             12.3.2 GERMANY
                        12.3.2.1 Established industrial robot market to boost demand
             12.3.3 UK
                        12.3.3.1 Incorporation of vision systems into automobiles to improve product quality to drive market
             12.3.4 FRANCE
                        12.3.4.1 Growing focus of food & beverage giants on automation to develop market
             12.3.5 ITALY
                        12.3.5.1 Growing industrial automation to propel market
             12.3.6 SPAIN
                        12.3.6.1 Encouragement from government to purchase EVs and HEVs to benefit market
             12.3.7 REST OF EUROPE
     12.4 ASIA PACIFIC 
             12.4.1 IMPACT OF RECESSION ON ROBOTIC VISION MARKET IN ASIA PACIFIC
                        FIGURE 47 ASIA PACIFIC: ROBOTIC VISION MARKET SNAPSHOT
                        TABLE 98 ASIA PACIFIC: ROBOTIC VISION MARKET, BY COUNTRY, 2019–2022 (USD MILLION)
                        TABLE 99 ASIA PACIFIC: ROBOTIC VISION MARKET, BY COUNTRY, 2023–2028 (USD MILLION)
                        TABLE 100 ASIA PACIFIC: ROBOTIC VISION MARKET, BY TYPE, 2019–2022 (USD MILLION)
                        TABLE 101 ASIA PACIFIC: ROBOTIC VISION MARKET, BY TYPE, 2023–2028 (USD MILLION)
                        TABLE 102 ASIA PACIFIC: ROBOTIC VISION MARKET, BY INDUSTRY, 2019–2022 (USD MILLION)
                        TABLE 103 ASIA PACIFIC: ROBOTIC VISION MARKET, BY INDUSTRY, 2023–2028 (USD MILLION)
             12.4.2 CHINA
                        12.4.2.1 Electronics and semiconductor industries to generate significant demand
             12.4.3 JAPAN
                        12.4.3.1 Presence of prominent vision sensor manufacturers to boost demand
             12.4.4 SOUTH KOREA
                        12.4.4.1 Robust manufacturing sector to benefit market
             12.4.5 TAIWAN
                        12.4.5.1 Development of smart factories, machinery, technology, and transport infrastructure to benefit market
             12.4.6 INDIA
                        12.4.6.1 High import tariffs on automobiles and electronics to fuel market
             12.4.7 REST OF ASIA PACIFIC
     12.5 ROW 
             12.5.1 IMPACT OF RECESSION ON ROBOTIC VISION MARKET IN ROW
                        FIGURE 48 MIDDLE EAST & AFRICA TO DOMINATE MARKET IN ROW DURING FORECAST PERIOD
                        TABLE 104 ROW: ROBOTIC VISION MARKET, BY REGION, 2019–2022 (USD MILLION)
                        TABLE 105 ROW: ROBOTIC VISION MARKET, BY REGION, 2023–2028 (USD MILLION)
                        TABLE 106 ROW: ROBOTIC VISION MARKET, BY TYPE, 2019–2022 (USD MILLION)
                        TABLE 107 ROW: ROBOTIC VISION MARKET, BY TYPE, 2023–2028 (USD MILLION)
                        TABLE 108 ROW: ROBOTIC VISION MARKET, BY INDUSTRY, 2019–2022 (USD MILLION)
                        TABLE 109 ROW: ROBOTIC VISION MARKET, BY INDUSTRY, 2023–2028 (USD MILLION)
             12.5.2 MIDDLE EAST & AFRICA
                        12.5.2.1 Rising adoption of robotic vision systems in plastic and food & beverage industry to develop market
             12.5.3 SOUTH AMERICA
                        12.5.3.1 Ongoing economic reforms to offer lucrative growth opportunities
 
13 COMPETITIVE LANDSCAPE (Page No. - 167)
     13.1 INTRODUCTION 
             TABLE 110 KEY STRATEGIES ADOPTED BY MAJOR PLAYERS IN ROBOTIC VISION MARKET, 2021–2023
     13.2 REVENUE ANALYSIS OF TOP FIVE COMPANIES 
             FIGURE 49 ROBOTIC VISION MARKET: REVENUE ANALYSIS, 2019–2022
     13.3 MARKET SHARE ANALYSIS, 2022 
             TABLE 111 ROBOTIC VISION MARKET: DEGREE OF COMPETITION
             FIGURE 50 ROBOTIC VISION MARKET SHARE ANALYSIS, 2022
     13.4 KEY COMPANY EVALUATION MATRIX, 2022 
             13.4.1 STARS
             13.4.2 EMERGING LEADERS
             13.4.3 PERVASIVE PLAYERS
             13.4.4 PARTICIPANTS
                        FIGURE 51 ROBOTIC VISION MARKET: KEY COMPANY EVALUATION MATRIX, 2022
     13.5 STARTUPS/SMES EVALUATION MATRIX, 2022 
             13.5.1 PROGRESSIVE COMPANIES
             13.5.2 RESPONSIVE COMPANIES
             13.5.3 DYNAMIC COMPANIES
             13.5.4 STARTING BLOCKS
                        FIGURE 52 ROBOTIC VISION MARKET: STARTUPS/SMES EVALUATION MATRIX, 2022
     13.6 COMPETITIVE BENCHMARKING 
             TABLE 112 ROBOTIC VISION MARKET: LIST OF KEY STARTUPS/SMES
             TABLE 113 ROBOTIC VISION MARKET: COMPETITIVE BENCHMARKING OF KEY STARTUPS/SMES
             13.6.1 ROBOTIC VISION MARKET FOOTPRINT
                        TABLE 114 COMPANY FOOTPRINT
                        TABLE 115 TYPE: COMPANY FOOTPRINT
                        TABLE 116 INDUSTRY: COMPANY FOOTPRINT
                        TABLE 117 REGION: COMPANY FOOTPRINT
     13.7 COMPETITIVE SCENARIOS AND TRENDS 
             13.7.1 PRODUCT LAUNCHES
                        TABLE 118 ROBOTIC VISION MARKET: PRODUCT LAUNCHES, 2021–2023
             13.7.2 DEALS
                        TABLE 119 ROBOTIC VISION MARKET: DEALS, 2021–2022
             13.7.3 OTHERS
                        TABLE 120 ROBOTIC VISION MARKET: OTHERS, 2021–2022
 
14 COMPANY PROFILES (Page No. - 189)
(Business Overview, Products/Solutions/Services Offered, Recent Developments, and MnM View (Key strengths/Right to Win, Strategic Choices Made, and Weaknesses and Competitive Threats))*  
     14.1 KEY PLAYERS 
             14.1.1 COGNEX CORPORATION
                        TABLE 121 COGNEX CORPORATION: BUSINESS OVERVIEW
                        FIGURE 53 COGNEX CORPORATION: COMPANY SNAPSHOT
                        TABLE 122 COGNEX CORPORATION: PRODUCTS/SOLUTIONS/SERVICES OFFERED
                        TABLE 123 COGNEX CORPORATION: PRODUCT LAUNCHES
             14.1.2 BASLER AG
                        TABLE 124 BASLER AG: BUSINESS OVERVIEW
                        FIGURE 54 BASLER AG: COMPANY SNAPSHOT
                        TABLE 125 BASLER AG: PRODUCTS/SOLUTIONS/SERVICES OFFERED
                        TABLE 126 BASLER AG: PRODUCT LAUNCHES
             14.1.3 OMRON CORPORATION
                        TABLE 127 OMRON CORPORATION: BUSINESS OVERVIEW
                        FIGURE 55 OMRON CORPORATION: COMPANY SNAPSHOT
                        TABLE 128 OMRON CORPORATION: PRODUCTS/SOLUTIONS/SERVICES OFFERED
                        TABLE 129 OMRON CORPORATION: PRODUCT LAUNCHES
             14.1.4 NATIONAL INSTRUMENTS CORP.
                        TABLE 130 NATIONAL INSTRUMENTS CORP.: BUSINESS OVERVIEW
                        FIGURE 56 NATIONAL INSTRUMENTS CORP.: COMPANY SNAPSHOT
                        TABLE 131 NATIONAL INSTRUMENTS CORP.: PRODUCTS/SOLUTIONS/SERVICES OFFERED
             14.1.5 KEYENCE CORPORATION
                        TABLE 132 KEYENCE CORPORATION: BUSINESS OVERVIEW
                        FIGURE 57 KEYENCE CORPORATION: COMPANY SNAPSHOT
                        TABLE 133 KEYENCE CORPORATION: PRODUCTS/SOLUTIONS/SERVICES OFFERED
                        TABLE 134 KEYENCE CORPORATION: PRODUCT LAUNCHES
             14.1.6 TELEDYNE DALSA
                        TABLE 135 TELEDYNE DALSA: BUSINESS OVERVIEW
                        FIGURE 58 TELEDYNE DALSA: COMPANY SNAPSHOT
                        TABLE 136 TELEDYNE DALSA: PRODUCTS/SOLUTIONS/SERVICES OFFERED
                        TABLE 137 TELEDYNE DALSA: PRODUCT LAUNCHES
             14.1.7 SICK AG
                        TABLE 138 SICK AG: BUSINESS OVERVIEW
                        FIGURE 59 SICK AG: COMPANY SNAPSHOT
                        TABLE 139 SICK AG: PRODUCTS/SOLUTIONS/SERVICES OFFERED
                        TABLE 140 SICK AG: PRODUCT LAUNCHES
             14.1.8 TORDIVEL AS
                        TABLE 141 TORDIVEL AS: BUSINESS OVERVIEW
                        TABLE 142 TORDIVEL AS: PRODUCTS/SOLUTIONS/SERVICES OFFERED
             14.1.9 HEXAGON AB
                        TABLE 143 HEXAGON AB: BUSINESS OVERVIEW
                        FIGURE 60 HEXAGON AB: COMPANY SNAPSHOT
                        TABLE 144 HEXAGON AB: PRODUCTS/SOLUTIONS/SERVICES OFFERED
             14.1.10 ADVANTECH CO., LTD.
                        TABLE 145 ADVANTECH CO., LTD.: BUSINESS OVERVIEW
                        FIGURE 61 ADVANTECH CO., LTD.: COMPANY SNAPSHOT
                        TABLE 146 ADVANTECH CO., LTD.: PRODUCTS/SOLUTIONS/SERVICES OFFERED
                        TABLE 147 ADVANTECH CO., LTD.: PRODUCT LAUNCHES
             14.1.11 YASKAWA AMERICA, INC.
                        TABLE 148 YASKAWA AMERICA, INC.: BUSINESS OVERVIEW
                        FIGURE 62 YASKAWA AMERICA, INC.: COMPANY SNAPSHOT
                        TABLE 149 YASKAWA AMERICA, INC.: PRODUCTS/SOLUTIONS/SERVICES OFFERED
             14.1.12 ISRA VISION
                        TABLE 150 ISRA VISION: BUSINESS OVERVIEW
                        FIGURE 63 ISRA VISION: COMPANY SNAPSHOT
                        TABLE 151 ISRA VISION: PRODUCTS/SOLUTIONS/SERVICES OFFERED
                        TABLE 152 ISRA VISION: PRODUCT LAUNCHES
             14.1.13 FANUC CORPORATION
                        TABLE 153 FANUC CORPORATION: BUSINESS OVERVIEW
                        FIGURE 64 FANUC CORPORATION: COMPANY SNAPSHOT
                        TABLE 154 FANUC CORPORATION: PRODUCTS/SOLUTIONS/SERVICES OFFERED
                        TABLE 155 FANUC CORPORATION: PRODUCT LAUNCHES
             14.1.14 ABB
                        TABLE 156 ABB: BUSINESS OVERVIEW
                        FIGURE 65 ABB: COMPANY SNAPSHOT
                        TABLE 157 ABB: PRODUCTS/SOLUTIONS/SERVICES OFFERED
             14.1.15 QUALCOMM TECHNOLOGIES, INC.
                        TABLE 158 QUALCOMM TECHNOLOGIES, INC.: BUSINESS OVERVIEW
                        FIGURE 66 QUALCOMM TECHNOLOGIES, INC.: COMPANY SNAPSHOT
                        TABLE 159 QUALCOMM TECHNOLOGIES, INC.: PRODUCTS/SOLUTIONS/SERVICES OFFERED
                        TABLE 160 QUALCOMM TECHNOLOGIES, INC.: PRODUCT LAUNCHES
     14.2 OTHER PLAYERS 
             14.2.1 LMI TECHNOLOGIES INC.
             14.2.2 INDUSTRIAL VISION SYSTEMS
             14.2.3 VITRONIC
             14.2.4 MATROX ELECTRONIC SYSTEMS LTD.
             14.2.5 ADLINK TECHNOLOGY INC.
             14.2.6 ZIVID
             14.2.7 STEMMER IMAGING LTD.
             14.2.8 MVTEC SOFTWARE GMBH
             14.2.9 WENGLOR SENSORIC GMBH
             14.2.10 AQUIFI
             14.2.11 IDS IMAGING DEVELOPMENT SYSTEMS GMBH
*Details on Business Overview, Products/Solutions/Services Offered, Recent Developments, and MnM View (Key strengths/Right to Win, Strategic Choices Made, and Weaknesses and Competitive Threats) might not be captured in case of unlisted companies.  
 
15 ADJACENT AND RELATED MARKET (Page No. - 254)
     15.1 INTRODUCTION 
     15.2 LIMITATIONS 
     15.3 COLLABORATIVE ROBOT MARKET, BY COMPONENT 
             TABLE 161 COLLABORATIVE ROBOT (COBOT) MARKET, BY COMPONENT, 2018–2021 (USD MILLION)
             TABLE 162 COLLABORATIVE ROBOT (COBOT) MARKET, BY COMPONENT, 2022–2028 (USD MILLION)
     15.4 HARDWARE 
             TABLE 163 HARDWARE: COLLABORATIVE ROBOT (COBOT) MARKET, BY COMPONENT, 2018–2021 (USD MILLION)
             TABLE 164 HARDWARE: COLLABORATIVE ROBOT (COBOT) MARKET, BY COMPONENT, 2022–2028 (USD MILLION)
             15.4.1 ROBOTIC ARMS
                        15.4.1.1 Robotic arm design defined by ISO/TS 15066 standard
             15.4.2 END EFFECTORS OR END-OF-ARM TOOLS (EOATS)
                        15.4.2.1 Welding guns
                                     TABLE 165 PLAYERS MANUFACTURING ROBOTIC WELDING GUNS
                        15.4.2.2 Grippers
                                     15.4.2.2.1 Pneumatic
                                                    15.4.2.2.1.1 Pneumatic grippers require external air supply to operate
                                     15.4.2.2.2 Electric
                                                    15.4.2.2.2.1 Electric grippers are easiest to program and operate compared with other gripper
           TABLE 166 PLAYERS MANUFACTURING ELECTRIC GRIPPERS
                                     15.4.2.2.3 Dexterous robotic hands
                                                    15.4.2.2.3.1 4-finger robotic hand may be used without robotic arms
                                                    15.4.2.2.3.2 5-finger robotic hands used in combination with industrial and collaborative robotic arms
                                     15.4.2.2.4 Vacuum
                                                    15.4.2.2.4.1 Vacuum grippers can easily handle uneven and large area workpieces
                                     15.4.2.2.5 Magnetic
                                                    15.4.2.2.5.1 Magnetic grippers less popular as other types of grippers
           TABLE 167 PLAYERS MANUFACTURING MAGNETIC GRIPPERS
                        15.4.2.3 Robotic screwdrivers
                        15.4.2.4 Sanding and deburring tools
                        15.4.2.5 Others
             15.4.3 DRIVES
                        15.4.3.1 Drives convert electrical energy into mechanical energy
             15.4.4 CONTROLLERS
                        15.4.4.1 Controllers carry out necessary instructions required to operate cobots
             15.4.5 SENSORS
                        15.4.5.1 Sensors help measure and translate information into meaningful data
             15.4.6 POWER SUPPLY
                        15.4.6.1 Most cobots operate at 24 or 48 V
             15.4.7 MOTORS
                        15.4.7.1 Cobots fitted with light but powerful motors
             15.4.8 OTHERS
     15.5 SOFTWARE 
             15.5.1 MANUFACTURERS TO INVEST SUBSTANTIAL EFFORTS TO DEVELOP INTUITIVE PROGRAMMING SOFTWARE
 
16 APPENDIX (Page No. - 267)
     16.1 INSIGHTS FROM INDUSTRY EXPERTS 
     16.2 DISCUSSION GUIDE 
     16.3 KNOWLEDGESTORE: MARKETSANDMARKETS’ SUBSCRIPTION PORTAL 
     16.4 CUSTOMIZATION OPTIONS 
     16.5 RELATED REPORTS 
     16.6 AUTHOR DETAILS 


The study involves four significant activities for estimating the size of the Robotic Vision market. Exhaustive secondary research has been conducted to collect information related to the market. The next step is to validate these findings and assumptions related to the market size with industry experts across the value chain through primary research. Both top-down and bottom-up approaches have been employed to estimate the overall size of the Robotic Vision market. After that, market breakdown and data triangulation procedures were used to determine the extent of different segments and subsegments of the market.

Secondary Research

Secondary sources for this research study included corporate filings (such as annual reports, investor presentations, and financial statements); trade, business, and professional associations; white papers; certified publications; articles by recognized authors; directories; and databases. The secondary data has been collected and analyzed to determine the overall market size, further validated through primary research.

Primary Research

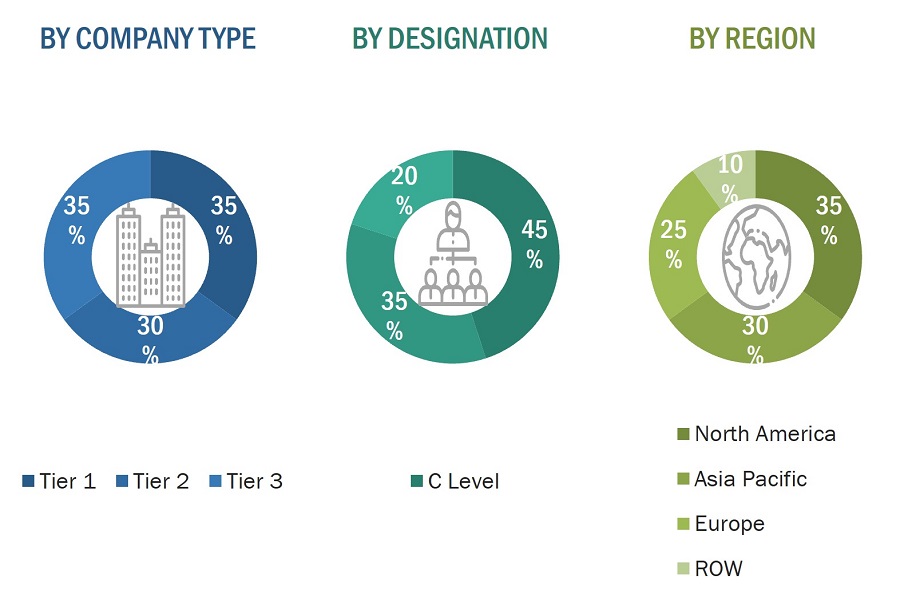
Extensive primary research has been conducted after gaining knowledge about the current scenario of the Robotic Vision market through secondary research. Several primary interviews have been conducted with experts from the demand and supply sides across four major regions—North America, Europe, Asia Pacific, and RoW. This primary data has been collected through questionnaires, emails, and telephonic interviews.
Robotic Vision Market Size, and Share

To know about the assumptions considered for the study, download the pdf brochure

Market Size Estimation

In the complete market engineering process, top-down and bottom-up approaches and several data triangulation methods have been implemented to estimate and validate the size of the Robotic Vision market and other dependent submarkets listed in this report.

  • The key players in the industry and markets have been identified through extensive secondary research.
  • The supply chain of the industry and the market size, in terms of value, have been determined through primary and secondary research.
  • All percentage shares, splits, and breakdowns have been determined using secondary sources and verified through primary sources.

Robotic Vision Market: Top-Down Approach

  • In the top-down approach, the overall market size has been used to estimate the size of the individual markets (mentioned in the market segmentation) through percentage splits obtained from secondary and primary research.
  •  For calculating the Robotic Vision market segments, the market size obtained by implementing the bottom-up approach has been used to implement the top-down approach, which was later confirmed with the primary respondents across different regions.
  • The bottom-up approach has also been implemented for the data extracted from secondary research to validate the market size of various segments.
  • Each company’s market share has been estimated to verify the revenue shares used earlier in the bottom-up approach. With the help of data triangulation and validation of data through primaries, the size of the overall Robotic Vision and each market have been determined and confirmed in this study.

Robotic Vision Market Size, and Top-Down Approach

Data Triangulation

After arriving at the overall market size, the total market has been split into several segments. The market breakdown and data triangulation procedures have been employed wherever applicable to complete the overall market engineering process and arrive at exact statistics for all segments. The data was then triangulated by studying various factors and trends from both the demand and supply sides. The market has also been validated using both top-down and bottom-up approaches.

Market Definition

Robotic vision is the integration of machine vision systems with industrial robots. It is the method of characterizing, processing, and decoding data from the images, leading to vision-based dynamic inspection, robot arm guidance, and enhanced identification of defective products. The robot has been programmed through an algorithm and fitted with a camera to capture images of each object with which it can communicate. Robots coupled with 2D or 3D vision systems can be made to perform various tasks—from basic inspection to more complex pick and place operations. The Key players in the Robotic Vision Market are Cognex Corporation (US), Basler AG (Germany), OMRON Corporation (Japan), National Instruments Corporation (US), Keyence Corporation (Japan), Teledyne DALSA (Canada), Sick AG (Germany), Torvidel AS (Norway), Hexagon AB (Sweden), Advantech (Taiwan), Yaskawa America, Inc. (Japan), ISRA VISION (Germany), FANUC CORPORATION (Japan), ABB (Switzerland), Qualcomm Incorporated (US), LMI TECHNOLOGIES INC. (Canada), Industrial Vision Systems (UK), VITRONIC (Germany), Matrox Electronic Systems Ltd (Canada), ADLINK Technology Inc. (Taiwan), Zivid (Norway), STEMMER IMAGING Ltd. (Germany), MVTec Software GmbH (Germany), Wenglor Sensoric GmbH (Germany), Aquifi (US).

Key Stakeholders

  • Original equipment manufacturers (OEMs)
  • Providers of technology solutions
  • Research institutes
  • Market research and consulting firms
  • Forums, alliances, and associations related to Robotic Vision
  • Technology investors
  • Governments and financial institutions
  • Analysts and strategic business planners
  • Existing end users and prospective ones

Report Objectives:

  • To describe and forecast the Robotic Vision market in terms of value based on Type, Component, and Industry
  • To describe and forecast the Robotic Vision market size in terms of value for four main regions, namely, North America, Europe, Asia Pacific, and the Rest of the World (RoW)
  • To provide detailed information regarding the drivers, restraints, opportunities, and challenges influencing the growth of the Robotic Vision market
  • To provide a detailed overview of the supply chain of the ecosystem
  • To analyze opportunities in the market for various stakeholders by identifying the high-growth segments of the market
  • To analyze the probable impact of the recession on the market in future
  • To benchmark the market players using the proprietary company evaluation matrix framework, which analyzes the market players on various parameters within the broad categories of market ranking/share and product portfolio.
  • To analyze competitive developments such as acquisitions, product launches, partnerships, expansions, and collaborations undertaken in the Robotic Vision market

Available Customization

With the given market data, MarketsandMarkets offers customizations according to the company’s specific needs. The following customization options are available for this report:

Company Information:

  • Detailed analysis and profiling of additional five market players
Custom Market Research Services

We will customize the research for you, in case the report listed above does not meet with your exact requirements. Our custom research will comprehensively cover the business information you require to help you arrive at strategic and profitable business decisions.

Request Customization

Instant Answers with GPT - Ask Now!

Ask real questions. Get complete answers !
Report Code
SE 4176
Published ON
Jul, 2023
Choose License Type
BUY NOW
  • SHARE
X
Request Customization
Speak to Analyst
Speak to Analyst
OR FACE-TO-FACE MEETING
PERSONALIZE THIS RESEARCH
  • Triangulate with your Own Data
  • Get Data as per your Format and Definition
  • Gain a Deeper Dive on a Specific Application, Geography, Customer or Competitor
  • Any level of Personalization
REQUEST A FREE CUSTOMIZATION
LET US HELP YOU!
  • What are the Known and Unknown Adjacencies Impacting the Robotic Vision Market
  • What will your New Revenue Sources be?
  • Who will be your Top Customer; what will make them switch?
  • Defend your Market Share or Win Competitors
  • Get a Scorecard for Target Partners
CUSTOMIZED WORKSHOP REQUEST
+1-888-600-6441
  • Call Us
  • +1-888-600-6441 (Corporate office hours)
  • +1-888-600-6441 (US/Can toll free)
  • +44-800-368-9399 (UK office hours)
CONNECT WITH US
ABOUT TRUST ONLINE
©2024 MarketsandMarkets Research Private Ltd. All rights reserved
DMCA.com Protection Status Website Feedback