Secure Web Gateway Market by Component (Solutions (Threat Protection, Access Control, and Data Protection) and Services), Deployment Mode, Organization Size, Vertical (Healthcare, BFSI, IT & Telecom, and Education), and Region - Global Forecast to 2024


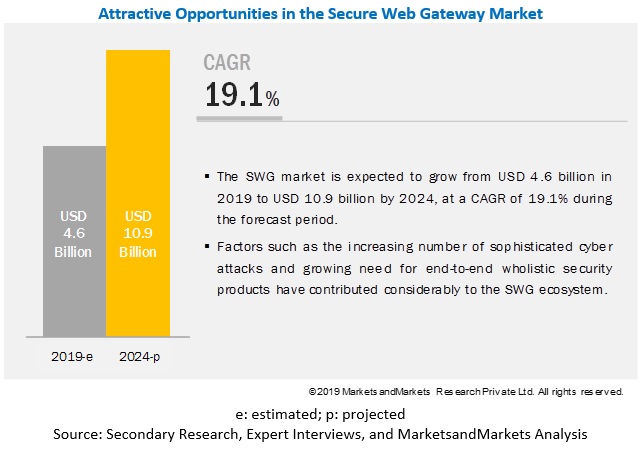
[159 Pages Report] The global Secure Web Gateway (SWG) market size is projected to grow from USD 4.6 billion in 2019 to USD 10.9 billion by 2024, at a Compound Annual Growth Rate (CAGR) of 19.1% from 2019 to 2024. The major factors driving the market growth include the increased number of sophisticated cyber attacks.
Among solutions, the threat prevention segment to hold the highest market share during the forecast period
Threat prevention includes sandboxes, Domain Name System (DNS) security, advanced protection, and antivirus. Sandboxes are used to safely execute suspicious code, without harming host devices or networks. They provide zero-day protection that scales to all users on or off networks. DNS security provides authentication for the origin of DNS data, helping to safeguard against attacks and protect data integrity. It routes suspicious C2 connections to SWG solution providers for inspection. Advanced protection includes real-time protection from malicious web content. Antivirus ensures complete malware protection sourced from various threat feeds. Hence, the threat prevention segment is expected to grow at the highest growth rate across the globe.
Based on verticals, the banking, financial services, and insurance vertical to hold the highest market share during the forecast period
The Banking, Financial Services, and Insurance (BFSI) vertical is always on the lookout for security products and services to protect the industry�s employees, customers, assets, offices, branches, and operations, and this vertical therefore holds a significant percentage of the total SWG market. This vertical is continuously upgrading its processing and transaction technologies, and therefore, requires end-to-end security solutions to protect operations from both internal and external threats. Additionally, the vertical is continuously introducing new and improved financial products and services for improving its business operations, which attracts fraudsters to attack customers and other sensitive information. Smart banking, internet banking, and mobile banking are the factors that have led the BFSI vertical to focus more on SWG.
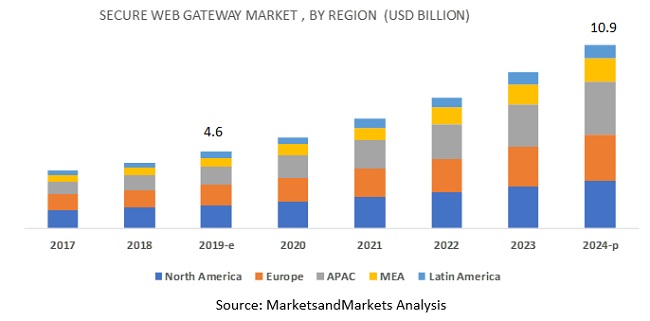
Asia Pacific to have the highest market share during the forecast period
During the last decade, the region has undergone tremendous economic growth, political transformation, and social change. Owing to the sophistication of threats, countries such as Hong Kong, India, Japan, and Singapore have updated or launched new national security policies. According to a report by Cisco, 25% of Asia Pacific (APAC) organizations have experienced an Operational Technology (OT) attack, and the rest expect it to become a trend in the years to follow. In terms of threats, Ransomware attacks were majorly seen in this region, followed by Distributed Denial of Service (DDoS) and targeted attacks such as phishing and email spoofing. The growing awareness of security breaches and their impact on customer trust and reputation of companies has led to the demand for SWG solutions in the region.
Secure Web Gateway Market Players:
Key market players profiled in this report are NortonLifeLock (US), Zscaler (US), Cisco (US), Check Point Software Technologies (Israel), Sophos Group PLC (UK), Forcepoint (US), Trend Micro Incorporated (Japan), Comodo Group (US), McAfee LLC (US), Thoma Bravo (US), Netskope (US), A10 Networks Inc (US), Cyren (US), Sangfor Technologies (China), Cato Networks (Israel), Content Keeper (Australia), iboss (US), Menlo Security (US), F5 Networks (US), and Citrix Systems (US). These players offer SWG solutions to cater to the demands and needs of customers. The major growth strategies adopted by these players include partnerships, collaborations and agreements, and new product launches/product enhancements.
Scope of the Secure Web Gateway Market Report
|
Report Metrics |
Details |
|
Market size available for years |
2017�2024 |
|
Base year considered |
2018 |
|
Forecast period |
2019�2024 |
|
Forecast units |
Value (USD Million) |
|
Segments covered |
Components, Solutions, Deployment Modes, Organization Size, Verticals, and Regions |
|
Geographies covered |
North America, Europe, APAC, MEA, and Latin America |
|
Companies covered |
NortonLifeLock (US), Zscaler (US), Cisco (US), Check Point Software Technologies (Israel), Sophos Group PLC (UK), Forcepoint (US), Trend Micro Incorporated (Japan), Comodo Group (US), McAfee LLC (US), Thoma Bravo (US), Netskope (US), A10 Networks (US), Cyren (US), Sangfor Technologies (China), Cato Networks (Israel), Content Keeper (Australia), iboss (US), Menlo Security (US), F5 Networks (US), and Citrix Systems (US). |
This research report categorizes the Secure Web Gateway market to forecast revenues and analyze trends in each of the following subsegments:
Based on Components:
- Solutions
- Services
Based on Solutions:
- Threat Protection
- Access Control
- Data Protection
Based on Deployment Modes:
- Cloud
- On-premises
Based on Organization Size:
- Small and Medium-sized Enterprises (SMEs)
- Large Enterprises
Based on Verticals:
- Banking, Financial Services, and Insurance (BFSI)
- Government and Defense
- Healthcare
- IT and Telecom
- Education
- Others (energy and utilities, manufacturing, travel and hospitality, transportation and logistics, and media and entertainment)
Based on Regions:
- North America
- US
- Canada
- Europe
- UK
- Germany
- France
- Rest of Europe
- APAC
- China
- India
- Japan
- Rest of APAC
- MEA
- Middle East
- Africa
- Latin America
- Brazil
- Mexico
- Rest of Latin America
Recent Developments
- In October 2019, Cisco acquired a customer experience management company, CloudCherry, which provides predictive analytics. This acquisition would enable enterprises to transform their contact centers from delivering reactive care to providing predictive support.
- In September 2019, Zscaler announced a partnership with CrowdStrike to offer real-time threat detection. This partnership would integrate Zscaler�s cloud security platform with CrowdStrike�s AI-powered Threat Graph to provide enterprises with real-time threat detection and automated policy enforcement.
- In February 2019, Symantec acquired Luminate Security, a software-defined perimeter and zero trust innovator. The acquisition enabled Symantec to extend its portfolio in Integrated Cyber Defense (ICD).
- In June 2019, Sophos announced the acquisition of Rook Security, a key vendor of Managed Detection and Response (MDR) services.
- In May 2019, Check Point Software Technologies partnered with Singapore Polytechnic to improve the skills of cybersecurity in Singapore.
- In August 2017, Forcepoint acquired RedOwl to strengthen its human-centric security position.
Key Questions Addressed by the Report
- What are the opportunities in the Secure Web Gateway market?
- What is the competitive landscape of the SWG market?
- What are the data regulations that will impact the SWG market?
- How has SWG evolved from traditional security solutions?
- What are the dynamics of the SWG market?
To speak to our analyst for a discussion on the above findings, click Speak to Analyst
Table of Contents
1 Introduction (Page No. - 19)
1.1 Objectives of the Study
1.2 Market Definition
1.2.1 Inclusions and Exclusions
1.3 Market Scope
1.3.1 Market Segmentation
1.3.2 Regions Covered
1.3.3 Years Considered for the Study
1.4 Currency Considered
1.5 Stakeholders
2 Research Methodology (Page No. - 23)
2.1 Research Data
2.1.1 Secondary Data
2.1.1.1 Vendor Selection and Evaluation
2.1.1.2 Geographic Analysis
2.1.1.3 Analysis of Industry Trends
2.1.2 Primary Data
2.1.2.1 Key Industry Insights
2.2 Data Triangulation
2.3 Market Size Estimation
2.3.1 Revenue Estimates
2.3.2 Bottom-Up Approach
2.3.3 Top-Down Approach
2.4 Market Forecast
2.5 Assumptions for the Study
3 Executive Summary (Page No. - 32)
4 Premium Insights (Page No. - 36)
4.1 Attractive Opportunities in the Secure Web Gateway Market
4.2 Market By Component, 2019� 2024
4.3 Market By Organization Size, 2019� 2024
4.4 Market By Deployment Mode, 2019� 2024
4.5 Market By Vertical, 2019� 2024
4.6 Market By Region and Vertical, 2019�2024
5 Market Overview and Industry Trends (Page No. - 39)
5.1 Introduction
5.2 Market Dynamics
5.2.1 Drivers
5.2.1.1 Increasing Need for End-To-End Wholistic Security Products
5.2.1.2 Rising Number of Sophisticated Cyber Attacks
5.2.2 Restraints
5.2.2.1 Low Acceptance of SWG Solutions in the Enterprise Segment
5.2.3 Opportunities
5.2.3.1 High Need for Protection From Web-Based Threats
5.2.3.2 Rise in Adoption of Cloud-Based Security Technologies
5.2.4 Challenges
5.2.4.1 Availability of Simpler and Alternate Products
5.3 Use Cases
5.3.1 Prepaid Payment Card Company Trusts Forcepoint to Safeguard Customer Data
5.3.2 Cenitex Provides Better User Experience and Improved Customer Security With Zscaler
5.3.3 Yelp Enhanced Customer Experience With Automated Security Practices and Cisco Umbrella and Investigate
6 Secure Web Gateway Market By Component (Page No. - 43)
6.1 Introduction
6.2 Solutions
6.2.1 Solutions: Market Drivers
6.3 Services
6.3.1 Services: Market Drivers
7 Secure Web Gateway Market, By Solution (Page No. - 47)
7.1 Introduction
7.2 Threat Prevention
7.2.1 Threat Prevention: Market Drivers
7.3 Access Control
7.3.1 Access Control: Market Drivers
7.4 Data Protection
7.4.1 Data Protection: Market Drivers
8 Secure Web Gateway Market, By Organization Size (Page No. - 52)
8.1 Introduction
8.2 Small and Medium-Sized Enterprises
8.2.1 Small and Medium-Sized Enterprises: Market Drivers
8.3 Large Enterprises
8.3.1 Large Enterprises: Market Drivers
9 Secure Web Gateway Market, By Deployment Mode (Page No. - 56)
9.1 Introduction
9.2 On-Premises
9.2.1 On Premises: Market Drivers
9.3 Cloud
9.3.1 Cloud: Market Drivers
10 Secure Web Gateway Market, By Vertical (Page No. - 60)
10.1 Introduction
10.2 Banking, Financial Services, and Insurance
10.2.1 Banking, Financial Services, and Insurance: Market Drivers
10.3 Government and Defense
10.3.1 Government and Defense: Market Drivers
10.4 Healthcare
10.4.1 Healthcare: Market Drivers
10.5 IT and Telecom
10.5.1 IT and Telecom: Market Drivers
10.6 Education
10.6.1 Education: Market Drivers
10.7 Others
11 Secure Web Gateway Market, By Region (Page No. - 68)
11.1 Introduction
11.2 North America
11.2.1 North America: Market Drivers
11.2.2 United States
11.2.3 Canada
11.3 Europe
11.3.1 Europe: Market Drivers
11.3.2 United Kingdom
11.3.3 Germany
11.3.4 France
11.3.5 Rest of Europe
11.4 Asia Pacific
11.4.1 Asia Pacific: Market Drivers
11.4.2 China
11.4.3 Japan
11.4.4 India
11.4.5 Rest of Asia Pacific
11.5 Middle East and Africa
11.5.1 Middle East and Africa: Market Drivers
11.5.2 Middle East
11.5.3 Africa
11.6 Latin America
11.6.1 Latin America: Market Drivers
11.6.2 Brazil
11.6.3 Mexico
11.6.4 Rest of Latin America
12 Competitive Landscape (Page No. - 118)
12.1 Microquadrant Overview
12.2 Competitive Leadership Mapping
12.2.1 Visionary Leaders
12.2.2 Innovators
12.2.3 Dynamic Differentiators
12.2.4 Emerging Companies
13 Company Profiles (Page No. - 120)
13.1 Introduction
13.2 NortonLifeLock Inc. (Symantec)
(Business Overview, Products Offered, Recent Developments, Organic Growth Strategies, and Inorganic Growth Strategies, and SWOT Analysis)*
13.3 Zscaler
13.4 Cisco Systems
13.5 Check Point Software Technologies
13.6 Sophos
13.7 Forcepoint
13.8 Trend Micro
13.9 Comodo
13.10 McAfee
13.11 Thoma Bravo (Barracuda Networks)
13.12 NetSkope
13.13 A10 Networks
13.14 Cyren
13.15 Sangfor Technologies
13.16 CATO Networks
13.17 Contentkeeper
13.18 iboss
13.19 Menlo Security
13.20 F5 Networks, Inc.
13.21 Citrix
*Details on Business Overview, Products Offered, Recent Developments, Organic Growth Strategies, and Inorganic Growth Strategies, and SWOT Analysis Might Not be Captured in Case of Unlisted Companies.
13.22 Right to Win
14 Appendix (Page No. - 153)
14.1 Discussion Guide
14.2 Knowledge Store: Marketsandmarkets� Subscription Portal
14.3 Available Customizations
14.4 Related Reports
14.5 Author Details
List of Tables (128 Tables)
Table 1 Secure Web Gateway Market Ecosystem: Vendor Selection and Evaluation Criteria
Table 2 Revenue and Share Estimates for Selected Vendors in Secure Web Gateway Market
Table 3 Market Size and Growth Rate, 2017�2024 (USD Million, Y-O-Y %)
Table 4 Market Size By Component, 2017�2024 (USD Million)
Table 5 Solutions: Market Size By Region, 2017�2024 (USD Million)
Table 6 Services: Market Size By Region, 2017�2024 (USD Million)
Table 7 Secure Web Gateway Market Size, By Solution, 2017�2024 (USD Million)
Table 8 Threat Prevention: Market Size By Region, 2017�2024 (USD Million)
Table 9 Access Control: Market Size By Region, 2017�2024 (USD Million)
Table 10 Data Protection: Market Size By Region, 2017�2024 (USD Million)
Table 11 Secure Web Gateway Market Size, By Organization Size, 2017�2024 (USD Million)
Table 12 Small and Medium-Sized Enterprises: Market Size By Region, 2017�2024 (USD Million)
Table 13 Large Enterprises: Market Size By Region, 2017�2024 (USD Million)
Table 14 Secure Web Gateway Market Size, By Deployment Mode, 2017�2024 (USD Million)
Table 15 On Premises: Market Size By Region, 2017�2024 (USD Million)
Table 16 Cloud: Market Size By Region, 2017�2024 (USD Million)
Table 17 Secure Web Gateway Market Size, By Vertical, 2017�2024 (USD Million)
Table 18 Banking, Financial Services, and Insurance: Market Size By Region, 2017�2024 (USD Million)
Table 19 Government and Defense: Market Size By Region, 2017�2024 (USD Million)
Table 20 Healthcare: Market Size By Region, 2017�2024 (USD Million)
Table 21 IT and Telecom: Market Size By Region, 2017�2024 (USD Million)
Table 22 Education: Market Size By Region, 2017�2024 (USD Million)
Table 23 Others: Market Size By Region, 2017�2024 (USD Million)
Table 24 Secure Web Gateway Market Size, By Region, 2017�2024 (USD Million)
Table 25 North America: Secure Web Gateway Market Size, By Component, 2017�2024 (USD Million)
Table 26 North America: Market Size By Solution, 2017�2024 (USD Million)
Table 27 North America: Market Size By Deployment Mode, 2017�2024 (USD Million)
Table 28 North America: Market Size By Organization Size, 2017�2024 (USD Million)
Table 29 North America: Market Size By Vertical, 2017�2024 (USD Million)
Table 30 North America: Market Size By Country, 2017�2024 (USD Million)
Table 31 United States: Secure Web Gateway Market Size, By Component, 2017�2024 (USD Million)
Table 32 United States: Market Size By Solution, 2017�2024 (USD Million)
Table 33 United States: Market Size By Deployment Mode, 2017�2024 (USD Million)
Table 34 United States: Market Size By Organization Size, 2017�2024 (USD Million)
Table 35 United States: Market Size By Vertical, 2017�2024 (USD Million)
Table 36 Canada: Secure Web Gateway Market Size, By Component, 2017�2024 (USD Million)
Table 37 Canada: Market Size By Solution, 2017�2024 (USD Million)
Table 38 Canada: Market Size By Deployment Mode, 2017�2024 (USD Million)
Table 39 Canada: Market Size By Organization Size, 2017�2024 (USD Million)
Table 40 Canada: Market Size By Vertical, 2017�2024 (USD Million)
Table 41 Europe: Market Size By Component, 2017�2024 (USD Million)
Table 42 Europe: Market Size By Solution, 2017�2024 (USD Million)
Table 43 Europe: Market Size By Deployment Mode, 2017�2024 (USD Million)
Table 44 Europe: Market Size By Organization Size, 2017�2024 (USD Million)
Table 45 Europe: Market Size By Vertical, 2017�2024 (USD Million)
Table 46 Europe: Market Size By Country, 2017�2024 (USD Million)
Table 47 United Kingdom: Secure Web Gateway Market Size, By Component, 2017�2024 (USD Million)
Table 48 United Kingdom: Market Size By Solution, 2017�2024 (USD Million)
Table 49 United Kingdom: Market Size By Deployment Mode, 2017�2024 (USD Million)
Table 50 United Kingdom: Market Size By Organization Size, 2017�2024 (USD Million)
Table 51 United Kingdom: Market Size By Vertical, 2017�2024 (USD Million)
Table 52 Germany: Secure Web Gateway Market Size, By Component, 2017�2024 (USD Million)
Table 53 Germany: Market Size By Solution, 2017�2024 (USD Million)
Table 54 Germany: Market Size By Deployment Mode, 2017�2024 (USD Million)
Table 55 Germany: Market Size By Organization Size, 2017�2024 (USD Million)
Table 56 Germany: Market Size By Vertical, 2017�2024 (USD Million)
Table 57 France: Secure Web Gateway Market Size, By Component, 2017�2024 (USD Million)
Table 58 France: Market Size By Solution, 2017�2024 (USD Million)
Table 59 France: Market Size By Deployment Mode, 2017�2024 (USD Million)
Table 60 France: Market Size By Organization Size, 2017�2024 (USD Million)
Table 61 France: Market Size By Vertical, 2017�2024 (USD Million)
Table 62 Rest of Europe: Secure Web Gateway Market Size, By Component, 2017�2024 (USD Million)
Table 63 Rest of Europe: Market Size By Solution, 2017�2024 (USD Million)
Table 64 Rest of Europe: Market Size By Deployment Mode, 2017�2024 (USD Million)
Table 65 Rest of Europe: Market Size By Organization Size, 2017�2024 (USD Million)
Table 66 Rest of Europe: Market Size By Vertical, 2017�2024 (USD Million)
Table 67 Asia Pacific: Secure Web Gateway Market Size, By Component, 2017�2024 (USD Million)
Table 68 Asia Pacific: Market Size By Solution, 2017�2024 (USD Million)
Table 69 Asia Pacific: Market Size By Deployment Mode, 2017�2024 (USD Million)
Table 70 Asia Pacific: Market Size By Organization Size, 2017�2024 (USD Million)
Table 71 Asia Pacific: Market Size By Vertical, 2017�2024 (USD Million)
Table 72 Asia Pacific: Market Size By Country, 2017�2024 (USD Million)
Table 73 China: Secure Web Gateway Market Size, By Component, 2017�2024 (USD Million)
Table 74 China: Market Size By Solution, 2017�2024 (USD Million)
Table 75 China: Market Size By Deployment Mode, 2017�2024 (USD Million)
Table 76 China: Market Size By Organization Size, 2017�2024 (USD Million)
Table 77 China: Market Size By Vertical, 2017�2024 (USD Million)
Table 78 Japan: Market Size By Component, 2017�2024 (USD Million)
Table 79 Japan: Market Size By Solution, 2017�2024 (USD Million)
Table 80 Japan: Market Size By Deployment Mode, 2017�2024 (USD Million)
Table 81 Japan: Market Size By Organization Size, 2017�2024 (USD Million)
Table 82 Japan: Market Size By Vertical, 2017�2024 (USD Million)
Table 83 India: Secure Web Gateway Market Size, By Component, 2017�2024 (USD Million)
Table 84 India: Market Size By Solution, 2017�2024 (USD Million)
Table 85 India: Market Size By Deployment Mode, 2017�2024 (USD Million)
Table 86 India: Market Size By Organization Size, 2017�2024 (USD Million)
Table 87 India: Market Size By Vertical, 2017�2024 (USD Million)
Table 88 Rest of Asia Pacific: Secure Web Gateway Market Size, By Component, 2017�2024 (USD Million)
Table 89 Rest of Asia Pacific: Market Size By Solution, 2017�2024 (USD Million)
Table 90 Rest of Asia Pacific: Market Size By Deployment Mode, 2017�2024 (USD Million)
Table 91 Rest of Asia Pacific: Market Size By Organization Size, 2017�2024 (USD Million)
Table 92 Rest of Asia Pacific: Market Size By Vertical, 2017�2024 (USD Million)
Table 93 Middle East and Africa: Secure Web Gateway Market Size, By Component, 2017�2024 (USD Million)
Table 94 Middle East and Africa: Market Size By Solution, 2017�2024 (USD Million)
Table 95 Middle East and Africa: Market Size By Deployment Mode, 2017�2024 (USD Million)
Table 96 Middle East and Africa: Market Size By Organization Size, 2017�2024 (USD Million)
Table 97 Middle East and Africa: Market Size By Vertical, 2017�2024 (USD Million)
Table 98 Middle East: Secure Web Gateway Market Size, By Component, 2017�2024 (USD Million)
Table 99 Middle East: Market Size By Solution, 2017�2024 (USD Million)
Table 100 Middle East: Market Size By Deployment Mode, 2017�2024 (USD Million)
Table 101 Middle East: Market Size By Organization Size, 2017�2024 (USD Million)
Table 102 Middle East: Market Size, By Vertical, 2017�2024 (USD Million)
Table 103 Africa: Secure Web Gateway Market Size, By Component, 2017�2024 (USD Million)
Table 104 Africa: Market Size By Solution, 2017�2024 (USD Million)
Table 105 Africa: Market Size By Deployment Mode, 2017�2024 (USD Million)
Table 106 Africa: Market Size By Organization Size, 2017�2024 (USD Million)
Table 107 Africa: Market Size By Vertical, 2017�2024 (USD Million)
Table 108 Latin America: Secure Web Gateway Market Size, By Component, 2017�2024 (USD Million)
Table 109 Latin America: Market Size By Solution, 2017�2024 (USD Million)
Table 110 Latin America: Market Size By Deployment Mode, 2017�2024 (USD Million)
Table 111 Latin America: Market Size By Organization Size, 2017�2024 (USD Million)
Table 112 Latin America: Market Size By Vertical, 2017�2024 (USD Million)
Table 113 Latin America: Market Size By Country, 2017�2024 (USD Million)
Table 114 Brazil: Secure Web Gateway Market Size, By Component, 2017�2024 (USD Million)
Table 115 Brazil: Market Size By Solution, 2017�2024 (USD Million)
Table 116 Brazil: Market Size By Deployment Mode, 2017�2024 (USD Million)
Table 117 Brazil: Market Size By Organization Size, 2017�2024 (USD Million)
Table 118 Brazil: Market Size By Vertical, 2017�2024 (USD Million)
Table 119 Mexico: Secure Web Gateway Market Size, By Component, 2017�2024 (USD Million)
Table 120 Mexico: Market Size By Solution, 2017�2024 (USD Million)
Table 121 Mexico: Market Size By Deployment Mode, 2017�2024 (USD Million)
Table 122 Mexico: Market Size By Organization Size, 2017�2024 (USD Million)
Table 123 Mexico: Market Size By Vertical, 2017�2024 (USD Million)
Table 124 Rest of Latin America: Secure Web Gateway Market Size, By Component, 2017�2024 (USD Million)
Table 125 Rest of Latin America: Market Size By Solution, 2017�2024 (USD Million)
Table 126 Rest of Latin America: Market Size By Deployment Mode, 2017�2024 (USD Million)
Table 127 Rest of Latin America: Market Size By Organization Size, 2017�2024 (USD Million)
Table 128 Rest of Latin America: Market Size By Vertical, 2017�2024 (USD Million)
List of Figures (34 Figures)
Figure 1 Global Secure Web Gateway Market: Research Design
Figure 2 Sample Secondary Data: Analysis of Key Countries
Figure 3 Sample Secondary Data: Europe
Figure 4 Sample Secondary Data: Attack Distribution, By Type
Figure 5 Market Size Estimation Methodology: Approach 1
Figure 6 Market Size Estimation Methodology: Approach 2
Figure 7 Factor Analysis for Market Trend and Forecast
Figure 8 Services Segment to Witness a Higher Growth Rate During the Forecast Period
Figure 9 North America to Account for the Highest Market Share in 2019
Figure 10 Fastest-Growing Segments of the Secure Web Gateway Market
Figure 11 Increase in use of Secure Web Gateways By Organizations to Boost Market Growth
Figure 12 Solutions Segment to Hold a Higher Market Share in 2019
Figure 13 Small and Medium-Sized Enterprises Segment to Hold a Larger Market Size During the Forecast Period
Figure 14 On-Premises Segment to Hold a Higher Market Share During the Forecast Period
Figure 15 Banking, Financial Services, and Insurance Vertical to Hold the Largest Market Size During the Forecast Period
Figure 16 North America and Banking, Financial Services, and Insurance Segment to Hold the Highest Market Shares During the Forecast Period
Figure 17 Drivers, Restraints, Opportunities, and Challenges: Secure Web Gateway Market
Figure 18 Solutions Segment to Hold a Larger Market Size During the Forecast Period
Figure 19 Data Protection Segment to Grow at the Highest CAGR During the Forecast Period
Figure 20 Large Enterprises Segment to Dominate the Market During the Forecast Period
Figure 21 On-Premises Segment to Dominate the Market During the Forecast Period
Figure 22 Banking, Financial Services, and Insurance Vertical to Dominate the Market During the Forecast Period
Figure 23 Asia Pacific to Grow at the Highest CAGR During the Forecast Period
Figure 24 North America: Market Snapshot
Figure 25 Asia Pacific: Market Snapshot
Figure 26 Secure Web Gateway Market (Global), Competitive Leadership Mapping, 2019
Figure 27 Symantec: Company Snapshot
Figure 28 Symantec: SWOT Analysis
Figure 29 Zscaler: Company Snapshot
Figure 30 Zscaler: SWOT Analysis
Figure 31 Cisco: Company Snapshot
Figure 32 Cisco Systems: SWOT Analysis
Figure 33 Check Point Software Technologies: Company Snapshot
Figure 34 Sophos: Company Snapshot
The study involved four major activities to estimate the current size of the Secure Web Gateway (SWG) market. Exhaustive secondary research was done to collect information on the SWG market. The next step was to validate these findings, assumptions, and sizing with industry experts across the value chain using primary research. Both top-down and bottom-up approaches were employed to estimate the complete market size. Thereafter, market breakup and data triangulation procedures were used to estimate the size of the segments and subsegments of the market.
Secondary Research
In the secondary research process, various secondary sources, such as Hoovers, Bloomberg BusinessWeek, and Dun & Bradstreet, have been referred to identify and collect the information for this study. These secondary sources included annual reports, press releases, and investor presentations of companies; whitepapers, certified publications, and articles by recognized authors; gold standard and silver standard websites; regulatory bodies; trade directories; and databases.
Primary Research
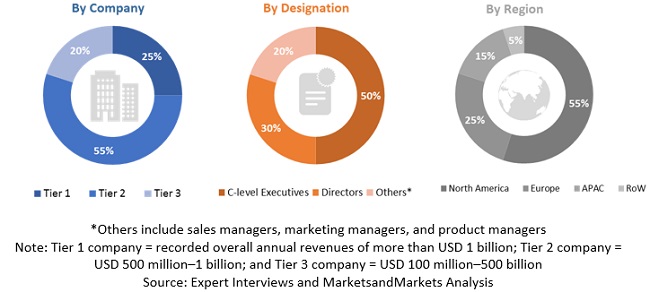
The SWG market comprises several stakeholders, such as service providers, solution vendors, system integrators, technology partners, consulting firms, research organizations, managed service providers, government agencies, financial bodies, resellers and distributors, enterprise users, and technology providers. The demand side of the market consists of financial institutions, investors, and insurance companies. The supply side includes SWG solution providers. Various primary sources from both the supply and demand sides of the market were interviewed to obtain qualitative and quantitative information. Following is the breakup of the primary respondents:
To know about the assumptions considered for the study, download the pdf brochure
Secure Web Gateway Market Size Estimation
Both top-down and bottom-up approaches were used to estimate and validate the total size of the SWG market. These methods were also used extensively to estimate the size of various segments in the market. The research methodology used to estimate the market size includes the following:
- Key players in the market have been identified through extensive secondary research.
- The industry�s supply chain and market size, in terms of value, have been determined through primary and secondary research processes.
- All percentage shares, splits, and breakups have been determined using secondary sources and verified through primary sources.
Data Triangulation
After arriving at the overall market size using the market size estimation processes as explained above, the market was split into several segments and subsegments. To complete the overall market engineering process and arrive at the exact statistics of each market segment and subsegment, data triangulation and market breakup procedures were employed, wherever applicable. The data was triangulated by studying various factors and trends from both demand and supply sides.
Report Objectives
- To determine and forecast the global SWG market by component, solution, deployment mode, organization size, vertical, and region from 2019 to 2024, and analyze the various macroeconomic and microeconomic factors that affect the market growth
- To forecast the size of the market segments with respect to five main regions: North America, Europe, Asia Pacific (APAC), Middle East and Africa (MEA), and Latin America
- To analyze each submarket with respect to individual growth trends, prospects, and contributions to the overall SWG market
- To provide detailed information about the major factors (drivers, restraints, opportunities, and challenges) influencing the growth of the SWG market.
Available Customizations
With the given market data, MarketsandMarkets offers customizations as per the company�s specific needs. The following customization options are available for the report:
Geographic Analysis
- Further breakup of rest of Europe countries include Nordic countries and Benelux
- Further breakup of rest of APAC countries include South Korea, Australia, and Singapore
- Further breakup of rest of Latin America countries include Argentina, Colombia, and Chile
Company Information
- Detailed analysis and profiling of additional market players (up to 5)


Growth opportunities and latent adjacency in Secure Web Gateway Market
How Secure Web Gateway (SWG) help to control the increased cyber attacks?