Semi-Automatic and Manual Filling Equipment Market by Type (Semi-Automatic Filling Equipment, Manual Filling Equipment), Application (Chemical, Health & Pharmaceutical, Food & Beverage, Personal Care, Paint & Coating, Others), and Region - Global Forecast to 2020


[125 Pages Report] The global semi-automatic filling equipment and manual filling equipment market was valued at USD 3.39 Billion in 2014 and is projected to reach USD 4.52 Billion by 2020, at a CAGR of 4.9% between 2015 and 2020. Filling equipment is critical for all filling lines. Based on type, the filling equipment market is classified into semi-automatic filling equipment and manual filling equipment. The semi-automatic filling equipment segment held the largest share in 2014. Increasing demand of varied filling applications and techniques, such as adding multiple heads and conveyors to the machine, drives the overall demand of semi-automatic filling equipment. Similarly, based on application, the filling equipment market is segmented into chemical, health & pharmaceutical, food & beverage, personal care, and others (including petroleum, automotive, and industrial & agricultural). 2014 is considered as a base year for the study, and 2015 to 2020 is considered as the forecast period.
The research methodology used to estimate and forecast the global semi-automatic filling equipment and manual filling equipment market begins with capturing data on key vendor revenues through secondary research. The vendor offerings are also taken into consideration to determine the market segmentation. After arriving at the overall market size, the total market was split into several segments and subsegments, which were later verified through primary research by conducting extensive interviews with key personnel, such as CEOs, VPs, directors, and executives. This data triangulation and market breakdown procedures were employed to complete the overall market engineering process and arrive at the exact statistics for all segments and subsegments of the market. The breakdown of profiles of primaries is depicted in the figure below.
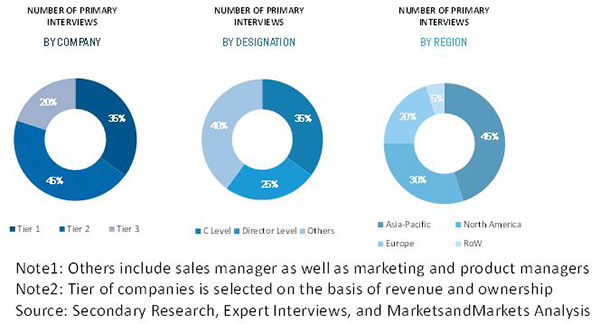
To know about the assumptions considered for the study, download the pdf brochure
The global semi-automatic filling equipment and manual filling equipment market has a diversified ecosystem of upstream players, including raw material suppliers, along with downstream stakeholders, vendors, end users, and government organizations.
Nordson Corp., (U.S.), COESIA Group (Italy), GEA Group AG (U.S.), Fisnar Inc. (U.S.), Accutek Packaging Equipment Companies Inc. (U.S.), and Graco Inc. (U.S.), among others are the key players operating in the global semi-automatic filling equipment and manual filling equipment market. The government and research organizations, raw material suppliers and distributors, construction companies, and industry associations are considered as critical stakeholders in this study.
The report provides detailed qualitative and quantitative analysis of the global semi-automatic filling equipment and manual filling equipment market, along with market drivers, restraints, opportunities, and challenges. The top players of this market are profiled in detail, along with recent developments and other strategic industry-related activities.
Target Audience
- Filling Equipment Producers
- Filling Equipment Traders, Distributors, and Suppliers
- Manufacturers in End-User Industries
- Associations and Industry Bodies
�This study answers several questions for the stakeholders, primarily which market segments to focus in the next two to five years for prioritizing the efforts and investments�.
Get online access to the report on the World's First Market Intelligence Cloud
Request Sample Scope of the Report
: This research report categorizes the global semi-automatic filling equipment and manual filling equipment market on the basis of type, application, and region. It forecasts value as well as analyzes trends in each of these submarkets.

On the basis of Type:
- Semi-automatic filling equipment Filling Equipment
- Manual Filling Equipment
On the basis of Application:
- Chemical
- Health & Pharmaceutical
- Food & Beverage
- Personal Care
- Others
On the basis of Region:
- Asia-Pacific
- North America
- Europe
The following customization options are available for the report:
With the given market data, MarketsandMarkets offers customizations as per the company�s specific needs. The following customization options are available for the report:
Product Analysis
- Product Matrix which gives a detailed comparison of product portfolio of each company
Geographic Analysis
- Further breakdown of rest of APAC and rest of Europe semi-automatic filling equipment and manual filling equipment market
Company Information
- Detailed analysis and profiling of additional market players (Upto 5 companies).
The global semi-automatic filling equipment and manual filling equipment market is projected to reach USD 4.52 Billion by 2020, at a CAGR of 4.9% between 2015 and 2020. Technological developments, small pack size, changing consumer lifestyles, and automation in filling equipment are major factors influencing the growth of this market.
Among all applications, the food & beverages segment led the global semi-automatic filling equipment and manual filling equipment market in 2014. Filling equipment improves efficiency of varied manufacturing processes by filling a wide range of containers with different sizes at minimum time. This further increases the demand of filling equipment in the food & beverage industry. Among types, the semi-automatic filling equipment segment of the global semi-automatic filling equipment and manual filling equipment market is projected to grow at the highest CAGR during the forecast period. Rapid industrialization and innovative manufacturing procedures drive the overall demand for semi-automatic filling equipment.
The semi-automatic filling equipment segment led the global semi-automatic filling equipment and manual filling equipment market in 2014. Manual filling equipment segment accounted for the second-largest share of the global semi-automatic filling equipment and manual filling equipment market. The demand for manual filling equipment will continue to decline, as an increasing number of filling equipment suppliers and manufacturers have proactively shifted their focus towards the procurement of semi-automatic filling equipment.
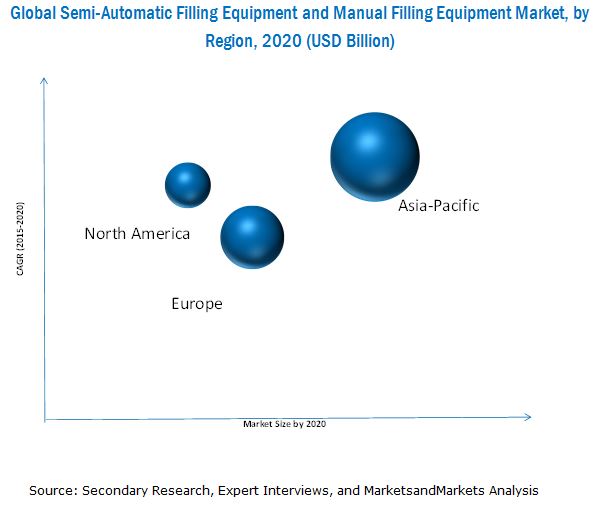
Asia-Pacific serves to be a lucrative market for semi-automatic filling equipment and manual filling equipment. It accounted for the largest share of the global semi-automatic filling equipment and manual filling equipment market. The Asia-Pacific region is expected to lead this market in the next five years. This growth is mainly attributed to the growing affluence of the middle class population in this region, coupled with rapid urbanization that has further led to rise in consumerism opportunities, which ultimately drives the semi-automatic filling equipment and manual filling equipment market in this country.
High costs are associated with the maintenance of filling equipment. Maintenance activities such as regular greasing and servicing have resulted in rise in expenditure. Shutdowns may occur in semi-automatic filling equipment due to technical reasons, thereby acting as a restraint for the filling equipment market. Nordson Corp., (U.S.), COESIA Group (Italy), GEA Group AG (U.S.), Fisnar Inc. (U.S.), Accutek Packaging Equipment Companies Inc. (U.S.), and Graco Inc. (U.S.), among others are key players operating in the global semi-automatic filling equipment and manual filling equipment market. Fisnar Inc. focuses on product innovation through the adoption of advanced technologies and effective research & development activities. The company has been undertaking these strategies in a bid to enhance its product portfolio and improve growth opportunities in emerging markets.
To speak to our analyst for a discussion on the above findings, click Speak to Analyst
Table of Contents
1 Introduction (Page No. - 12)
1.1 Objectives of the Study
1.2 Market Definition
1.3 Scope of the Study
1.3.1 Regional Scope
1.3.2 Markets Covered
1.3.3 Years Considered in the Study
1.4 Currency & Pricing
1.5 Stakeholders
2 Research Methodology (Page No. - 15)
2.1 Research Data
2.1.1 Secondary Data
2.1.1.1 Key Data From Secondary Sources
2.1.2 Primary Data
2.1.2.1 Key Data From Primary Sources
2.1.2.2 Key Industry Insights
2.1.2.3 Breakdown of Primary Interviews
2.2 Market Size Estimation
2.2.1 Bottom Up Approach
2.2.2 Top Down Approach
2.3 Market Breakdown & Data Triangulation
2.4 Market Share Estimation
2.5 Assumptions
2.6 Limitations
3 Executive Summary (Page No. - 25)
4 Premium Insights (Page No. - 29)
4.1 Attractive Opportunities in the Filling Equipment Market
4.2 Filling Equipment Market - Major Types
4.3 Filling Equipment Market in Asia-Pacific
4.4 Filling Equipment Market- Key Countries Contributing to the Future Market Growth
4.5 Filling Equipment Market, By Application
4.6 Life Cycle Analysis, By Region
5 Market Overview (Page No. - 35)
5.1 Introduction
5.1.1 Drivers
5.1.1.1 Development of New Filling Technology
5.1.1.2 Growing Demand of Filling Equipment From the Chemical and Health & Pharmaceutical Sectors
5.1.1.3 Time-Saving Operations and Reduction of Errors
5.1.2 Restraints
5.1.2.1 High Maintenance Costs for Filling Equipments
5.1.2.2 High Prices of Filling Equipment Systems
5.1.3 Opportunities
5.1.3.1 Filling Equipment Services
5.1.3.2 Government Funds for Smes
5.1.4 Challenges
5.1.4.1 Preference Towards Used Or Refurbished Filling Equipment
5.1.4.2 Price Volatility of Raw Materials
6 Industry Trends (Page No. - 40)
6.1 Introduction
6.2 Value Chain Analysis
6.3 Porter�s Five Forces Analysis
6.3.1 Threat of New Entrants
6.3.2 Threat of Substitutes
6.3.3 Bargaining Power of Suppliers
6.3.4 Bargaining Power of Buyers
6.3.5 Intensity of Competitive Rivalry
7 Filling Equipment Market, By Type (Page No. - 45)
7.1 Introduction
7.2 Semi-Automatic Filling Equipment
7.3 Manual Filling Equipment
8 Filling Equipment Market, By Application (Page No. - 49)
8.1 Introduction
8.2 Food & Beverage
8.3 Health & Pharmaceutical
8.4 Chemical
8.5 Personal Care
8.6 Paint & Coating
8.7 Others
9 Filling Equipment Market, By Region (Page No. - 57)
9.1 Introduction
9.2 Asia-Pacific
9.2.1 China
9.2.2 Japan
9.2.3 India
9.2.4 Rest of Asia-Pacific
9.3 Europe
9.3.1 Germany
9.3.2 Italy
9.3.3 France
9.3.4 Spain
9.3.5 Rest of Europe
9.4 North America
9.4.1 U.S.
9.4.2 Canada
9.4.3 Mexico
10 Competitive Landscape (Page No. - 81)
10.1 Overview
10.2 New Product/Technology Launches
10.3 Agreements/Contracts/Partnerships
10.4 Mergers & Acquisitions
10.5 Expansions
11 Company Profiles (Page No. - 87)
(Company at A Glance, Recent Financials, Products & Services, Strategies & Insights, & Recent Developments)*
11.1 Introduction
11.2 D�rr AG
11.3 Fisnar Inc.
11.4 Nordson Corporation
11.5 Graco Inc.
11.6 Accutek Packaging Equipment Companies, Inc.
11.7 Coesia Group
11.8 GEA Group AG
11.9 JBT Corporation
11.10 Tridak LLC
*Details on Company at A Glance, Recent Financials, Products & Services, Strategies & Insights, & Recent Developments Might Not Be Captured in Case of Unlisted Companies.
12 Appendix (Page No. - 119)
12.1 Discussion Guide
12.2 Knowledge Store: Marketsandmarkets� Subscription Portal
12.3 Introducing RT: Real-Time Market Intelligence
12.4 Available Customizations
12.5 Related Reports
List of Tables (49 Tables)
Table 1 Asia-Pacific Filling Equipment Market Projected to Grow at the Highest CAGR During the Forecast Period
Table 2 Filling Equipment Market, By Type, 2013�2020 (USD Billion)
Table 3 Semi-Automatic Filling Equipment Market, By Region, 2013�2020 (USD Million)
Table 4 Manual Filling Equipment Market, By Region, 2013�2020 (USD Million)
Table 5 Filling Equipment Market, By Application, 2013�2020 (USD Million)
Table 6 Filling Equipment Market in Food & Beverage Application, By Region, 2013�2020 (USD Million)
Table 7 Filling Equipment Market in Health & Pharmaceutical Application, By Region, 2013�2020 (USD Million)
Table 8 Filling Equipment Market in Chemical Application, By Region, 2013�2020 (USD Million)
Table 9 Filling Equipment Market in Personal Care Application, By Region, 2013�2020 (USD Million)
Table 10 Filling Equipment Market in Paint & Coating Application, By Region, 2013�2020 (USD Million)
Table 11 Filling Equipment Market in Others Application, By Region, 2013�2020 (USD Million)
Table 12 Filling Equipment Market, By Region, 2013�2020 (USD Million)
Table 13 Asia-Pacific Filling Equipment Market, By Type, 2013�2020 (USD Million)
Table 14 Asia-Pacific Filling Equipment Market, By Country, 2013�2020 (USD Million)
Table 15 Asia-Pacific Filling Equipment Market, By Application, 2013�2020 (USD Million)
Table 16 China Filling Equipment Market, By Type, 2013�2020 (USD Million)
Table 17 China Filling Equipment Market, By Application, 2013�2020 (USD Million)
Table 18 Japan Filling Equipment Market, By Type, 2013�2020 (USD Million)
Table 19 Japan Filling Equipment Market, By Application, 2013�2020 (USD Million)
Table 20 India Filling Equipment Market, By Type, 2013�2020 (USD Million)
Table 21 India Filling Equipment Market, By Application, 2013�2020 (USD Million)
Table 22 Rest of Asia-Pacific Filling Equipment Market, By Type, 2013�2020 (USD Million)
Table 23 Rest of Asia-Pacific Filling Equipment Market, By Application, 2013�2020 (USD Million)
Table 24 Europe Filling Equipment Market, By Type, 2013�2020 (USD Million)
Table 25 Europe Filling Equipment Market, By Country, 2013�2020 (USD Million)
Table 26 Europe Filling Equipment Market, By Application, 2013�2020 (USD Million)
Table 27 Germany Filling Equipment Market, By Type, 2013�2020 (USD Million)
Table 28 Germany Filling Equipment Market, By Application, 2013�2020 (USD Million)
Table 29 Italy Filling Equipment Market, By Type, 2013�2020 (USD Million)
Table 30 Italy Filling Equipment Market, By Application, 2013�2020 (USD Million)
Table 31 France Filling Equipment Market, By Type, 2013�2020 (USD Million)
Table 32 France Filling Equipment Market, By Application, 2013�2020 (USD Million)
Table 33 Spain Filling Equipment Market, By Type, 2013�2020 (USD Million)
Table 34 Spain Filling Equipment Market, By Application, 2013�2020 (USD Million)
Table 35 Rest of Europe Filling Equipment Market, By Type, 2013�2020 (USD Million)
Table 36 Rest of Europe Filling Equipment Market, By Application, 2013�2020 (USD Million)
Table 37 North America Filling Equipment Market, By Type, 2013�2020 (USD Million)
Table 38 North America Filling Equipment Market, By Country, 2013�2020 (USD Million)
Table 39 North America Filling Equipment Market, By Application, 2013�2020 (USD Million)
Table 40 U.S. Filling Equipment Market, By Type, 2013�2020 (USD Million)
Table 41 U.S. Filling Equipment Market, By Application, 2013�2020 (USD Million)
Table 42 Canada Filling Equipment Market, By Type, 2013�2020 (USD Million)
Table 43 Canada Filling Equipment Market, By Application, 2013�2020 (USD Million)
Table 44 Mexico Filling Equipment Market, By Type, 2013�2020 (USD Million)
Table 45 Mexico Filling Equipment Market, By Application, 2013�2020 (USD Million)
Table 46 New Product/Technology Launches/Product Development, 2012�2015
Table 47 Agreements/Contracts/Partnerships, 2011�2015
Table 48 Mergers & Acquisitions, 2009�2015
Table 49 Expansions, 2010�2015
List of Figures (41 Figures)
Figure 1 Filling Equipment Market: Market Segmentation
Figure 2 Filling Equipment Market: Research Design
Figure 3 Bottom-Up Approach for Filling Equipment Market
Figure 4 Top-Down Approach for Filling Equipment Market
Figure 5 Filling Equipment Market: Data Triangulation
Figure 6 Semi-Automatic Filling Equipment Account for the Largst Share in the Filling Equipment Market in 2015
Figure 7 Food & Beverages Application Account for The Largest Share in Filling Eqipment Market in 2015
Figure 8 Asia-Pacific Accounted for the Largest Share of the Filling Equipment Market in 2014
Figure 9 Filling Equipment Market is Projected to Grow at A Highest CAGR Between 2015 and 2020
Figure 10 Semi-Automatic Filling Equipment to Register the Highest Growth Between 2015 and 2020
Figure 11 Food & Beverage Application Segment Accounted for the Largest Share in the Asia-Pacific Filling Equipment Market, 2015
Figure 12 China to Register the Highest Growth Rate Between 2015 and 2020
Figure 13 Chemical Application Segment Projected to Grow at the Highest CAGR Between 2015 and 2020
Figure 14 Asia-Pacific: Fastest-Growing Market Between 2015 and 2020
Figure 15 Drivers, Restraints, Opportunities & Challenges in the Filling Equipment Industry
Figure 16 Filling Equipment Industry: Value Chain Analysis
Figure 17 Porter�s Five Forces Analysis - 2014
Figure 18 Semi-Automatic Filling Equipment to Account for the Largest Market Size By 2020
Figure 19 The Food & Beverage Segment Dominates the Filling Equipment Market During the Forecast Period.
Figure 20 China Filling Equipment Market is Emerging as New Hotspot During the Forecast Period
Figure 21 Filling Equipment Market in Asia-Pacific and North America are Expected to Witness High Growth During the Forecast Period
Figure 22 Asia-Pacific Filling Equipment Market Snapshot
Figure 23 Europe Filling Equipment Market Snapshot
Figure 24 North America Filling Equipment Market Snapshot
Figure 25 Companies Adopted New Product/Technology Launches as the Key Growth Strategy Between 2009 and 2015
Figure 26 Battle for Market Share: New Product/Technology Launches Was the Key Strategy
Figure 27 Regional Revenue Mix of Top Market Players
Figure 28 D�rr AG: Company Snapshot
Figure 29 D�rr AG: SWOT Analysis
Figure 30 Fisnar Inc.: SWOT Analysis
Figure 31 Nordson Corporation: Company Snapshot
Figure 32 Nordson Corporation: SWOT Analysis
Figure 33 Graco Inc.: Company Snapshot
Figure 34 Graco Inc.: SWOT Analysis
Figure 35 Accutek Packaging Equipment Companies, Inc.: SWOT Analysis
Figure 36 Coesia Group: SWOT Analysis
Figure 37 GEA Group AG: Company Snapshot
Figure 38 GEA Group AG: SWOT Analysis
Figure 39 JBT Corporation: Company Snapshot
Figure 40 JBT Corporation: SWOT Analysis
Figure 41 Tridak LLC: SWOT Analysis


Growth opportunities and latent adjacency in Semi-Automatic and Manual Filling Equipment Market