Silicone Coating Market by Type (Additives, Polymers, 100% Silicone, Water Repellents Silicone, and Others), Technology, & by Application (Construction, Automotive, Consumer Goods, Marine, Industrial, Paper & Film Release, and Others) - Global Forecast to 2021


Silicone Coating Market is projected to reach USD 6.60 Billion by 2021, at a CAGR of 6.90%. In this study, 2014 has been considered as the historical year and 2015 as the base year for estimating market size, while the forecast period is between 2016 and 2021.
This report aims to estimate the size and future growth potential of the silicone coating market across different segments such as component type, technology, application, and region. The study also covers factors influencing the market growth such as drivers, restraints, opportunities, and industry-specific challenges and to analyze the opportunities in the market for stakeholders and present the competitive landscape for the market leaders during the forecast period.
Both, top-down and bottom-up approaches have been used to estimate and validate the size of the global market and to estimate the sizes of various other dependent submarkets in the silicone coating market. The research study involved the use of extensive secondary sources, directories, and databases such as Hoovers, Bloomberg, Chemical Weekly, Factiva, Global Silicone Council (GSC), Silicone Industry Association of Japan (SIAJ), Silicones Environmental, Health & Safety Council of North America (SEHSC), and other government and private & company websites to identify and collect information useful for the technical, market-oriented, and commercial study of the global silicone coatings market.
To know about the assumptions considered for the study, download the pdf brochure
Key Players in Silicone Coating Market
The silicone coating market has a diversified and established ecosystem of its upstream players such as raw material suppliers and the downstream stakeholders such as manufacturers, vendors, end users, and government organizations. Dow Corning Corporation (U.S.) and Wacker Chemie AG (Germany) are the silicone coatings manufacturers and also major raw material suppliers. The major industries where these manufacturers supply silicone coatings include construction, automotive & transportation, consumer goods, marine, industrial, and paper & film release.
Key Target Audience in Silicone Coating Market
- Silicone coatings manufacturers
- Raw material suppliers
- Traders, distributors, and suppliers of silicone coatings
- Regional manufacturers’ associations and general silicone coatings associations
- Government and regional agencies and research organizations
- Investment research firms
Silicone Coating Market Report Scope
This research report categorizes the global silicone coating market on the basis of composition type, technology, application, and region.
On the basis of Composition Type:
- Silicone Additives
- Silicone Polymers
- 100% Silicone
- Silicone Water Repellents
On the basis of Technology:
- Solvent-based
- Solventless
- Water-based
- Powder-based
On the basis of Application:
- Construction
- Automotive & Transportation
- Consumer Goods
- Industrial
- Paper & Film Release
- Marine
- Others
On the basis of Region:
- North America
- Europe
- Asia-Pacific
- Middle East & Africa
- RoW
The market is further analyzed for the key countries in each of these regions.
Silicone Coating Market Report Available Customizations
With the given market data, MarketsandMarkets offers customizations according to the company’s specific needs. The following customization options are available for the report:
Regional Analysis:
- Country-level analysis of the silicone coatings market by application.
Company Information:
- Detailed analysis and profiling of additional market players.
The global silicone coating market is projected to reach USD 6.60 Billion by 2021, registering a CAGR of 6.90% between 2016 and 2021. The growing manufacturing & end-use industries and increasing construction sector increasing the demand for silicone coatings in the Asia-Pacific region and continuous product development, expansion, and joint venture activities undertaken by companies are the key factors for the growth of the global silicone coatings market.
In 2015, consumer goods segment accounted for the largest market share, in terms of value, followed by construction and paper & film release segments. The market in the paper & film release segment is estimated to witness the highest CAGR between 2016 and 2021, in terms of value, because of excellent properties of silicone coatings such as flexibility, chemical resistance, excellent slip and stability over a wide range of temperature to the substrates.
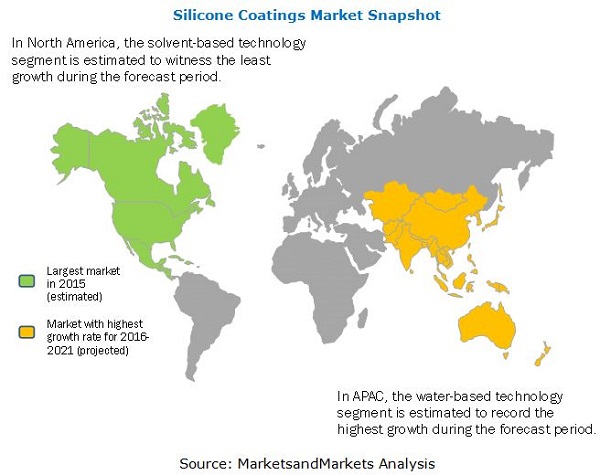
100% silicone is currently the dominant composition type in the silicone coating market, while silicone water repellents are estimated to witness the highest CAGR between 2016 and 2021. The rising demand for silicone coatings is mainly driven by the increasing usage in construction application and rising demand from developing countries such as India, China, and Brazil.
Asia-Pacific is also expected to witness the highest growth rate in the silicone coatings market, in terms of value and volume, between 2016 and 2021. Rising investments by foreign companies; growing production facilities; strong industrial base for construction, consumer goods, and automotive sectors; and improve in standard of living are the other major factors contributing to the growth of the silicone coatings market in this region.
Though the silicone coating market is gaining importance, few factors act as a bottleneck toward the growth silicone coatings in the global market. The volatility in raw material prices and its manufacturing cost are the major restraints toward the growth of the market.
Key Silicone Coating Market Industry Players
Companies such as Wacker Chemie AG (Germany), Momentive Performance Material Inc., (U.S.), Dow Corning Corporation (U.S.), Shin-Etsu Chemical Co., Ltd. (Japan), and KCC Silicone (South Korea) are the dominant market players in the global silicone coatings market. The diverse product portfolio and strategically positioned R&D centers, continuous adoption of development strategies, and technological advancements are few factors that are responsible for strengthening position of these companies in the silicone coating market. They have been adopting various organic and inorganic growth strategies to enhance the current market scenario of silicone coating.
Frequently Asked Questions (FAQ):
What is the Silicone Coatings Market growth?
Silicone Coatings Market growth - Registering a CAGR of 6.90% between 2016 and 2021.
Who leading market players in Silicone Coatings industry?
The players profiled in the silicone coatings market report include Dow Corning Corporation (U.S.), Wacker Chemie AG (Germany), Momentive Performance Material Inc., (U.S.), Shin-Etsu Chemical Co ., Ltd. (Japan), KCC Silicone (South-Korea), and other regional players.
How big is the Silicone Coatings Market?
Silicone Coatings Market is projected to reach USD 6.60 Billion by 2021.
Which segments are covered in Silicone Coatings Market report?
By Type (Additives, Polymers, 100% Silicone, Water Repellents Silicone, and Others), Technology & Application (Construction, Automotive, Consumer Goods, Marine, Industrial, Paper & Film Release).
To speak to our analyst for a discussion on the above findings, click Speak to Analyst
Table of Contents
1 Introduction (Page No. - 18)
1.1 Objectives of the Study
1.2 Market Definition
1.3 Market Scope
1.3.1 Markets Covered
1.3.2 Years Considered for the Study
1.4 Currency
1.5 Package Size
1.6 Stakeholders
2 Research Methodology (Page No. - 21)
2.1 Research Data
2.2 Secondary Data
2.2.1 Key Data From Secondary Sources
2.3 Primary Data
2.3.1 Key Data From Primary Sources
2.3.2 Key Industry Insights
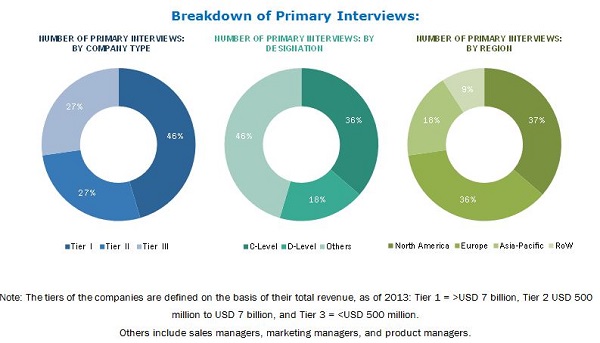
2.3.3 Breakdown of Primary Interviews: By Company Type, Designation, and Region
2.4 Market Size Estimation
2.4.1 Bottom-Up Approach
2.4.2 Top-Down Approach
2.5 Data Triangulation
2.6 Assumptions and Limitations
2.6.1 Assumptions
2.6.2 Limitations
3 Executive Summary (Page No. - 31)
4 Premium Insights (Page No. - 36)
4.1 Attractive Opportunities for Market Players
4.2 Silicone Coatings Market: Major Types
4.3 Silicone Coating Market: Developed vs Developing Countries
4.4 Life Cycle Analysis, By Region
4.5 Silicone Coatings Market
4.6 U.S. and China Dominated the Global Silicone Coating Market
5 Market Overview (Page No. - 42)
5.1 Introduction
5.2 Market Segmentation
5.2.1 By Composition Type
5.2.2 By Technology
5.2.3 By Application
5.2.4 By Region
5.3 Market Dynamics
5.3.1 Drivers
5.3.1.1 Growing Construction Industry
5.3.1.2 Rising Demand From Consumer Goods Industry
5.3.1.3 Growth Due to Emerging Economies Such as Asia-Pacific, the Middle East & Africa, and Latin America
5.3.2 Restraints
5.3.2.1 High Manufacturing Cost of Production
5.3.3 Opportunities
5.3.3.1 Growth Opportunity From Emerging Economies Such as China and India
5.3.3.2 Growing Opportunities in Food Contact Paper Segment
5.3.4 Challenges
5.3.4.1 Price-Sensitive Market
5.3.4.2 Stringent Regulatory Approvals Required for Production
6 Industry Trends (Page No. - 49)
6.1 Introduction
6.2 Value Chain Analysis
6.3 Porter’s Five Forces Analysis
6.3.1 Intensity of Competitive Rivalry
6.3.2 Bargaining Power of Buyers
6.3.3 Bargaining Power of Suppliers
6.3.4 Threat of Substitutes
6.3.5 Threat of New Entrants
7 Silicone Coatings Market, By Composition Type (Page No. - 55)
7.1 Introduction
7.2 Silicone Additives
7.3 Silicone Polymers
7.3.1 Silicone Acrylic
7.3.2 Silicone Epoxy
7.3.3 Silicone Polyester
7.3.4 Silicone Polyurethane
7.4 100% Silicone
7.4.1 Methyl Silicone
7.4.2 Phenyl Silicone
7.4.3 Others
7.5 Silicone Water Repellents
7.5.1 Silane
7.5.2 Silicone Emulsions
7.5.3 Others
8 Silicone Coating Market, By Technology (Page No. - 74)
8.1 Introduction
8.2 Solventless
8.3 Solvent-Based
8.4 Water-Based
8.5 Powder-Based
9 Silicone Coatings Market, By Application (Page No. - 81)
9.1 Introduction
9.2 Construction
9.3 Automotive & Transportation
9.4 Consumer Goods
9.5 Marine
9.6 Industrial
9.7 Paper & Film Release
9.8 Others
10 Silicone Coating Market, By Region (Page No. - 94)
10.1 Introduction
10.2 North America
10.2.1 U.S.
10.2.2 Canada
10.2.3 Mexico
10.3 Europe
10.3.1 Germany
10.3.2 U.K.
10.3.3 France
10.3.4 Italy
10.3.5 Turkey
10.3.6 Rest of Europe
10.4 Asia-Pacific
10.4.1 China
10.4.2 Japan
10.4.3 South Korea
10.4.4 India
10.4.5 Southeast Asia
10.4.6 Rest of Asia-Pacific
10.5 Middle East & Africa
10.5.1 Middle East
10.5.2 Africa
10.6 RoW
10.6.1 Brazil
10.6.2 Russia
10.6.3 Others
11 Competitive Landscape (Page No. - 142)
11.1 Overview
11.2 Competitive Situations and Trends
11.2.1 Investments & Expansions
11.2.2 New Product Launches
11.2.3 Joint Ventures, Partnerships, Contracts & Agreements
12 Company Profiles (Page No. - 148)
(Overview, Financial*, Products & Services, Strategy, and Developments)
12.1 Wacker Chemie AG
12.2 Momentive Performance Materials Inc.
12.3 Shin-Etsu Chemical Co., Ltd.
12.4 DOW Corning Corporation
12.5 KCC Silicone
12.6 Evonik Industries
12.7 BASF SE
12.8 Humiseal
12.9 BYK-Chemie GmbH
12.10 ACC Silicones
12.11 Afcona Additives
12.12 OMG Brochers
12.13 Siltech Corporation
12.14 Lakmar
12.15 Bluestar Silicones
*Details Might Not Be Captured in Case of Unlisted Companies.
13 Appendix (Page No. - 183)
13.1 Insights From Industry Experts
13.2 Discussion Guide
13.3 Knowledge Store: Marketsandmarkets’ Subscription Portal
13.4 Introducing RT: Real Time Market Intelligence
13.5 Available Customizations
13.6 Related Reports
List of Tables (159 Tables)
Table 1 Silicone Coatings Market Snapshot (2016 vs 2021)
Table 2 Top 9 Economies By Gdp in Ppp Terms, 2010 and 2020
Table 3 Silicone Coating Market Size, By Composition Type, 2014–2021 (USD Million)
Table 4 Silicone Coatings Market Size, By Composition Type, 2014–2021 (Kiloton)
Table 5 Silicone Additives Market Size, By Region, 2014–2021 (USD Million)
Table 6 Silicone Additives Market Size, By Region, 2014–2021 (Kiloton)
Table 7 Silicone Polymers Market Size, By Region, 2014–2021 (USD Million)
Table 8 Silicone Polymers Market Size, By Region, 2014–2021 (Kiloton)
Table 9 Silicone Polymers Market Size, By Sub-Segment, 2014–2021 (USD Million)
Table 10 Silicone Polymers Market Size, By Sub-Segment, 2014–2021 (Kiloton)
Table 11 Silicone Acrylic Market Size, By Region, 2014–2021 (USD Million)
Table 12 Silicone Acrylic Market Size, By Region, 2014–2021 (Kiloton)
Table 13 Silicone Epoxy Market Size, By Region, 2014–2021 (USD Million)
Table 14 Silicone Epoxy Market Size, By Region, 2014–2021 (Kiloton)
Table 15 Silicone Polyester Market Size, By Region, 2014–2021 (USD Million)
Table 16 Silicone Polyester Market Size, By Region, 2014–2021 (Kiloton)
Table 17 Silicone Polyurethane Market Size, By Region, 2014–2021 (USD Million)
Table 18 Silicone Polyurethane Market Size, By Region, 2014–2021 (Kiloton)
Table 19 Thermal Stability of Organic Substitutes on Silicone
Table 20 100% Silicone Market Size, By Region, 2014–2021 (USD Million)
Table 21 100% Silicone Market Size, By Region, 2014–2021 (Kiloton)
Table 22 100% Silicone Market Size, By Sub-Segment, 2014–2021 (USD Million)
Table 23 100% Silicone Market Size, By Sub-Segment, 2014–2021 (Kiloton)
Table 24 Methyl Silicone Market Size, By Region, 2014–2021 (USD Million)
Table 25 Methyl Silicone Market Size, By Region, 2014–2021 (Kiloton)
Table 26 Phenyl Silicone Market Size, By Region, 2014–2021 (USD Million)
Table 27 Phenyl Silicone Market Size, By Region, 2014–2021 (Kiloton)
Table 28 Other 100% Silicone Coatings Market Size, By Region, 2014–2021 (USD Million)
Table 29 Other 100% Silicone Coating Market Size, By Region, 2014–2021 (Kiloton)
Table 30 Silicone Water Repellents Market Size, By Region, 2014–2021 (USD Million)
Table 31 Silicone Water Repellents Market Size, By Region, 2014–2021 (Kiloton)
Table 32 Silicone Water Repellents Market Size, By Subsegment, 2014–2021 (USD Million)
Table 33 Silicone Water Repellents Market Size, By Subsegment, 2014–2021 (Kiloton)
Table 34 Silane Market Size, By Region, 2014–2021 (USD Million)
Table 35 Silane Market Size, By Region, 2014–2021 (Kiloton)
Table 36 Silicone Emulsions Market Size, By Region, 2014–2021 (USD Million)
Table 37 Silicone Emulsions Market Size, By Region, 2014–2021 (Kiloton)
Table 38 Other Silicone Water Repellents Market Size, By Region, 2014–2021 (USD Million)
Table 39 Other Silicone Water Repellents Market Size, By Region, 2014–2021 (Kiloton)
Table 40 Silicone Coatings Market Size, By Technology, 2016–2021 (USD Million)
Table 41 Silicone Coating Market Size, By Technology, 2016–2021 (Kiloton)
Table 42 Solventless Market Size, By Region, 2016–2021 (USD Million)
Table 43 Solventless Market Size, By Region, 2016–2021 (Kiloton)
Table 44 Solvent-Based Market Size, By Region, 2016–2021 (USD Million)
Table 45 Solvent-Based Market Size, By Region, 2016–2021 (Kiloton)
Table 46 Water-Based Market Size, By Region, 2016–2021 (USD Million)
Table 47 Water-Based Market Size, By Region, 2016–2021 (Kiloton)
Table 48 Powder-Based Market Size, By Region, 2016–2021 (USD Million)
Table 49 Powder-Based Market Size, By Region, 2016–2021 (Kiloton)
Table 50 Silicone Coatings Market Size, By Application, 2014–2021 (USD Million)
Table 51 Silicone Coating Market Size, By Application, 2014–2021 (Kiloton)
Table 52 Silicone Coatings Market Size in Construction, By Region, 2014–2021 (USD Million)
Table 53 Silicone Coating Market Size in Construction, By Region, 2014–2021 (Kiloton)
Table 54 Silicone Coatings Market Size in Automotive & Transportation, By Region, 2014–2021 (USD Million)
Table 55 Silicone Coating Market Size in Automotive & Transportation, By Region, 2014–2021 (Kiloton)
Table 56 Silicone Coatings Market Size in Consumer Goods, By Region, 2014–2021 (USD Million)
Table 57 Silicone Coating Market Size in Consumer Goods, By Region, 2014–2021 (Kiloton)
Table 58 Silicone Coatings Market Size in Marine, By Region, 2014–2021 (USD Million)
Table 59 Silicone Coating Market Size in Marine, By Region, 2014–2021 (Kiloton)
Table 60 Silicone Coatings Market Size in Industrial, By Region, 2014–2021 (USD Million)
Table 61 Silicone Coating Market Size in Industrial, By Region, 2014–2021 (Kiloton)
Table 62 Silicone Coatings Market Size in Paper & Film Release, By Region, 2014–2021 (USD Million)
Table 63 Silicone Coating Market Size in Paper & Film Release, By Region, 2014–2021 (Kiloton)
Table 64 Silicone Coatings Market Size in Other Applications, By Region, 2014–2021 (USD Million)
Table 65 Silicone Coating Market Size in Other Applications, By Region, 2014–2021 (Kiloton)
Table 66 Silicone Coatings Market Size, By Region, 2014–2021 (USD Million)
Table 67 Silicone Coating Market Size, By Region, 2014–2021 (Kiloton)
Table 68 North America: Silicone Coatings Market Size, By Country, 2014–2021 (USD Million)
Table 69 North America: Market Size, By Country, 2014–2021 (Kiloton)
Table 70 North America: Market Size, By Composition Type, 2014–2021 (USD Million)
Table 71 North America: Market Size, By Composition Type, 2014–2021 (Kiloton)
Table 72 North America: Market Size, By Silicone Polymers Sub-Segment, 2014–2021 (USD Million)
Table 73 North America: Market Size, By Silicone Polymers Sub-Segment, 2014–2021 (Kiloton)
Table 74 North America: Market Size, By 100% Silicone Sub-Segment, 2014–2021 (USD Million)
Table 75 North America: Market Size, By 100% Silicone Sub-Segment, 2014–2021 (Kiloton)
Table 76 North America: Market Size, By Silicone Water Repellents Sub-Segment, 2014–2021 (USD Million)
Table 77 North America: Market Size, By Silicone Water Repellents Sub-Segment, 2014–2021 (Kiloton)
Table 78 North America: Market Size, By Technology, 2014–2021 (USD Million)
Table 79 North America: Market Size, By Technology, 2014–2021 (Kiloton)
Table 80 North America: Market Size, By Application, 2014–2021 (USD Million)
Table 81 North America: Market Size, By Application, 2014–2021 (Kiloton)
Table 82 U.S.: Silicone Coatings Market Size, 2014–2021 (Volume and Value)
Table 83 Canada: Silicone Coating Market Size, 2014–2021 (Volume and Value)
Table 84 Mexico: Silicone Coatings Market Size, 2014–2021 (Volume and Value)
Table 85 Europe: Silicone Coating Market Size, By Country, 2014–2021 (USD Million)
Table 86 Europe: Market Size, By Country, 2014–2021 (Kiloton)
Table 87 Europe: Market Size, By Composition Type, 2014–2021 (USD Million)
Table 88 Europe: Market Size, By Composition Type, 2014–2021 (Kiloton)
Table 89 Europe: Market Size, By Silicone Polymers Sub-Segment, 2014–2021 (USD Million)
Table 90 Europe: Market Size, By Silicone Polymers Sub-Segment, 2014–2021 (Kiloton)
Table 91 Europe: Market Size, By 100% Silicone Sub-Segment, 2014–2021 (USD Million)
Table 92 Europe: Market Size, By 100% Silicone Sub-Segment, 2014–2021 (Kiloton)
Table 93 Europe: Market Size, By Silicone Water Repellents Sub-Segment, 2014–2021 (USD Million)
Table 94 Europe: Market Size, By Silicone Water Repellents Sub-Segment, 2014–2021 (Kiloton)
Table 95 Europe: Market Size, By Technology, 2014–2021 (USD Million)
Table 96 Europe: Market Size, By Technology, 2014–2021 (Kiloton)
Table 97 Europe: Market Size, By Application, 2014–2021 (USD Million)
Table 98 Europe: Market Size, By Application, 2014–2021 (Kiloton)
Table 99 Germany: Silicone Coatings Market Size, 2014–2021 (Volume and Value)
Table 100 France: Silicone Coating Market Size, 2014–2021 (Volume and Value)
Table 101 Italy: Silicone Coatings Market Size, 2014–2021 (Volume and Value)
Table 102 Turkey: Silicone Coating Market Size, 2014–2021 (Volume and Value)
Table 103 Rest of Europe: Silicone Coatings Market Size, 2014–2021 (Volume and Value)
Table 104 Asia-Pacific: Silicone Coatings Market Size, By Country, 2014–2021 (USD Million)
Table 105 Asia-Pacific: Market Size, By Country, 2014–2021 (Kiloton)
Table 106 Asia-Pacific: Market Size, By Composition Type, 2014–2021 (USD Million)
Table 107 Asia-Pacific: Market Size, By Composition Type, 2014–2021 (Kiloton)
Table 108 Asia-Pacific: Market Size, By Silicone Polymers Sub-Segment, 2014–2021 (USD Million)
Table 109 Asia-Pacific: Market Size, By Silicone Polymers Sub-Segment, 2014–2021 (Kiloton)
Table 110 Asia-Pacific: Market Size, By 100% Silicone Sub-Segment, 2014–2021 (USD Million)
Table 111 Asia-Pacific: Market Size, By 100% Silicone Sub-Segment, 2014–2021 (Kiloton)
Table 112 Asia-Pacific: Market Size, By Silicone Water Repellents Sub-Segment, 2014–2021 (USD Million)
Table 113 Asia-Pacific: Market Size, By Silicone Water Repellents Sub-Segment, 2014–2021 (Kiloton)
Table 114 Asia-Pacific: Market Size, By Technology, 2014–2021 (USD Million)
Table 115 Asia-Pacific: Market Size, By Technology, 2014–2021 (Kiloton)
Table 116 Asia-Pacific: Market Size, By Application, 2014–2021 (USD Million)
Table 117 Asia-Pacific: Market Size, By Application, 2014–2021 (Kiloton)
Table 118 China: Silicone Coatings Market Size, 2014–2021 (Volume and Value)
Table 119 Japan: Silicone Coating Market Size, 2014–2021 (Volume and Value)
Table 120 South Korea: Silicone Coatings Market Size, 2014–2021 (Volume and Value)
Table 121 India: Silicone Coating Market Size, 2014–2021 (Volume and Value)
Table 122 Southeast Asia: Silicone Coatings Market Size, 2014–2021 (Volume and Value)
Table 123 Rest of Asia-Pacific: Silicone Coating Market Size, 2014–2021 (Volume and Value)
Table 124 Middle East & Africa: Silicone Coatings Market, By Country, 2014–2021 (USD Million)
Table 125 Middle East & Africa: Market, By Country, 2014–2021 (Kiloton)
Table 126 Middle East & Africa: Market Size, By Composition Type, 2014–2021 (USD Million)
Table 127 Middle East & Africa: Market Size, By Composition Type, 2014–2021 (Kiloton)
Table 128 Middle East & Africa: Market Size, By Silicone Polymers Sub-Segment, 2014–2021 (USD Million)
Table 129 Middle East & Africa: Market Size, By Silicone Polymers Sub-Segment, 2014–2021 (Kiloton)
Table 130 Middle East & Africa: Market Size, By 100% Silicone Sub-Segment, 2014–2021 (USD Million)
Table 131 Middle East & Africa: Market Size, By 100% Silicone Sub-Segment, 2014–2021 (Kiloton)
Table 132 Middle East & Africa: Market Size, By Silicone Water Repellents Sub-Segment, 2014–2021 (USD Million)
Table 133 Middle East & Africa: Market Size, By Silicone Water Repellents Sub-Segment, 2014–2021 (Kiloton)
Table 134 Middle East & Africa: Market Size, By Technology, 2014–2021 (USD Million)
Table 135 Middle East & Africa: Market Size, By Technology, 2014–2021 (Kiloton)
Table 136 Middle East & Africa: Market Size, By Application, 2014–2021 (USD Million)
Table 137 Middle East & Africa: Market Size, By Application, 2014–2021 (Kiloton)
Table 138 Middle East: Silicone Coatings Market Size, 2014–2021 (Volume and Value)
Table 139 Africa: Silicone Coating Market Size, 2014–2021 (Volume and Value)
Table 140 RoW: Silicone Coatings Market Size, By Country, 2014–2021 (USD Million)
Table 141 RoW: Market Size, By Country, 2014–2021 (Kiloton)
Table 142 RoW: Market Size, By Composition Type, 2014–2021 (USD Million)
Table 143 RoW: Market Size, By Composition Type, 2014–2021 (Kiloton)
Table 144 RoW: Market Size, By Silicone Polymers Sub-Segment, 2014–2021 (USD Million)
Table 145 RoW: Market Size, By Silicone Polymers Sub-Segment, 2014–2021 (Kiloton)
Table 146 RoW: Market Size, By 100% Silicone Sub-Segment, 2014–2021 (USD Million)
Table 147 RoW: Market Size, By 100% Silicone Sub-Segment, 2014–2021 (Kiloton)
Table 148 RoW: Market Size, By Silicone Water Repellents Sub-Segment, 2014–2021 (USD Million)
Table 149 RoW: Market Size, By Silicone Water Repellents Sub-Segment, 2014–2021 (Kiloton)
Table 150 RoW: Market Size, By Technology, 2014–2021 (USD Million)
Table 151 RoW: Market Size, By Technology, 2014–2021 (Kiloton)
Table 152 RoW: Market Size, By Application, 2014–2021 (USD Million)
Table 153 RoW: Market Size, By Application, 2014–2021 (Kiloton)
Table 154 Brazil: Silicone Coatings Market Size, 2014–2021 (Volume and Value)
Table 155 Russia: Silicone Coating Market Size, 2014–2021 (Volume and Value)
Table 156 Others: Silicone Coatings Market Size, 2014–2021 (Volume and Value)
Table 157 Investments & Expansions, 2011–2016
Table 158 New Product Launches, 2011–2016
Table 159 Joint Ventures, Partnerships, Contracts & Agreements, 2011–2016
List of Figures (53 Figures)
Figure 1 Silicone Coating Market Segmentation
Figure 2 Silicone Coating Market: Research Design
Figure 3 Market Size Estimation: Bottom-Up Approach
Figure 4 Market Size Estimation: Top-Down Approach
Figure 5 Data Triangulation
Figure 6 Assumptions in the Research Study
Figure 7 Limitations of the Research Study
Figure 8 North America to Dominate the Silicone Coatings Market By 2021
Figure 9 100% Silicone Segment Dominated Silicone Coating Market in 2015
Figure 10 Paper & Film Release to Be the Fastest-Growing Segment Between 2016 and 2021
Figure 11 Asia-Pacific is the Fastest-Growing Market for Silicone Coatings By 2021
Figure 12 Emerging Economies Will Offer Lucrative Growth Potential for Market Players Between 2016 and 2021
Figure 13 Silicone Water Repellents Segment to Register the Highest CAGR in Silicone Coating Market Between 2016 and 2021
Figure 14 Markets to Grow Faster in Developing Countries Than Developed Countries Between 2016 and 2021
Figure 15 Silicone Coatings Market in Asia-Pacific to Grow Rapidly Between 2016 and 2021
Figure 16 Construction Segment Accounted for the Largest Share of the Silicone Coatings Market in 2015
Figure 17 China to Dominate Asia-Pacific Market Between 2016 and 2021
Figure 18 U.S. and China Accounted for the Largest Share of the Silicone Coating Market in 2015
Figure 19 Silicone Coatings Market, By Region
Figure 20 Drivers, Restraints, Opportunities, and Challenges
Figure 21 Silicone Coatings Value Chain Analysis
Figure 22 Porter’s Five Forces Analysis
Figure 23 100% Silicone Coatings to Dominate Market Between 2016 and 2021
Figure 24 North America Dominated Silicone Coating Market in 2015
Figure 25 Solventless Segment of Silicone Coatings to Dominate the Market Between 2016 and 2021
Figure 26 High Growth in Major Application Will Continue to Drive the Market Between 2016 and 2021
Figure 27 Paper & Film Release is the Fastest-Growing Segment Between 2016 and 2021
Figure 28 Global Production of Vehicles in 2014 and 2015
Figure 29 India, China, and Brazil are Emerging as Strategic Locations Between 2016 and 2021
Figure 30 Asia-Pacific A Potential Silicone Coatings Market, By Composition Type in 2015
Figure 31 Asia-Pacific to Drive the Silicone Coating Market, By Technology in 2015
Figure 32 Asia-Pacific to Drive the Silicone Coatings Market, By Application in 2015
Figure 33 Silicone Coatings Market Witnessed High Growth in Asia-Pacific, 2015
Figure 34 North America Was the Largest Silicone Coatings Market in 2015
Figure 35 North American Silicone Coating Market Snapshot
Figure 36 Rise in Manufacturing Activities to Drive the Silicone Coatings Market in the U.S. Between 2016 and 2021
Figure 37 Rise in the Demand for Paper & Film Release Products to Drive the Silicone Coating Market in Europe Between 2016 and 2021
Figure 38 Germany is the Key Market in Europe Between 2016 and 2021
Figure 39 Attractiveness of Silicone Coatings Market in Asia-Pacific
Figure 40 Construction Segment to Dominate the Silicone Coating Market Between 2016 and 2021
Figure 41 Companies Adopted Investment & Expansion as the Key Growth Strategy Between 2011 and 2016
Figure 42 Battle for Market Share: Investment & Expansion Was the Key Strategy Between 2011 to 2016
Figure 43 Wacker Chemie AG: Company Snapshot
Figure 44 Wacker Chemie AG: SWOT Analysis
Figure 45 Momentive Performance Materials Inc.: Company Snapshot
Figure 46 Momentive Performance Materials Inc.: SWOT Analysis
Figure 47 Shin-Etsu Chemical Co., Ltd.: Company Snapshot
Figure 48 Shin-Etsu Chemical Co., Ltd.: SWOT Analysis
Figure 49 DOW Corning Corporation: Company Snapshot
Figure 50 DOW Corning Corporation: SWOT Analysis
Figure 51 KCC Silicone : Company Snapshot
Figure 52 KCC Silicone: SWOT Analysis
Figure 53 Humiseal: Company Snapshot


Growth opportunities and latent adjacency in Silicone Coating Market