Smart Connected Assets and Operations Market by Module (Hardware-Sensors, Processors, Network Connectivity- Wired & Wireless; APM Software & Platform, and Services- Professional & Managed), Industry, and Geography - Global Forecast to 2022


The smart connected assets and operations market was valued at USD 103.82 Billion in 2015 and is expected to reach USD 215.53 Billion by 2022, at a CAGR of 10.26% during the forecast period. The base year considered for the study is 2015 and the forecast period for the market size has been considered between 2016 and 2022. The automotive and transportation sector is expected to hold the largest share of the smart connected assets and operations market during the forecast period. Among all regions, the APAC is expected to grow at a higher rate during the forecast period. The main objectives of this study are:
- To define, describe, and forecast the global smart connected assets and operations market on the basis of module, industry and geography
- To provide a detailed Porter's analysis and market life cycle analysis along with the technology and market roadmap for the market
- To provide detailed information regarding the major factors influencing the growth of the market (drivers, restraints, opportunities, and challenges)
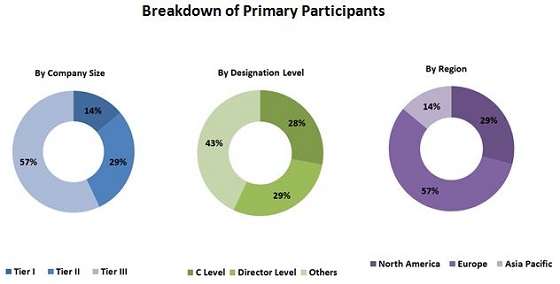
The research methodology used to estimate and forecast the smart connected assets and operations market begins with obtaining data on key vendor revenues through secondary research from sources such as BI Intelligence Estimate, 2015, Google statistics. The vendor offerings have been taken into consideration to determine the market segmentation. The top-down procedure has been employed to arrive at the overall market size of the global smart connected assets and operations market, which includes number of installation of smart connected assets and operations worldwide, and average selling price in USD. After arriving at the overall market size, the total market has been split into several segments and sub segments, which have then been verified through primary research by conducting extensive interviews with key people such as CEOs, VPs, directors, and executives. The data triangulation and market breakdown procedures have been employed to complete the overall market engineering process and arrive at the exact statistics for all segments and sub segments.
To know about the assumptions considered for the study, download the pdf brochure
This report provides valuable insights regarding the smart connected assets and operations market such as research and development; hardware and software providers; connectivity providers; business analytics; system integrators; end user; after sales service. This study also answers several questions for the stakeholders such as which market segments to focus on in the next two to five years for prioritizing the efforts and investments.
The smart connected assets and operations system comprises hardware providers such as Intel Corporation (U.S.), Broadcom Corporation (U.S.), and Freescale Semiconductor, Inc. (U.S.), ARM holding plc (U.K.), Texas Instruments (U.S.), Cypress Semiconductor (U.S.), Rockwell Automation (U.S.), NXP Semiconductor (Netherlands), and STMicroelectronics N.V. (Switzerland), whereas software providers includes companies such as Cisco System Inc. (U.S), IBM Corporation (U.S.), General Electric Company (U.S.), ABB Ltd (Switzerland), Bentley systems incorporated (U.S.), Maintenance Assistant Inc. (U.S.), OMCS International (U.S.), and iSolution international Pvt. ltd ( Philippines).
Target Audience:
- Raw material & equipment suppliers
- Original Equipment Manufacturers (OEMs)
- Hardware providers such as processors, sensors
- Software providers such as Asset performance management
- System integrators
- Distributors
- Research Organizations
- Forums, Alliances and Associations
- Technology investors
- End user such as automotive & transportation, energy & power, healthcare, smart agriculture, and factory automation among others
Get online access to the report on the World's First Market Intelligence Cloud
Request Sample Scope of the Report
:

The global smart connected assets and operations market, in this research report, has been segmented on the basis of module, industry and geography.
Smart connected assets and operations Market, by Module
- Hardware
- APM software & platform
- Service
Smart connected assets and operations Market, by Industry
- Automotive & Transportation
- Energy & Power
- Healthcare
- Smart Agriculture
- Factory Automation
- Others (Metal & Mining, Food & beverage, and Textile)
Smart connected assets and operations Market, by Geography
- Americas
- Europe
- APAC
- RoW
Available customizations:
With the given market data, MarketsandMarkets offers customizations as per a company�s specific needs. The following customization options are available for the report:
Geographic Analysis
- Comprehensive coverage of regulations followed in each region (the Americas, APAC, and Europe)
Company Information
- Detailed analysis and profiling of additional market players (up to five)
The smart connected assets and operations market was valued at USD 103.82 Billion in 2015 and is expected to reach USD 215.53 Billion by 2022, at a CAGR of 10.26% during the forecast period. Many countries are focusing on new innovations and expansions being carried out through the smart cities project, which would help to increase the demand for smart connected assets and operations system in the coming years.
The smart connected assets and operations market, on the basis of module, has been segmented into hardware, APM software and platform, and services. Among them, the market for APM software and platform is expected to grow at the highest rate during the forecast period. Majorly all the well-established industries have their existing infrastructure. They already have installed set up with the traditional equipment and hardware. For connecting the assets and operations smartly, IIoT platform and software is required, which is used to manage the asset�s performance with the help of APM software in order to generate better operational performance. So the APM software and platform are expected to grow at higher rate than the hardware components.
The smart connected assets and operations market, on the basis of industry, has been segmented into automotive and transportation, energy & power, healthcare, smart agriculture, factory automation, and others which includes metal & mining, food & beverages and textile. The healthcare industry is expected to grow at higher rate followed by the smart agriculture.
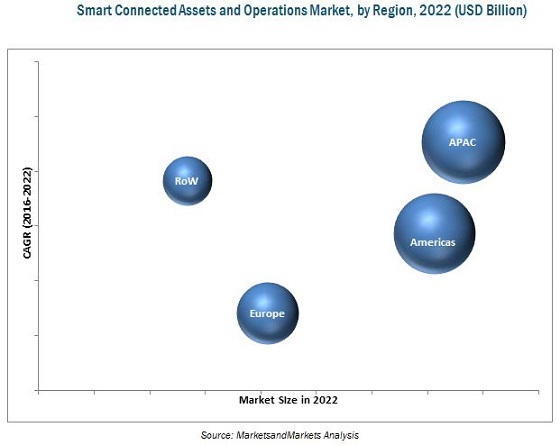
The smart connected assets and operations market, based on geography, has been segmented into Americas, Europe, APAC, and Rest of the World. The smart connected assets and operations market in APAC is expected to grow at the highest rate during the forecast period. The market growth can be attributed to the several initiatives taken up by the Government of India and many major player of smart connected assets and operations ecosystem, which help to improve the market.
Lack of standardization is the major restraining factor for the smart connected assets and operations market. In addition, the security and safety is the biggest challenge for the players for smart connected assets and operations system.
The key players in this market focus on strategic partnerships, acquisitions, agreements, and new product launches to increase their revenue. In August 2016, Intel Corporation launched new 7th Gen Intel core processors which are faster and more responsive and provide access to premium 4K ultra-high-definition content. Additionally, the company announced the Intel Joule compute module, which is a high-performance developer platform, with support for Intel RealSense depth-sensing cameras, targeted at Internet of Things (IoT) developers, entrepreneurs and established enterprises.
To speak to our analyst for a discussion on the above findings, click Speak to Analyst
Table of Contents
1 Introduction (Page No. - 17)
1.1 Objectives of the Study
1.2 Market Definition
1.3 Study Scope
1.3.1 Markets Covered
1.3.2 Years Considered for the Study
1.4 Currency & Pricing
1.5 Limitations
1.6 Stakeholders
2 Research Methodology (Page No. - 20)
2.1 Research Data
2.1.1 Secondary Data
2.1.1.1 Key Data From Secondary Sources
2.1.2 Primary Data
2.1.2.1 Key Data From Primary Sources
2.1.2.2 Key Industry Insights
2.1.2.3 Breakdown of Primaries Interviews
2.2 Market Size Estimation
2.2.1 Bottom-Up Approach
2.2.2 Top-Down Approach
2.3 Market Breakdown and Data Triangulation
2.4 Research Assumptions
3 Executive Summary (Page No. - 28)
4 Premium Insight (Page No. - 34)
4.1 Increasing Opportunites in APM Software & Platform is Expected to Drive the Market During the Forecast Period
4.2 Smart Connected Assets and Operation Market: By Service
4.3 Major Countries Present in the Smart Connected Assets and Opepartion Market
4.4 China Dominated the Market in APAC in 2015
4.5 Market, By Healthcare
4.6 Life Cycle Analysis, By Geography
5 Market Overview (Page No. - 38)
5.1 Introduction
5.2 Market Segmentation
5.2.1 Market, By Module
5.2.2 Market, By Industry
5.2.3 Market, By Geography
5.3 Market Dynamics
5.3.1 Drivers
5.3.1.1 Enhanced Operational Performance With New Control Systems
5.3.1.2 Reduction in Cost and Energy Efficiency
5.3.1.3 Increased Agility in Manufacturing
5.3.2 Restraints
5.3.2.1 Lack of Standardization
5.3.2.2 Complexities Involved in Connecting Traditional Equipment
5.3.3 Opportunities
5.3.3.1 Increasing Adoption in Factory Automation
5.3.3.2 Reduction in Operational and Capital Costs Through Predictive Maintenance
5.3.3.3 Rising Adoption of Iot Across Small and Medium Businesses
5.3.3.4 Opportunity for Setting Up Large Number of Data Centers
5.3.4 Challenges
5.3.4.1 Rise in Security and Safety Concern
5.3.4.2 Managing Massive Amount of Data
5.3.4.3 Increase in Level of Integration Leading to Complex Architecture
5.3.4.4 Adaptability and Scalability
6 Industry Trends (Page No. - 48)
6.1 Introduction
6.2 Value Chain Analysis
6.3 Porter�s Five Forces Analysis
6.3.1 Intensity of Competitive Rivalry
6.3.2 Threat of Substitutes
6.3.3 Bargaining Power of Buyers
6.3.4 Bargaining Power of Suppliers
6.3.5 Threat of New Entrants
6.4 Industrial Iot Protocols
6.5 Impact of 5g on Smart Connected Assets and Operations
7 Market, By Module (Page No. - 62)
7.1 Introduction
7.2 Hardware
7.2.1 Processors
7.2.1.1 Microcontroller
7.2.1.2 Application Processor
7.2.1.3 DSP
7.2.1.4 Memory Chips
7.2.1.5 FPGA
7.2.2 Sensors
7.2.2.1 Temperature Sensor
7.2.2.2 Pressure Sensor
7.2.2.3 Humidity Sensor
7.2.2.4 Flow Sensor
7.2.2.5 Accelerometer
7.2.2.6 Magnetometer
7.2.2.7 Gyroscope
7.2.2.8 Image Sensor
7.2.2.9 Touch Sensors
7.2.2.10 Proximity Sensor
7.2.2.11 Acoustic Sensor
7.2.2.12 Motion Sensor
7.2.2.13 Occupancy Sensor
7.2.2.14 Other Sensors
7.2.3 Network Connectivity
7.2.3.1 Wired Technologies
7.2.3.2 Wireless Technologies
7.2.3.2.1 RFID
7.2.3.2.2 Wireless-Hart
7.2.3.2.3 Digimesh
7.2.3.2.4 ISA100.11a
7.2.3.2.5 IEEE 802.15.4
7.2.3.2.6 NFC
7.2.3.2.7 ANT+
7.2.3.2.8 Wi-Fi
7.2.3.2.9 Wimax
7.2.3.2.10 Zigbee
7.2.3.2.11 Enocean
7.2.3.2.12 Bluetooth
7.2.3.2.13 Eddystone- Bluetooth Low Energy (BLE)
7.2.3.2.14 Cellular Technologies
7.3 Assets Performance Management Software & Platform
7.3.1 Aspects of APM
7.3.1.1 Reliability-Centred Maintenance (RCM)
7.3.1.2 Condition-Based Monitoring (CBM)
7.3.1.3 Mro Inventory Optimization
7.3.2 Applications of APM Solution
7.3.2.1 Design & Configuration
7.3.2.2 Past Performance
7.3.2.3 Predicted Future Failure
7.3.2.4 Raw Material
7.3.2.5 Environmental Impact
7.3.2.6 Customer Requirements
7.3.2.7 Supplier Performance
7.4 Services
7.4.1 Professional Services
7.4.2 Managed Services
8 Market, By Industry (Page No. - 92)
8.1 Introduction
8.2 Automotive and Transportation
8.2.1 Roadways
8.2.2 Railways
8.2.3 Airways
8.2.4 Maritime
8.3 Energy and Power
8.4 Healthcare
8.4.1 Telemedicine
8.4.2 Clinical Operations and Workflow Management
8.4.3 Connected Imaging
8.4.4 Inpatient Monitoring
8.4.5 Medication Management
8.4.6 Others
8.5 Smart Agriculture
8.5.1 Precision Farming
8.5.2 Livestock Monitoring
8.5.3 Fish Farming
8.5.4 Smart Greenhouse
8.5.5 Others
8.6 Factory Automation
8.7 Others
9 Geographic Analysis (Page No. - 111)
9.1 Introduction
9.2 Americas
9.2.1 Expansion of the Portfolios of Smart Connected Assets and Operations
9.2.2 North America
9.2.2.1 Government Initiatives Help in Higher Adoption of Smart Connected Assets and Operations
9.2.2.2 U.S.
9.2.2.2.1 Increase in the Number of Installations of Iiot-Enabled Devices in the U.S.
9.2.2.3 Canada
9.2.2.3.1 Increase in the Adoption of Smart Connected Assets and Operations in the Manufacturing Industries
9.2.2.4 Mexico
9.2.2.4.1 Increasing Adoption of Smart Connected Assets and Operations Due to Various Initiatives Taken Up By Companies
9.2.3 South America
9.2.3.1 Increasing Focus on Enhancing Production Processes
9.2.3.2 Brazil
9.2.3.2.1 Various Initiatives By the Government and Public Companies Increasing Opportunities for the Market to Grow at Higher Rate
9.2.3.3 Rest of South America
9.2.3.3.1 Expansion of Smart Connected Assets and Operation Systems in Rural Market
9.3 Europe
9.3.1 Focus on Continuous Innovation of Smart Connected Assets and Operations
9.3.2 Germany
9.3.2.1 Increasing Initiatives of the German Government
9.3.3 U.K.
9.3.3.1 More Investments in Upcoming Projects for the Expansion of Market
9.3.4 France
9.3.4.1 Increasing Investments in the Development of Technologies
9.3.5 Rest of Europe
9.3.5.1 Increase in Installations of Iiot in the Automotive Sector
9.4 APAC
9.4.1 China
9.4.1.1 Increasing Opportunities for the Market Due to Growing Government Initiatives
9.4.2 Japan
9.4.2.1 Deployment of Smart Connected Assets and Operations to Increase in the Long Run
9.4.3 India
9.4.3.1 Strong Government Support for Implementing Smart Connected Assets and Operations
9.4.4 Rest of APAC
9.4.4.1 Significant Growth in the Market in Indonesia and Malaysia
9.5 Rest of the World (RoW)
9.5.1 Increasing Demand for Iiot in Various Industries
9.5.2 Middle East
9.5.2.1 Growing Demand for Iiot in the Automobile and Transportation Industry
9.5.3 Africa
9.5.3.1 Rising Investments in the Healthcare Industry By Government
10 Competitive Landscape (Page No. - 139)
10.1 Overview
10.2 Market Ranking for Market
10.3 Competitive Scenario
10.4 Recent Developments
10.4.1 New Product Launches
10.4.2 Expansions
10.4.3 Partnership/ Agreements/ Collaboration
10.4.4 Mergers & Acquisitions
11 Company Profiles (Page No. - 147)
11.1 Introduction
(Business Overview, Products & Services, Key Insights, Recent Developments, SWOT Analysis, Ratio Analysis, MnM View)*
11.2 Intel Corporation
11.3 Cisco Systems, Inc.
11.4 IBM Corporation
11.5 Arm Holdings PLC
11.6 General Electric Company
11.7 Texas Instruments Incorporated
11.8 Cypress Semiconductor Corporation
11.9 Rockwell Automation, Inc.
11.10 Stmicroelectronics N.V.
11.11 NXP Semiconductors N.V.
11.12 PTC Inc.
*Details on Business Overview, Products & Services, Key Insights, Recent Developments, SWOT Analysis, MnM View Might Not Be Captured in Case of Unlisted Companies.
12 Appendix (Page No. - 188)
12.1 Insights of Industry Experts
12.2 Discussion Guide
12.3 Knowledge Store: Marketsandmarkets� Subscription Portal
12.4 Introducing RT: Real-Time Market Intelligence
12.5 Available Customizations
12.6 Related Reports
12.7 Author Details
List of Tables (65 Tables)
Table 1 Porter�s Five Forces Analysis: Threat of New Entrants Likely to Have A Medium Impact on the Overall Market
Table 2 Smart Connected Assets and Operations Market, By Module, 2013�2022 (USD Billion)
Table 3 Market for Hardware, By Region, 2013�2022 (USD Billion)
Table 4 Market for Hardware in Americas, By Region, 2013�2022 (USD Billion)
Table 5 Market, By Hardware, 2013�2022 (USD Billion)
Table 6 Market for Processors, By Region, 2013�2022 (USD Billion)
Table 7 Market for Processors in Americas, By Region, 2013�2022 (USD Billion)
Table 8 Market for Sensors, By Region, 2013�2022 (USD Billion)
Table 9 Market for Sensors in Americas, By Region, 2013�2022 (USD Billion)
Table 10 Market, By Sensors, 2013�2022 (USD Million)
Table 11 Market, By Sensors, 2013�2022 (Million Units)
Table 12 Market for Network Connectivity, By Region, 2013�2022 (USD Billion)
Table 13 Market for Network Connectivity in Americas, By Region, 2013�2022 (USD Billion)
Table 14 Market, By Network Connectivity, 2013�2022 (USD Billion)
Table 15 Market, By Wireless Connectivity, 2013�2022 (USD Billion)
Table 16 Market for APM Software & Paltform, By Region, 2013�2022 (USD Billion)
Table 17 Market for APM Software & Paltform in Americas, By Region, 2013�2022 (USD Billion)
Table 18 Market for Service, By Region, 2013�2022 (USD Billion)
Table 19 Market for Services in Americas, By Region, 2013�2022 (USD Billion)
Table 20 Market, By Service, 2013�2022 (USD Billion)
Table 21 Market, By Industry, 2013�2022 (USD Billion)
Table 22 Market for Automotive and Transportation, By Module, 2013�2022 (USD Billion)
Table 23 Market for Automotive and Transportation, By Region, 2013�2022 (USD Billion)
Table 24 Market for Automotive and Transportation, By Type, 2013�2022 (USD Billion)
Table 25 Market for Energy and Power, By Module, 2013�2022 (USD Billion)
Table 26 Market for Energy and Power, By Region, 2013�2022 (USD Billion)
Table 27 Market for Healthcare, By Module, 2013�2022 (USD Billion)
Table 28 Market for Healthcare, By Region, 2013�2022 (USD Billion)
Table 29 Market for Healthcare, By Type, 2013�2022 (USD Billion)
Table 30 Market for Smart Agriculture, By Module, 2013�2022 (USD Billion)
Table 31 Market for Smart Agriculture, By Region, 2013�2022 (USD Billion)
Table 32 Market for Smart Agriculture, By Type, 2013�2022 (USD Billion)
Table 33 Market for Factory Automation, By Module, 2013�2022 (USD Billion)
Table 34 Market for Factory Automation, By Region, 2013�2022 (USD Billion)
Table 35 Market for Others, By Module, 2013�2022 (USD Billion)
Table 36 Market for Others, By Region, 2013�2022 (USD Billion)
Table 37 Market, By Region, 2013�2022 (USD Billion)
Table 38 Market in the Americas, By Module, 2013�2022 (USD Billion)
Table 39 Market in the Americas, By Hardware, 2013�2022 (USD Billion)
Table 40 Market in the Americas, By Industry, 2013�2022 (USD Billion)
Table 41 Market in the Americas, By Region, 2013�2022 (USD Billion)
Table 42 Market in North America, By Module , 2013�2022 (USD Billion)
Table 43 Market in North America, By Hardware, 2013�2022 (USD Billion)
Table 44 Market in North America , By Industry, 2013�2022 (USD Billion)
Table 45 Market in North America, By Country, 2013�2022 (USD Billion)
Table 46 Market in South America, By Module, 2013�2022 (USD Billion)
Table 47 Market in South America, By Hardware, 2013�2022 (USD Billion)
Table 48 Market in South America, By Industry, 2013�2022 (USD Billion)
Table 49 Market in South America, By Country, 2013�2022 (USD Billion)
Table 50 Market in Europe, By Module, 2013�2022 (USD Billion)
Table 51 Market in Europe, By Hardware, 2013�2022 (USD Billion)
Table 52 Market in Europe , By Industry, 2013�2022 (USD Billion)
Table 53 Market in Europe, By Country, 2013�2022 (USD Billion)
Table 54 Market in APAC, By Module, 2013�2022 (USD Billion)
Table 55 Market in APAC, By Hardware, 2013�2022 (USD Billion)
Table 56 Market in APAC, By Industry, 2013�2022 (USD Billion)
Table 57 Market in APAC, By Country, 2013�2022 (USD Billion)
Table 58 Market in RoW , By Module, 2013�2022 (USD Billion)
Table 59 Market in RoW, By Hardware, 2013�2022 (USD Billion)
Table 60 Market in RoW, By Industry, 2013�2022 (USD Billion)
Table 61 Market in RoW, By Region, 2013�2022 (USD Billion)
Table 62 New Product Launch, 2013�2015
Table 63 Partnerships & Joint Ventures, 2013�2014
Table 64 Partnership/ Collaboration/ Joint Venture, 2013�2015
Table 65 Mergers & Acquisitions, 2012�2015
List of Figures (74 Figures)
Figure 1 Smart Connected Assets and Operations Market: Research Design
Figure 2 Market Size Estimation Methodology: Bottom-Up Approach
Figure 3 Market Size Estimation Methodology: Top-Down Approach
Figure 4 Data Triangulation
Figure 5 APM Software & Platform Module to Grow at the Highest Rate During the Forecast Period
Figure 6 Healthcare Industry is Expected to Grow at the Highest Rate in the Market Between 2016 and 2022
Figure 7 Cellular Technolgies Expected to Grow at Higher Rate in Market for Wireless Conenctivity During the Forecast Period
Figure 8 Processors to Grow at the Highest Rate, in Terms of Value, in the Market During the Forecast Period
Figure 9 Market in APAC is Expected to Grow at the Highest Rate Between 2016 and 2022
Figure 10 Significant Increase in Demand for APM Software & Platform
Figure 11 Managed Service to Grow at the Highest Rate in the Smart Connected Assets and Operation Market During the Forecast Period
Figure 12 India Expected to Witness the Highest Growth Rate During the Forecast Period
Figure 13 Automotive and Transportation Held the Largest Market Share in APAC in 2015
Figure 14 Inpatient Monitoring Estimated to Grow at the Highest CAGR Between 2016 and 2022
Figure 15 Market in APAC in the Growth Stage, 2015
Figure 16 Smart Connected Assets and Operations: Market By Geography
Figure 17 Ability to Provide Better Operational Performance Expected to Spur the Growth of the Smart Connected Assets and Operation Market
Figure 18 World-Wide Ipv6 Deployment, 2009�2016
Figure 19 Increasing IoT Investment in Manufacturing Sector
Figure 20 Major Value Added During the Integration Phase
Figure 21 Impact of Intensity of Competitive Rivalry High in the Market in 2016
Figure 22 Market: Porter�s Five Forces Analysis
Figure 23 Intensity of Competitive Rivalry: High Competition in the Market Due to Competitor�s Market Share
Figure 24 Threat of Substitutes Likely to Remain Low Due to Low Number of Substitutes
Figure 25 Bargaining Power of Buyers to Be High Due to Product Differentiation
Figure 26 Bargaining Power of Suppliers Likely to Be Medium Due to Threat of Forward Integration
Figure 27 Threat of New Entrants Likely to Be Medium Due to Moderate R&D Expenses
Figure 28 Market Segmentation: By Module
Figure 29 Market Segmentation: By Hardware
Figure 30 Market for Processors Expected to Grow at A Higher Rate in South America During the Forecast Period
Figure 31 APAC Expected to Grow at the Highest Rate in Market for Sensors During the Forecast Period
Figure 32 Gyroscopes Expected to Grow at the Highest Rate, in Terms of Volume, in the Market for Sensors During the Forecast Period
Figure 33 South America Expected to Grow at Higher Rate in Smart Connected Assets and Operations for Network Conenctivity Market During the Forecast Period
Figure 34 Market Segmentation: By APM Software & Platform
Figure 35 Market Segmentation: By Service
Figure 36 Segmentation of the Market, By Industry
Figure 37 Market for Automotive and Transportation in APAC Expected to Grow at the Highest Rate Between 2016 and 2022
Figure 38 Market for Energy and Power Industry in APAC Expected to Grow at the Highest Rate During the Forecast Period
Figure 39 Market for the Healthcare Industry in RoW Expected to Grow at the Highest Rate Between 2016 and 2022
Figure 40 Market : By Smart Agriculture
Figure 41 APM Software and Platform to Lead the Market for the Factory Automation Industry During the Forecast Period
Figure 42 APM Software and Platform to Lead the Market for Other Industries During the Forecast Period
Figure 43 Market, By Geography
Figure 44 Market in APAC Expected to Register the Highest Growth Rate During the Forecast Period
Figure 45 Market in India, Brazil, and Africa Estimated to Grow at A High Rate Between 2016 and 2022
Figure 46 Market in the Americas
Figure 47 Market for the Healthcare Industry in South America to Grow at the High Rate Between 2016 and 2022
Figure 48 Snapshot of the Market in Europe
Figure 49 Market in Europe
Figure 50 Snapshot of the Market in APAC
Figure 51 Market in APAC
Figure 52 Market in RoW
Figure 53 Market for Processors in RoW Estimated to Grow at the Highest Rate Between 2016 and 2022
Figure 54 Key Growth Strategies Adopted By the Top Companies, 2013�2016
Figure 55 Market Ranking of the Top 5 Players in the Market, 2015
Figure 56 Market Evaluation Framework � Partnership/ Agreement/ Collaboration Fuelled Growth and Innovation Between 2013 and 2015
Figure 57 Battle for Market Share: New Product Launch Was the Key Strategy
Figure 58 Geographic Revenue Mix of Top Market Players
Figure 59 Intel Corporation: Company Snapshot
Figure 60 Intel Corporation: SWOT Analysis
Figure 61 Cisco Systems, Inc.: Company Snapshot
Figure 62 Cisco Systems, Inc.: SWOT Analysis
Figure 63 IBM Corporation: Company Snapshot
Figure 64 IBM Corporation: SWOT Analysis
Figure 65 Arm Holdings PLC: Company Snapshot
Figure 66 Arm Holdings PLC: SWOT Analysis
Figure 67 General Electric Co.: Company Snapshot
Figure 68 General Electric Company: SWOT Analysis
Figure 69 Texas Instruments Incorporated: Company Snapshot
Figure 70 Cypress Semiconductor Corporation: Company Snapshot
Figure 71 Rockwell Automation: Company Snapshot
Figure 72 Stmicroelectronics N.V.: Company Snapshot
Figure 73 NXP Semiconductors N.V.: Company Snapshot
Figure 74 PTC Inc.: Company Snapshot


Growth opportunities and latent adjacency in Smart Connected Assets and Operations Market