Smart Packaging Market by Technology (Active, Intelligent, and MAP), Industry Vertical (Food & Beverages, Automotive, Healthcare, Personal Care, and Others) & Geography - Global Forecast to 2020


The smart packaging market is driven by the increased demand for improved health, safety, and authenticity. Smart packaging is defined as a combination of active, intelligent, and modified atmosphere packaging techniques, specifically designed to increase and monitor shelf life. It is where components have been added in the packaging material or packaging headspace in order to improve the performance of the package system.
The various advantages offered by smart packaging over their conventional counterparts include increased shelf life, reduced counterfeiting, improved safety coupled with low cost, and easy implementation, among others.
The report also covers the major trends being followed in the smart packaging market, along with market dynamics, Porters analysis, and value chain analysis. The market dynamics are categorized under four headers, namely drivers, restraints, opportunities, and challenges. Market related forecasts have been done using these market dynamics.
The report also includes the detailed profiles of various companies currently active in this market. In addition to the company profiles, the report also provides a competitive landscape (CL) of the key players in the market. The CL section covers market share analysis, mergers and acquisitions, collaborations, partnerships, new product developments, and other key growth strategies of each player.Some of the key players in the industry that have been covered in this report are 3M (U.S.), TempTime Corporation (U.S.), PakSense (U.S.), American Thermal Instruments (U.S.), Avery Dennison (U.S.), R.R. Donnelly Sons & Company (U.S.), BASF SE (Germany), International Paper (U.S.), Stora Enso (Finland), Thin Film Electronics ASA (Norway), Huhtamaki Group (Finland), and Smartrac N.V. (The Netherlands), among others.
Get online access to the report on the World's First Market Intelligence Cloud
Request Sample Scope of the Report

This research report categorizes the smart packaging market based on different technologies, industry verticals, and geographies; it also covers the revenue forecast from 2013 to 2020. It describes the demand for smart packaging in various regions. The report describes the growth potential for smart packaging.
On the basis of technologies
On the basis of technology, smart packaging has been divided into active, intelligent, and MAP.
On the basis of industry verticals
The report segments the smart packaging market into five major industry verticals, which include food & beverages, automotive, healthcare, personal care, and others.
On the basis of regions
The geographic analysis of the said market covers the Americas, Europe, APAC, and RoW. In this report, Europe is the biggest market as the European Commission laws favor smart packaging over conventional packaging. It is followed by the Americas and APAC.
Smart packaging is a smart way to increase the traceability and shelf life of products. The usage of smart packaging helps in the prevention of food spoilage, enhancement of product attributes such as taste, flavor, and aroma; active tracking of changes in products or package environment; easy communication of product information, product history, or condition to consumer; assurance of seal integrity; confirmation of product authenticity; and antitheft prevention. Moreover, it also helps in premium pricing, supply chain management, brand protection, and waste reduction.
The smart packaging market size is expected to reach $39.7 Billion, growing at a CAGR of 4.8% from 2014 to 2020.
Smart packaging is utilized in industry verticals such as food & beverages, automotive, healthcare, personal care, and others. The rising demand for healthy, safe, and hygienic food products is expected to drive this market. The market associated with smart packaging is poised to witness tremendous growth. Applications such as food & beverages and healthcare are expected to be high growth areas for this industry.
The report covers the overall smart packaging market on the basis of different types of technologies, industry verticals, and geographies. The major industry verticals considered for this study are food & beverages, automotive, healthcare, personal care, and others.
Considering the geographic scenario of smart packaging, Europe occupied the top position, followed by the Americas in 2013. The APAC region is expected to exhibit the fastest growth from 2014 to 2020.
Smart Packaging Market Size ($ Million), 2013-2020
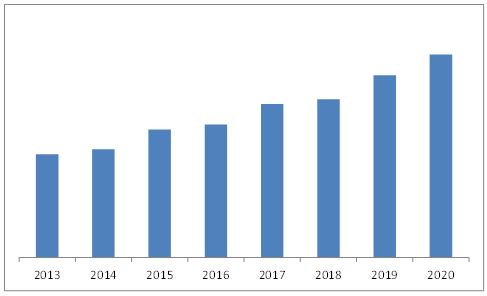
Source: MarketsandMarkets Analysis
Table of Contents
1 Introduction (Page No. - 15)
1.1 Objectives of the Study
1.2 Market Definition
1.3 Study Scope
1.3.1 Markets Covered
1.4 Stakeholders
1.5 Market Scope
1.5.1 Year
1.5.2 Currency
1.5.3 Package
1.5.4 Limitations
2 Research Methodology (Page No. - 18)
2.1 Research Data
2.1.1 Secondary Data
2.1.1.1 Key Data From Secondary Sources
2.1.2 Primary Data
2.1.2.1 Key Data From Primary Sources
2.1.2.2 Key Industry Insights
2.1.2.3 Breakdown of Primaries
2.2 Demand-Side Analysis
2.2.1 Introduction
2.2.2 Demand-Side Analysis
2.2.2.1 F&B Industry
2.2.2.1.1 Consumer Demand for Packaged Food & Beverage Products
2.2.2.2 Smart Labels
2.2.2.2.1 Demand for Sustainable Printed Electronics Technology
2.3 Market Size Estimation
2.4 Market Breakdown & Data Triangulation
2.5 Research Assumptions
2.5.1 Assumptions
3 Executive Summary (Page No. - 29)
4 Premium Insights (Page No. - 34)
4.1 Attractive Market Opportunities in the Smart Packaging Market
4.2 Active Packaging Market, By Industry Vertical
4.3 Intelligent Packaging Market, By Industry Vertical
4.4 MAP Packaging Market, By Industry Vertical
4.5 Market, By Application & Geography
4.6 Active & Intelligent Packaging Market, By Technology, 2020
4.7 Market, By Region (2014�2020)
5 Market Overview (Page No. - 39)
5.1 Introduction
5.2 Market Segmentation
5.2.1 By Technology
5.2.2 By Application
5.2.3 By Geography
5.3 Market Dynamics
5.3.1 Drivers
5.3.1.1 Aging Population and Change in the Consumer Lifestyle
5.3.1.2 the Growing Consumer Concern for Food Wastage Reduction and Demand for Smart and Functional Packaging
5.3.2 Restraints
5.3.2.1 High Price, Limited Availability, and Limited Consumer Awareness of Flexible Plastic Materials
5.3.2.2 High Cost, Lack of Integrators, and Complete Product Designers
5.3.3 Opportunities
5.3.3.1 Advancements in the Printed Technology
5.3.4 Challenges
5.3.4.1 High R&D Costs and Lack of Sustainable E-Packaging Products
5.3.5 Winning Imperative
5.3.5.1 Printed Electronics and Bio-Engineered Films�The Future of Smart Packaging
6 Industry Trends (Page No. - 47)
6.1 Introduction
6.2 Strategic Benchmarking
6.2.1 Product Innovation and Development
6.3 Value Chain Analysis
6.4 Porter�s Five Forces Analysis
6.4.1 Threat of New Entrants
6.4.2 Threat of Substitutes
6.4.3 Bargaining Power of Suppliers
6.4.4 Bargaining Power of Buyers
6.4.5 Intensity of Competitive Rivalry
7 Market, By Technology (Page No. - 55)
7.1 Introduction
7.2 Active Packaging
7.2.1 Antimicrobial
7.2.2 Gas Scavengers
7.2.2.1 Oxygen Scavengers
7.2.2.2 Ethylene (Ethene) Scavengers
7.2.3 Moisture Control
7.2.4 Corrosion Control
7.3 Intelligent Packaging (IP)
7.3.1 Indicators
7.3.1.1 Time-Temperature Indicators
7.3.1.2 Quality Indicators
7.3.2 Tracking Devices
7.3.2.1 Radio Frequency Identification Detection (RFID)
7.3.2.2 Near-Field Communication
7.4 Modified Atmosphere Packaging (MAP)
8 Market, By Industry Vertical (Page No. - 67)
8.1 Introduction
8.2 Food & Beverages
8.3 Automotive
8.4 Healthcare
8.5 Personal Care
8.6 Others
8.6.1 Electronic Goods
8.6.2 Logistics
9 Market, By Geography (Page No. - 85)
9.1 Introduction
9.2 Americas
9.3 Europe
9.4 APAC
9.5 RoW
10 Competitive Landscape (Page No. - 104)
10.1 Overview
10.2 Major Market Players
10.3 Competitive Situation and Trends
10.3.1 New Product Launches, Developments, and Upgradations
10.3.2 Acquisitions, Collaborations, and Partnerships
10.3.3 Other Developments
11 Company Profiles (Page No. - 110)
(Overview, Products and Services, Financials, Strategy & Development)*
11.1 Introduction
11.2 3M
11.3 BASF SE
11.4 E. I. Du Pont De Nemours and Company
11.5 Meadwestvaco Corporation
11.6 Sealed Air Corporation
11.7 Amcor Limited
11.8 Avery Dennison Corp.
11.9 Huhtamaki Group
11.10 International Paper
11.11 RR Donnelley
11.12 Smartrac N.V.
11.13 Sonoco Products Company
11.14 Stora Enso OYJ
11.15 Thin Film Electronics ASA
11.16 UPM-Kymmene Corporation
11.17 American Thermal Instruments (ATI)
11.18 Temptime Corporation
11.19 Multisorb Technologies Inc.
11.20 Paksense
*Details on Overview, Products and Services, Financials, Strategy & Development Might Not Be Captured in Case of Unlisted Companies.
12 Appendix (Page No. - 154)
12.1 Insights of Industry Experts
12.2 Discussion Guide
12.3 Introducing RT: Real-Time Market Intelligence
12.4 Available Customizations
12.5 Related Reports
List of Tables (73 Tables)
Table 1 Aging Population and Change in Consumer Lifestyle is Expected to Propel the Growth of Market
Table 2 High Cost Coupled With Limited Consumer Awarness is Expected to BeA Key Restraint
Table 3 Advancement in Printed Electronics: A Key Opportunity for Smart Packaging
Table 4 High R&D Expenses Along With Shortage of Sustainable E-Packaging Products: A Key Challenge for Market
Table 5 Market, By Technology, 2013�2020 ($Million)
Table 6 Active Packaging: Market, By Active Type,2013�2020 ($Million)
Table 7 Active Packaging: Market, By Vertical,2013�2020 ($Million)
Table 8 Active Packaging: Market, By Region,2013�2020 ($Million)
Table 9 Antimicrobial: Market, By Vertical,2013�2020 ($Million)
Table 10 Gas Scavengers: Market, By Vertical,2013�2020 ($Million)
Table 11 Moisture Control: Market, By Vertical,2013�2020 ($Million)
Table 12 Corrosion Control: Market, By Vertical,2013�2020 ($Million)
Table 13 Intelligent Packaging: Market, By Technology,2013�2020 ($Million)
Table 14 Intelligent Packaging: Market, By Vertical,2013�2020 ($Million)
Table 15 Intelligent Packaging: Market, By Region,2013�2020 ($Million)
Table 16 Indicators: Market, By Vertical, 2013�2020 ($Million)
Table 17 Tracking Devices: Market, By Vertical,2013�2020 ($Million)
Table 18 MAP: Market, By Vertical, 2013�2020 ($Million)
Table 19 MAP Packaging: Market, By Region,2013�2020 ($Million)
Table 20 Market Size, By Vertical, 2013�2020 ($Million)
Table 21 F&B: Market Size, By Type, 2013�2020 ($Million)
Table 22 F&B: Market Size, By Active Type, 2013�2020 ($Million)
Table 23 F&B: Market Size, By Intelligent Type,2013�2020 ($Million)
Table 24 F&B: Active Packaging Market Size, By Region, 2013�2020 ($Million)
Table 25 F&B: Intelligent Packaging Market Size, By Region, 2013�2020 ($Million)
Table 26 F&B: MAP Market Size, By Region, 2013�2020 ($Million)
Table 27 Automotive: Market Size, By Type,2013�2020 ($Million)
Table 28 Automotive: Active Packaging Market Size, By Region,2013�2020 ($Million)
Table 29 Automotive: Intelligent Packaging Market Size, By Region,2013�2020 ($Million)
Table 30 Healthcare: Market Size, By Type,2013�2020 ($Million)
Table 31 Healthcare: Market Size, By Active Type,2013�2020 ($Million)
Table 32 Healthcare: Market Size, By Intelligent Type,2013�2020 ($Million)
Table 33 Healthcare: Active Packaging Market Size, By Region,2013�2020 ($Million)
Table 34 Healthcare: Intelligent Packaging Market Size, By Region,2013�2020 ($Million)
Table 35 Healthcare: MAP Market Size, By Region, 2013�2020 ($Million)
Table 36 Personal Care: Market Size, By Type,2013�2020 ($Million)
Table 37 Personal Care: Active Packaging Market Size, By Region,2013�2020 ($Million)
Table 38 Personal Care: Intelligent Packaging Market Size, By Region,2013�2020 ($Million)
Table 39 Others: Market, By Type, 2013�2020 ($Million)
Table 40 Others: Market, By Active Type, 2013�2020 ($Million)
Table 41 Others: Active Packaging Market, By Region, 2013�2020 ($Million)
Table 42 Others: Intelligent Packaging Market, By Region, 2013�2020 ($Million)
Table 43 Market Size, By Region, 2013�2020 ($Million)
Table 44 Americas: Market Size, By Technology,2013�2020 ($Million)
Table 45 Americas: Market Size, By Vertical,2013�2020 ($Million)
Table 46 Americas: Market Size, By Region,2013�2020 ($Million)
Table 47 North America: Market Size, By Country,2013�2020 ($Million)
Table 48 North America: Active Packaging Market Size, By Country,2013�2020 ($Million)
Table 49 North America: Intelligent Packaging Market Size, By Country,2013�2020 ($Million)
Table 50 North America: MAP Packaging Market Size, By Country,2013�2020 ($Million)
Table 51 South America: Market Size, By Country,2013�2020 ($Million)
Table 52 Europe: Market Size, By Technology,2013�2020 ($Million)
Table 53 Europe: Market Size, By Vertical, 2013�2020 ($Million)
Table 54 Europe: Market Size, By Country, 2013�2020 ($Million)
Table 55 Europe: Active Packaging Market Size, By Country, 2013�2020 ($Million)
Table 56 Europe: Intelligent Packaging Market Size, By Country,2013�2020 ($Million)
Table 57 Europe: MAP Packaging Market Size, By Country, 2013�2020 ($Million)
Table 58 APAC: Market Size, By Technology,2013�2020 ($Million)
Table 59 APAC: Market Size, By Vertical, 2013�2020 ($Million)
Table 60 APAC: Market Size, By Country, 2013�2020 ($Million)
Table 61 APAC: Active Packaging Market Size, By Country, 2013�2020 ($Million)
Table 62 APAC: Intelligent Packaging Market Size, By Country,2013�2020 ($Million)
Table 63 APAC: MAP Packaging Market Size, By Country, 2013�2020 ($Million)
Table 64 RoW: Market Size, By Technology,2013�2020 ($Million)
Table 65 RoW: Market Size, By Vertical, 2013�2020 ($Million)
Table 66 RoW: Market Size, By Country, 2013�2020 ($Million)
Table 67 RoW: Active Packaging Market Size, By Country, 2013�2020 ($Million)
Table 68 RoW: Intelligent Packaging Market Size, By Country,2013�2020 ($Million)
Table 69 RoW: MAP Packaging Market Size, By Country, 2013�2020 ($Million)
Table 70 Major Players in Intelligent Packaging Market, By Technology, 2014
Table 71 Key New Product Launches, Developments & Expansions, 2014�2015
Table 72 Key Acquisitions, Collaborations, Partnerships, and Agreements,2014�2015
Table 73 Other Developments, 2014�2015
List of Figures (72 Figures)
Figure 1 Global Market, By Technology
Figure 2 Research Design
Figure 3 Global Consumption of Packed Beverages, By Region,2013�2016 (Billion Liters)
Figure 4 Global Smart Labels Market Size, 2012�2020 ($Million)
Figure 5 Market Size Estimation Methodology: Bottom-Up Approach
Figure 6 Market Size Estimation Methodology: Top-Down Approach
Figure 7 Market Breakdown & Data Triangulation
Figure 8 Assumptions of the Research Study
Figure 9 Market, 2014 & 2020 ($Million)
Figure 10 Global Market, By Industry Vertical, 2014
Figure 11 Active Packaging Market Snapshot (2014 vs. 2020): the Antimicrobial Technology is Expected to Grow at the Highest Rate During the Forecast Period
Figure 12 Intelligent Packaging Market Snapshot (2014 vs. 2020): the F&B Industry is Expected to Dominate the Market During the Forecast Period
Figure 13 Global Market Share, By Region, 2014
Figure 14 The Market Presents Lucrative Opportunities
Figure 15 The F&B Segment Would Continue to Dominate the Market During the Forecast Period
Figure 16 The Personal Care Segment is Expected to Grow the Fastest During the Forecast Period
Figure 17 The Healthcare Industry is Projected to Have the Highest CAGR During the Forecast Period
Figure 18 The Food & Beverages and Healthcare Segments Accounted for Majority of the Market Share in 2014
Figure 19 The Active Packaging Market Would Account for A Larger Share During the Forecast Period
Figure 20 The Americas is Expected to Replace Europe as the Biggest Market By 2020
Figure 21 Market, By Technology
Figure 22 Market, By Application
Figure 23 Market, By Geography
Figure 24 Advancements in Printed Technology: Key Enabler of Intelligent Packaging
Figure 25 North American Survey Over Packaged Food, 2010
Figure 26 Packaging Industry Growth, By Material (2010�2016)
Figure 27 Strategic Benchmarking: Companies Largely Adopted Organic Growth Strategies for Product Innovation & Enhancement
Figure 28 Value Chain
Figure 29 Porter�s Five Forces Analysis, 2014
Figure 30 Graphical Representation of the Porter Five Force Analysis, 2014
Figure 31 Threat of New Entrants
Figure 32 Threat of Substitutes
Figure 33 Bargaining Power of Suppliers
Figure 34 Bargaining Power of Buyers
Figure 35 Intensity of Competitive Rivalry
Figure 36 Market Size, By Technology, 2014 & 2020 ($Million)
Figure 37 Market Size, By Vertical, 2014 & 2020 ($Million)
Figure 38 F&B: Market Size, By MAP, 2013�2020, ($Million)
Figure 39 Automotive: Market Size, By Active Type,2013�2020 ($Million)
Figure 40 Automotive: Market Size, By Intelligent Type,2013�2020 ($Million)
Figure 41 Healthcare: Market Size, By MAP, 2013�2020 ($Million)
Figure 42 Personal Care: Market Size, By Active Type,2013�2020 ($Million)
Figure 43 Personal Care: Market Size, By Intelligent Type, 2013�2020 ($Million)
Figure 44 Others: Market, By Intelligent Type,2013�2020 ($Million)
Figure 45 Geographic Snapshot (2014) � Growing Economies are Emerging as New Hotspots
Figure 46 Americas Market Snapshot
Figure 47 Europe Market Snapshot
Figure 48 APAC Market Snapshot
Figure 49 RoW Market, By Country, 2014 & 2020 ($Million)
Figure 50 Companies Adopted Product Innovation as the Key Growth Strategy
Figure 51 Battle for Market Share: New Product Launches is the Key Strategy
Figure 52 Geographic Revenue Mix of Major Market Players in Market
Figure 53 3M: Company Snapshot
Figure 54 3M: SWOT Analysis
Figure 55 BASF SE: Company Snapshot
Figure 56 BASF SE: SWOT Analysis
Figure 57 E. I. Du Pont De Nemours and Company: Company Snapshot
Figure 58 E. I. Du Pont De Nemours and Company: SWOT Analysis
Figure 59 Meadwestvaco: Company Snapshot
Figure 60 Meadwestvaco Corporation: SWOT Analysis
Figure 61 Sealed Air Corporation: Company Snapshot
Figure 62 Sealed Air: SWOT Analysis
Figure 63 Amcor Limited: Company Snapshot
Figure 64 Avery Dennison Corp.: Company Snapshot
Figure 65 Huhtamaki Group: Company Snapshot
Figure 66 International Paper: Company Snapshot
Figure 67 RR Donnelley: Company Snapshot
Figure 68 Smartrac N.V.: Business Overview
Figure 69 Sonoco Products Company: Company Snapshot
Figure 70 Stora Enso OYJ: Company Snapshot
Figure 71 Thin Film Electronics ASA: Company Snapshot
Figure 72 UPM-Kymmene Corporation: Company Snapshot


Growth opportunities and latent adjacency in Smart Packaging Market