Steam Trap Market

Steam Trap Market by Mechanical (Ball Float, Inverted Bucket), Thermodynamic, Thermostatic (Balanced Pressure, Bimetallic), Application (Drip, Process, Tracing), Body Material (Steel, Iron), End-User Industry and Region - Global Forecast to 2028

Report Code: SE 5172 Aug, 2023, by marketsandmarkets.com

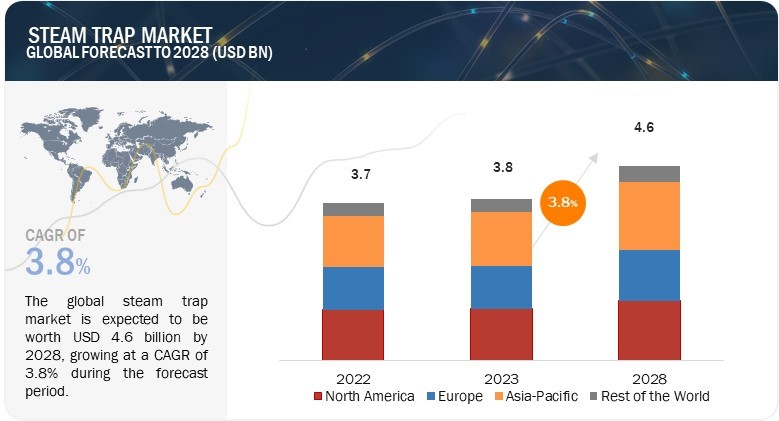
[183 Pages Report] The global steam trap market size is projected to grow from USD 3.8 billion in 2023 to USD 4.6 billion by 2028, at a CAGR of 3.8% during the forecast period. The market growth is driven by factors including the increasing demand for energy-efficient steam systems and rapid economic growth in emerging economies provinding opportunities for steam trap market. However, lack of awareness and benefits of steam trap systems are challenging the market growth.
Steam Trap Market

Steam Trap Market

Steam Trap Market Forecast to 2028

To know about the assumptions considered for the study, Request for Free Sample Report

Steam Trap Market Dynamics

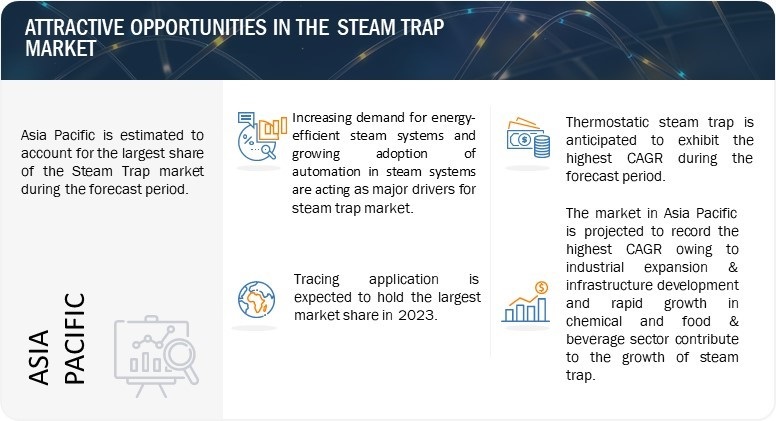
Driver: Increasing demand for energy-efficient steam systems

The demand for energy-efficient steam systems is rising as businesses actively seek ways to lower their energy costs. Steam traps play a vital role in achieving this objective by preventing the wasteful loss of live steam and minimizing the potential risk of water hammer. Live steam, a valuable resource generated by boilers for powering equipment and heating processes, holds significant importance for businesses, prompting them to ensure optimal utilization. In this regard, steam traps prove indispensable as they automatically discharge condensate and non-condensable gases from steam systems, effectively preventing the loss of live steam. This automated process improves steam system efficiency, thereby reducing energy consumption. Furthermore, steam traps go beyond their role in conserving live steam; they play a crucial part in ensuring the safety of steam systems. Swift and automatic discharge of condensate and non-condensable gases by steam traps effectively averts pressure build-up within the system, thereby mitigating the potential risk of explosions.

Restraint: High investments are required to implement steam trap systems

Investing in steam traps can be a substantial expense for businesses, primarily due to the high initial cost associated with their purchase and installation. The price of steam traps can vary significantly depending on various factors, such as the type of steam trap chosen, its size, and the materials used in its construction. One significant factor is the complexity of the steam trap design. More advanced and intricate steam trap models typically command higher prices due to the added engineering and precision required to deliver superior performance and efficiency. These sophisticated designs ensure optimal functionality, making them attractive for businesses seeking top-tier steam system management. Similarly, another contributing factor to the cost of steam traps is the choice of materials used in their construction. Steam traps made from premium materials like stainless steel generally come at a higher price than those crafted from more cost-effective materials like cast iron. The selection of materials directly impacts the trap’s durability and performance under varying conditions, making high-quality materials a desirable investment for businesses focused on long-term reliability and reduced maintenance costs.

Opportunity: Rapid economic growth in emerging economies

The rapid economic growth in emerging economies presents significant opportunities for the steam trap market. As these economies continue to expand and industrialize, there is a rising demand for energy, especially in manufacturing, power generation, and petrochemicals. Steam is a fundamental energy source used in various industrial processes, making steam traps essential for optimizing energy efficiency. As per the International Energy Agency (IEA), emerging markets and developing economies are expected to become the primary energy consumers of the future. The combined energy consumption of Brazil, China, India, Indonesia, Mexico, and South Africa already accounts for one-third of global energy usage, and this figure is projected to increase to 40% under current policy directions. In addition 2021, robust economic growth in countries such as India, Indonesia, and Saudi Arabia contributed to heightened energy consumption.

Challenge: Lack of awareness and benefits of steam trap systems

The lack of awareness is a significant challenge faced by the steam trap market, primarily because many businesses are unaware of the benefits of steam traps. They may need to grasp the proper selection and installation process fully. This can result in businesses making incorrect purchasing decisions, acquiring unsuitable steam traps, or improperly installing them. In addition, steam traps are less widely recognized than other energy-saving technologies, such as insulation or variable speed drives. This lack of visibility contributes to a limited understanding of steam traps’ advantages and potential impact on energy efficiency. Furthermore, the unawareness of steam trap systems leads to a lack of knowledge regarding maintenance and proper operation. Steam traps require periodic inspection, maintenance, and troubleshooting to ensure they function optimally. However, unaware of these requirements, businesses may neglect proper upkeep, leading to inefficient or malfunctioning steam traps. Ineffective steam traps can inadvertently release live steam, leading to higher energy costs and contributing to greenhouse gas emissions, exacerbating environmental challenges.

Steam Trap Market Ecosystem

This section describes the Steam Trap ecosystem, the deployment of steam trap solutions in different end-user industries, and the impact of associated technologies on the market.
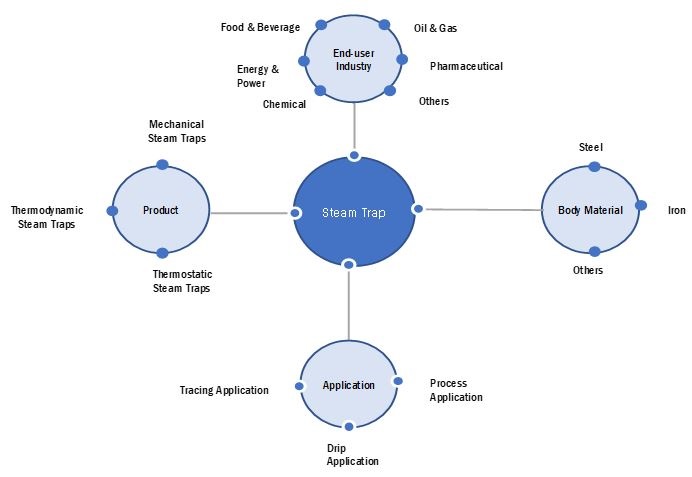
Steam Trap Market by Ecosystem

Mechanical steam trap Segment to hold the largest share of the steam trap market during 2023–2028

The mechanical steam trap segment is expected to account for the largest size of the steam trap market during the forecast period. Mechanical steam traps are a type of steam trap that operates based on mechanical principles rather than relying on external energy sources or complex control systems. They are known for their reliability, simplicity, and robustness, contributing to their popularity in various industrial applications. Furthermore, these steam traps are generally easier to install than more complex traps that may require additional infrastructure or control systems. This ease of installation can make them a preferred choice for retrofitting or upgrading existing systems.
Steel body material to dominate the steam trap market during the forecast period.

The steel body material segment is expected to account for the largest size of the steam trap market during the forecast period. Steel is rugged and robust, making it an excellent fit for steam traps that handle high temperatures and pressures without breaking. It’s also good at resisting rust and other types of damage, which helps the steam traps last a long time and need less fixing. Maintaining high levels of hygiene is paramount in industries like food & beverage and pharmaceutical. Steel’s non-porous surface is easy to clean and sterilize, ensuring compliance with stringent regulatory standards and safeguarding product purity. This is especially important in steam trap applications where cleanliness is essential to prevent contamination.

Oil & Gas end-user industry to dominate the market during the forecast period

The oil & gas end-user industry is expected to account for the largest share of the steam trap market during the forecast period. In the oil & gas industry, steam is utilized for various critical applications, including heating, distillation, separation, and power generation. Effective management of steam systems is paramount to ensure operational efficiency, cost-effectiveness, and safety within these industrial operations. Steam traps play a pivotal role in these contexts by efficiently removing condensate and preventing steam loss, which can significantly impact energy consumption and overall productivity. Moreover, the oil and gas industry operates under stringent regulatory frameworks and safety standards. The seamless functioning of steam systems is essential to comply with environmental regulations and safety protocols. In this context, steam traps ensure the proper functioning of steam distribution, minimizing the potential for leaks and energy waste that could lead to environmental hazards or operational disruptions.

The steam trap market in the Asia Pacific is expected to maintain the highest share during 2023–2028

Asia Pacific is expected to hold the largest share of the Steam trap market throughout the forecast period. The region is home to diverse industries, including manufacturing, petrochemicals, power generation, and more, all of which rely heavily on steam-based processes for their operations. As economies in this region continue to grow, the demand for efficient and sustainable steam systems becomes increasingly pronounced, creating a substantial market for steam traps. Furthermore, the Asia-Pacific region is experiencing significant urbanization and industrialization, leading to increased infrastructure development and expansion. As new industrial facilities are established, and existing ones undergo modernization, the demand for advanced steam trap technologies to enhance energy efficiency, reduce operational costs, and meet stringent environmental regulations is rising.
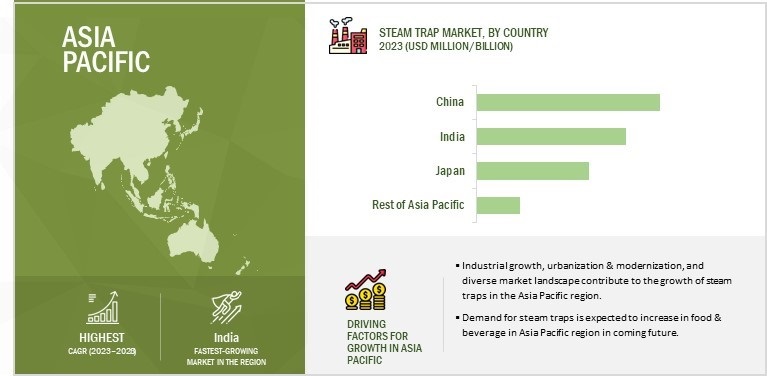
Steam Trap Market by Region

Steam Trap Market by Region

To know about the assumptions considered for the study, download the pdf brochure

Key Market Players

The steam trap companies have implemented various types of organic and inorganic growth strategies, such as product launches, product developments, partnerships, and collaborations, to strengthen their offerings in the market. The major players are Spirax-Sarco Engineering plc (UK), Emerson Electric Co. (US), Schlumberger Limited (US), Thermax Limited (India), Velan Inc. (Canada), Watts Water Technologies, Inc. (US), Armstrong International Inc. (US), TLV CO., LTD. (Japan), Forbes Marshall (India), and Xylem Inc. (US). The study includes an in-depth competitive analysis of these key players in the steam trap market with their company profiles, recent developments, and key market strategies.

Get online access to the report on the World's First Market Intelligence Cloud

  • Easy to Download Historical Data & Forecast Numbers
  • Company Analysis Dashboard for high growth potential opportunities
  • Research Analyst Access for customization & queries
  • Competitor Analysis with Interactive dashboard
  • Latest News, Updates & Trend analysis
Request Sample

Scope of the Report

Report Metric

Details

Market size available for years

2019—2028

Base year

2022

Forecast period

2023—2028

Units

Value (USD Million/Billion)

Segments Covered

Product, Application, Body Material, End-User Industry, and Region

Geographic regions covered

North America, Europe, Asia Pacific, and Rest of the World

Companies covered

Key players in the steam trap market are Spirax-Sarco Engineering plc (UK), Emerson Electric Co. (US), Schlumberger Limited (US), Thermax Limited (India), Velan Inc. (Canada), Watts Water Technologies, Inc. (US), Armstrong International Inc. (US), TLV CO., LTD. (Japan), Forbes Marshall (India), and Xylem Inc. (US) are some of the key players in steam trap market.—a total of 25 companies.

Steam Trap Market Highlights

This report categorizes the steam trap market based on product, application, body material, end-user industry, and region.

Segment

Subsegment

By Product:

  • Mechanical
  • Thermodynamics
  • Thermostatic

By Application:

  • Tracing Application
  • Drip Application
  • Process Application

By Body Material:

  • Steel
  • Iron
  • Others

By End-User Industry:

  • Chemicals
  • Energy & Power
  • Food & Beverages
  • Oil & Gas
  • Pharmaceuticals
  • Others

By Region:

  • North America
    • US
    • Canada
    • Mexico
  • Europe
    • UK
    • Germany
    • France
    • Rest of Europe
  • Asia Pacific
    • China
    • Japan
    • India
    • Rest of Asia Pacific
  • Rest of the World
    • Middle East & Africa
    • South America

Recent Developments

  • In September 2022, TLV CO., LTD., a specialist in steam technology, introduced the FJ32 series of free-float steam traps. These steam traps are designed for various process applications, including jacketed pans, heat exchangers, and vulcanizers. These steam traps incorporate the QuickTrap connection, a universal feature that enables convenient, secure, and efficient removal, repair, and reuse.
  • In January 2022, Spirax-Sarco Engineering plc acquired Cotopaxi Limited (UK), a digital energy optimization specialist, for USD 18 million. This move strengthens Spirax-Sarco’s Steam Specialties business, focusing on efficient steam solutions. Cotopaxi’s digital expertise will enhance steam system efficiency and waste reduction, benefiting from Steam Specialties’ global sales reach in 67 countries.
  • In September 2019, Emerson Electric Co. acquired the Spence and Nicholson product lines from Circor International, Inc. (US), an industrial valve manufacturing company. This acquisition strengthens Emerson’s steam system solutions for process industries and commercial buildings. The Spence and Nicholson lines are established industry-leading products that include steam regulators, control valves, safety relief valves, temperature regulators, steam traps, and other steam accessories and solutions.
  • In December 2018, Spirax Sarco Engineering plc unveiled the FT23 series of float and thermostatic steam traps. This comprehensive lineup features the FTC23 model, which boasts a robust carbon steel body and a stainless steel cover. Additionally, the FTS23 variant presents a stainless steel body adorned with a stainless steel cover.

Critical Questions:

To speak to our analyst for a discussion on the above findings, click Speak to Analyst

TABLE OF CONTENTS
 
1 INTRODUCTION (Page No. - 26)
    1.1 STUDY OBJECTIVES 
    1.2 MARKET DEFINITION 
    1.3 STUDY SCOPE 
           1.3.1 MARKETS COVERED
                    FIGURE 1 STEAM TRAP MARKET: SEGMENTATION
           1.3.2 INCLUSIONS AND EXCLUSIONS
           1.3.3 GEOGRAPHICAL SCOPE
           1.3.4 YEARS CONSIDERED
    1.4 CURRENCY CONSIDERED 
    1.5 LIMITATIONS 
    1.6 STAKEHOLDERS 
    1.7 SUMMARY OF CHANGES 
    1.8 RECESSION IMPACT 
 
2 RESEARCH METHODOLOGY (Page No. - 31)
    2.1 RESEARCH DATA 
           FIGURE 2 STEAM TRAP MARKET: RESEARCH DESIGN
           2.1.1 SECONDARY AND PRIMARY RESEARCH
                    FIGURE 3 SECONDARY AND PRIMARY RESEARCH
           2.1.2 SECONDARY DATA
                    2.1.2.1 List of secondary sources
                    2.1.2.2 Key data from secondary sources
           2.1.3 PRIMARY DATA
                    2.1.3.1 Primary interviews with experts
                    2.1.3.2 Key data from primary sources
                    2.1.3.3 Key industry insights
                    2.1.3.4 Breakdown of primaries
    2.2 MARKET SIZE ESTIMATION 
           2.2.1 BOTTOM-UP APPROACH
                    2.2.1.1 Approach to derive market share by bottom-up analysis (Demand side)
                               FIGURE 4 BOTTOM-UP APPROACH
           2.2.2 TOP-DOWN APPROACH
                    2.2.2.1 Approach to derive market share by top-down analysis (Supply side)
                               FIGURE 5 TOP-DOWN APPROACH
                               FIGURE 6 MARKET SIZE ESTIMATION METHODOLOGY: (DEMAND SIDE) REVENUE GENERATED BY COMPANIES IN STEAM TRAP MARKET
    2.3 MARKET BREAKDOWN AND DATA TRIANGULATION 
           FIGURE 7 DATA TRIANGULATION
    2.4 RESEARCH ASSUMPTIONS 
    2.5 PARAMETERS CONSIDERED TO ANALYZE IMPACT OF RECESSION ON STEAM TRAP MARKET 
    2.6 RISK ASSESSMENT 
           TABLE 1 STEAM TRAP MARKET: RISK ASSESSMENT
 
3 EXECUTIVE SUMMARY (Page No. - 43)
    FIGURE 8 MECHANICAL SEGMENT TO HOLD LARGEST SIZE OF STEAM TRAP MARKET DURING FORECAST PERIOD
    FIGURE 9 TRACING APPLICATION SEGMENT TO REGISTER HIGHEST CAGR IN MARKET DURING FORECAST PERIOD
    FIGURE 10 STEEL SEGMENT TO DOMINATE STEAM TRAP MARKET DURING FORECAST PERIOD
    FIGURE 11 OIL & GAS INDUSTRY TO CAPTURE LARGEST SHARE OF STEAM TRAP MARKET DURING FORECAST PERIOD
    FIGURE 12 ASIA PACIFIC ACCOUNTED FOR LARGEST MARKET SHARE IN 2022
 
4 PREMIUM INSIGHTS (Page No. - 48)
    4.1 ATTRACTIVE OPPORTUNITIES FOR PLAYERS IN STEAM TRAP MARKET 
           FIGURE 13 GROWING ADOPTION OF STEAM TRAPS IN FOOD & BEVERAGES AND PHARMACEUTICALS INDUSTRIES TO PROVIDE OPPORTUNITIES FOR PLAYERS IN STEAM TRAP MARKET
    4.2 STEAM TRAP MARKET, BY PRODUCT 
           FIGURE 14 MECHANICAL SEGMENT TO HOLD LARGEST MARKET SHARE OF STEAM TRAP MARKET IN 2023
    4.3 STEAM TRAP MARKET, BY APPLICATION 
           FIGURE 15 TRACING APPLICATION SEGMENT TO HOLD LARGEST MARKET SHARE DURING FORECAST PERIOD
    4.4 STEAM TRAP MARKET, BY BODY MATERIAL 
           FIGURE 16 STEEL SEGMENT TO REGISTER HIGHEST CAGR DURING 2023–2028
    4.5 STEAM TRAP MARKET, BY END-USER INDUSTRY 
           FIGURE 17 OIL & GAS SEGMENT TO HOLD LARGEST SHARE OF STEAM TRAP MARKET IN 2023
    4.6 STEAM TRAP MARKET, BY COUNTRY 
           FIGURE 18 INDIA TO BE FASTEST-GROWING STEAM TRAP MARKET DURING FORECAST PERIOD
 
5 MARKET OVERVIEW (Page No. - 51)
    5.1 INTRODUCTION 
    5.2 MARKET DYNAMICS 
           FIGURE 19 STEAM TRAP MARKET: DRIVERS, RESTRAINTS, OPPORTUNITIES, AND CHALLENGES
           5.2.1 DRIVERS
                    5.2.1.1 Increasing demand for energy-efficient steam systems
                    5.2.1.2 Growing adoption of automation in steam systems
                    5.2.1.3 Need to enhance manufacturing efficiency and reduce greenhouse gas emissions
                               FIGURE 20 STEAM TRAP MARKET: IMPACT OF DRIVERS
           5.2.2 RESTRAINTS
                    5.2.2.1 Need for substantial upfront investment
                    5.2.2.2 Need for periodic maintenance and complexities associated with operations of steam trap systems
                               FIGURE 21 STEAM TRAP MARKET: IMPACT OF RESTRAINTS
           5.2.3 OPPORTUNITIES
                    5.2.3.1 Rapid economic growth in emerging economies
                    5.2.3.2 Integration of steam traps with IoT sensors
                               FIGURE 22 STEAM TRAP MARKET: IMPACT OF OPPORTUNITIES
           5.2.4 CHALLENGES
                    5.2.4.1 Lack of awareness about benefits of steam trap systems
                               FIGURE 23 STEAM TRAP MARKET: IMPACT OF CHALLENGES
    5.3 VALUE CHAIN ANALYSIS 
           FIGURE 24 STEAM TRAP MARKET: VALUE CHAIN ANALYSIS
    5.4 ECOSYSTEM MAPPING 
           FIGURE 25 STEAM TRAP MARKET: ECOSYSTEM
           TABLE 2 STEAM TRAP MARKET: ROLE OF KEY PLAYERS IN ECOSYSTEM
    5.5 TRENDS/DISRUPTIONS IMPACTING CUSTOMER BUSINESS 
           FIGURE 26 REVENUE SHIFTS AND NEW REVENUE POCKETS FOR PLAYERS IN STEAM TRAP MARKET
    5.6 TECHNOLOGY ANALYSIS 
           5.6.1 PREDICTIVE MAINTENANCE
           5.6.2 DIGITALIZATION AND ARTIFICIAL INTELLIGENCE
 
6 STEAM TRAP MARKET, BY PRODUCT (Page No. - 63)
    6.1 INTRODUCTION 
           TABLE 3 STEAM TRAP MARKET, IN TERMS OF VALUE AND VOLUME, 2019–2022
           TABLE 4 STEAM TRAP MARKET, IN TERMS OF VALUE AND VOLUME, 2023–2028
           TABLE 5 STEAM TRAP MARKET, BY PRODUCT, 2019–2022 (USD MILLION)
           TABLE 6 STEAM TRAP MARKET, BY PRODUCT, 2023–2028 (USD MILLION)
           FIGURE 27 STEAM TRAP MARKET, BY PRODUCT
           FIGURE 28 MECHANICAL SEGMENT TO COMMAND LARGEST SHARE OF STEAM TRAP MARKET BETWEEN 2023 AND 2028
    6.2 MECHANICAL 
           6.2.1 LOW MAINTENANCE REQUIREMENTS TO DRIVE DEMAND FOR MECHANICAL STEAM TRAPS
                    TABLE 7 STEAM TRAP MARKET, BY MECHANICAL PRODUCT TYPE, 2019–2022 (USD MILLION)
                    TABLE 8 STEAM TRAP MARKET, BY MECHANICAL PRODUCT TYPE, 2023–2028 (USD MILLION)
                    TABLE 9 MECHANICAL: STEAM TRAP MARKET, BY BODY MATERIAL, 2019–2022 (USD MILLION)
                    TABLE 10 MECHANICAL: STEAM TRAP MARKET, BY BODY MATERIAL, 2023–2028 (USD MILLION)
                    TABLE 11 BALL FLOAT: STEAM TRAP MARKET, BY BODY MATERIAL, 2019–2022 (USD MILLION)
                    TABLE 12 BALL FLOAT: STEAM TRAP MARKET, BY BODY MATERIAL, 2023–2028 (USD MILLION)
                    TABLE 13 INVERTED BUCKET: STEAM TRAP MARKET, BY BODY MATERIAL, 2019–2022 (USD MILLION)
                    TABLE 14 INVERTED BUCKET: STEAM TRAP MARKET, BY BODY MATERIAL, 2023–2028 (USD MILLION)
    6.3 THERMODYNAMIC 
           6.3.1 ABILITY TO OPERATE IN HIGH PRESSURE AND TEMPERATURE TO BOOST DEMAND FOR THERMODYNAMIC STEAM TRAPS
                    TABLE 15 THERMODYNAMIC: STEAM TRAP MARKET, BY BODY MATERIAL, 2019–2022 (USD MILLION)
                    TABLE 16 THERMODYNAMIC: STEAM TRAP MARKET, BY BODY MATERIAL, 2023–2028 (USD MILLION)
    6.4 THERMOSTATIC 
           6.4.1 SUITABILITY FOR WIDE RANGE OF APPLICATIONS TO BOOST DEMAND FOR THERMOSTATIC STEAM TRAPS
                    TABLE 17 STEAM TRAP MARKET, BY THERMOSTATIC PRODUCT TYPE, 2019–2022 (USD MILLION)
                    TABLE 18 STEAM TRAP MARKET, BY THERMOSTATIC PRODUCT TYPE, 2023–2028 (USD MILLION)
                    TABLE 19 THERMOSTATIC: STEAM TRAP MARKET, BY BODY MATERIAL, 2019–2022 (USD MILLION)
                    TABLE 20 THERMOSTATIC: STEAM TRAP MARKET, BY BODY MATERIAL, 2023–2028 (USD MILLION)
                    TABLE 21 BALANCED PRESSURE: STEAM TRAP MARKET, BY BODY MATERIAL, 2019–2022 (USD MILLION)
                    TABLE 22 BALANCED PRESSURE: STEAM TRAP MARKET, BY BODY MATERIAL, 2023–2028 (USD MILLION)
                    TABLE 23 BIMETALLIC: STEAM TRAP MARKET, BY BODY MATERIAL, 2019–2022 (USD MILLION)
                    TABLE 24 BIMETALLIC: STEAM TRAP MARKET, BY BODY MATERIAL, 2023–2028 (USD MILLION)
 
7 STEAM TRAP MARKET, BY APPLICATION (Page No. - 74)
    7.1 INTRODUCTION 
           TABLE 25 STEAM TRAP MARKET, BY APPLICATION, 2019–2022 (USD MILLION)
           TABLE 26 STEAM TRAP MARKET, BY APPLICATION, 2023–2028 (USD MILLION)
           FIGURE 29 STEAM TRAP MARKET, BY APPLICATION
           FIGURE 30 TRACING APPLICATION TO LEAD STEAM TRAP MARKET FROM 2023 TO 2028
    7.2 TRACING APPLICATION 
           7.2.1 DURABILITY AND CORROSION RESISTANCE FEATURES MAKE THERMOSTATIC STEAM TRAPS SUITABLE FOR TRACING APPLICATIONS
                    TABLE 27 TRACING APPLICATION: STEAM TRAP MARKET, BY END-USER INDUSTRY, 2019–2022 (USD MILLION)
                    TABLE 28 TRACING APPLICATION: STEAM TRAP MARKET, BY END-USER INDUSTRY, 2023–2028 (USD MILLION)
    7.3 DRIP APPLICATION 
           7.3.1 THERMODYNAMIC STEAM TRAPS IDEAL FOR DRIP APPLICATIONS
                    TABLE 29 DRIP APPLICATION: STEAM TRAP MARKET, BY END-USER INDUSTRY, 2019–2022 (USD MILLION)
                    TABLE 30 DRIP APPLICATION: STEAM TRAP MARKET, BY END-USER INDUSTRY, 2023–2028 (USD MILLION)
    7.4 PROCESS APPLICATION 
           7.4.1 REQUIRES STEAM TRAPS WITH LARGER CONDENSATE HANDLING CAPACITY
                    TABLE 31 PROCESS APPLICATION: STEAM TRAP MARKET, BY END-USER INDUSTRY, 2019–2022 (USD MILLION)
                    TABLE 32 PROCESS APPLICATION: STEAM TRAP MARKET, BY END-USER INDUSTRY, 2023–2028 (USD MILLION)
 
8 STEAM TRAP MARKET, BY BODY MATERIAL (Page No. - 81)
    8.1 INTRODUCTION 
           TABLE 33 STEAM TRAP MARKET, BY BODY MATERIAL, 2019–2022 (USD MILLION)
           TABLE 34 STEAM TRAP MARKET, BY BODY MATERIAL, 2023–2028 (USD MILLION)
           FIGURE 31 STEAM TRAP MARKET, BY BODY MATERIAL
           FIGURE 32 STEEL SEGMENT TO REGISTER HIGHEST CAGR BETWEEN 2023 AND 2028
    8.2 STEEL 
           8.2.1 DURABILITY AND FLEXIBILITY OF STEEL STEAM TRAPS MAKE THEM SUITABLE FOR APPLICATIONS IN DIFFERENT INDUSTRIES
    8.3 IRON 
           8.3.1 IRON STEAM TRAPS COMMONLY USED IN LOW- AND MEDIUM-PRESSURE STEAM SYSTEMS
    8.4 OTHERS 
 
9 STEAM TRAP MARKET, BY END-USER INDUSTRY (Page No. - 85)
    9.1 INTRODUCTION 
           TABLE 35 STEAM TRAP MARKET, BY END-USER INDUSTRY, 2019–2022 (USD MILLION)
           TABLE 36 STEAM TRAP MARKET, BY END-USER INDUSTRY, 2023–2028 (USD MILLION)
           FIGURE 33 OIL & GAS SEGMENT TO LEAD STEAM TRAP MARKET BETWEEN 2023 AND 2028
    9.2 CHEMICALS 
           9.2.1 HIGH DEPENDENCY ON STEAM FOR PROCESS APPLICATIONS TO CREATE DEMAND FOR STEAM TRAPS
                    TABLE 37 CHEMICALS: STEAM TRAP MARKET, BY REGION, 2019–2022 (USD MILLION)
                    TABLE 38 CHEMICALS: STEAM TRAP MARKET, BY REGION, 2023–2028 (USD MILLION)
                    TABLE 39 CHEMICALS: STEAM TRAP MARKET, BY PRODUCT, 2019–2022 (USD MILLION)
                    TABLE 40 CHEMICALS: STEAM TRAP MARKET, BY PRODUCT, 2023–2028 (USD MILLION)
                    TABLE 41 CHEMICALS: STEAM TRAP MARKET, BY MECHANICAL PRODUCT TYPE, 2019–2022 (USD MILLION)
                    TABLE 42 CHEMICALS: STEAM TRAP MARKET, BY MECHANICAL PRODUCT TYPE, 2023–2028 (USD MILLION)
                    TABLE 43 CHEMICALS: STEAM TRAP MARKET, BY THERMOSTATIC PRODUCT TYPE, 2019–2022 (USD MILLION)
                    TABLE 44 CHEMICALS: STEAM TRAP MARKET, BY THERMOSTATIC PRODUCT TYPE, 2023–2028 (USD MILLION)
                    TABLE 45 CHEMICALS: STEAM TRAP MARKET, BY APPLICATION, 2019–2022 (USD MILLION)
                    TABLE 46 CHEMICALS: STEAM TRAP MARKET, BY APPLICATION, 2023–2028 (USD MILLION)
    9.3 ENERGY & POWER 
           9.3.1 INCREASING FOCUS ON ENERGY MANAGEMENT TO BOOST DEMAND FOR STEAM TRAPS
                    TABLE 47 ENERGY & POWER: STEAM TRAP MARKET, BY REGION, 2019–2022 (USD MILLION)
                    TABLE 48 ENERGY & POWER: STEAM TRAP MARKET, BY REGION, 2023–2028 (USD MILLION)
                    TABLE 49 ENERGY & POWER: STEAM TRAP MARKET, BY PRODUCT, 2019–2022 (USD MILLION)
                    TABLE 50 ENERGY & POWER: STEAM TRAP MARKET, BY PRODUCT, 2023–2028 (USD MILLION)
                    TABLE 51 ENERGY & POWER: STEAM TRAP MARKET, BY MECHANICAL PRODUCT TYPE, 2019–2022 (USD MILLION)
                    TABLE 52 ENERGY & POWER: STEAM TRAP MARKET, BY MECHANICAL PRODUCT TYPE, 2023–2028 (USD MILLION)
                    TABLE 53 ENERGY & POWER: STEAM TRAP MARKET, BY THERMOSTATIC PRODUCT TYPE, 2019–2022 (USD MILLION)
                    TABLE 54 ENERGY & POWER: STEAM TRAP MARKET, BY THERMOSTATIC PRODUCT TYPE, 2023–2028 (USD MILLION)
                    TABLE 55 ENERGY & POWER: STEAM TRAP MARKET, BY APPLICATION, 2019–2022 (USD MILLION)
                    TABLE 56 ENERGY & POWER: STEAM TRAP MARKET, BY APPLICATION, 2023–2028 (USD MILLION)
    9.4 FOOD & BEVERAGES 
           9.4.1 NEED TO IMPROVE PROCESS EFFICIENCY TO DRIVE ADOPTION OF STEAM TRAPS
                    TABLE 57 FOOD & BEVERAGES: STEAM TRAP MARKET, BY REGION, 2019–2022 (USD MILLION)
                    TABLE 58 FOOD & BEVERAGES: STEAM TRAP MARKET, BY REGION, 2023–2028 (USD MILLION)
                    TABLE 59 FOOD & BEVERAGES: STEAM TRAP MARKET, BY PRODUCT, 2019–2022 (USD MILLION)
                    TABLE 60 FOOD & BEVERAGES: STEAM TRAP MARKET, BY PRODUCT, 2023–2028 (USD MILLION)
                    TABLE 61 FOOD & BEVERAGES: STEAM TRAP MARKET, BY MECHANICAL PRODUCT TYPE, 2019–2022 (USD MILLION)
                    TABLE 62 FOOD & BEVERAGES: STEAM TRAP MARKET, BY MECHANICAL PRODUCT TYPE, 2023–2028 (USD MILLION)
                    TABLE 63 FOOD & BEVERAGES: STEAM TRAP MARKET, BY THERMOSTATIC PRODUCT TYPE, 2019–2022 (USD MILLION)
                    TABLE 64 FOOD & BEVERAGES: STEAM TRAP MARKET, BY THERMOSTATIC PRODUCT TYPE, 2023–2028 (USD MILLION)
                    TABLE 65 FOOD & BEVERAGES: STEAM TRAP MARKET, BY APPLICATION, 2019–2022 (USD MILLION)
                    TABLE 66 FOOD & BEVERAGES: STEAM TRAP MARKET, BY APPLICATION, 2023–2028 (USD MILLION)
    9.5 OIL & GAS 
           9.5.1 STEADY RECOVERY OF OIL & GAS INDUSTRY TO GENERATE DEMAND FOR STEAM TRAPS
                    TABLE 67 OIL & GAS: STEAM TRAP MARKET, BY REGION, 2019–2022 (USD MILLION)
                    TABLE 68 OIL & GAS: STEAM TRAP MARKET, BY REGION, 2023–2028 (USD MILLION)
                    TABLE 69 OIL & GAS: STEAM TRAP MARKET, BY PRODUCT, 2019–2022 (USD MILLION)
                    TABLE 70 OIL & GAS: STEAM TRAP MARKET, BY PRODUCT, 2023–2028 (USD MILLION)
                    TABLE 71 OIL & GAS: STEAM TRAP MARKET, BY MECHANICAL PRODUCT TYPE, 2019–2022 (USD MILLION)
                    TABLE 72 OIL & GAS: STEAM TRAP MARKET, BY MECHANICAL PRODUCT TYPE, 2023–2028 (USD MILLION)
                    TABLE 73 OIL & GAS: STEAM TRAP MARKET, BY THERMOSTATIC PRODUCT TYPE, 2019–2022 (USD MILLION)
                    TABLE 74 OIL & GAS: STEAM TRAP MARKET, BY THERMOSTATIC PRODUCT TYPE, 2023–2028 (USD MILLION)
                    TABLE 75 OIL & GAS: STEAM TRAP MARKET, BY APPLICATION, 2019–2022 (USD MILLION)
                    TABLE 76 OIL & GAS: STEAM TRAP MARKET, BY APPLICATION, 2023–2028 (USD MILLION)
    9.6 PHARMACEUTICALS 
           9.6.1 NEED TO ENSURE COMPLIANCE WITH STRINGENT REGULATIONS TO INCREASE DEMAND FOR STEAM TRAPS
                    TABLE 77 PHARMACEUTICALS: STEAM TRAP MARKET, BY REGION, 2019–2022 (USD MILLION)
                    TABLE 78 PHARMACEUTICALS: STEAM TRAP MARKET, BY REGION, 2023–2028 (USD MILLION)
                    TABLE 79 PHARMACEUTICALS: STEAM TRAP MARKET, BY PRODUCT, 2019–2022 (USD MILLION)
                    TABLE 80 PHARMACEUTICALS: STEAM TRAP MARKET, BY PRODUCT, 2023–2028 (USD MILLION)
                    TABLE 81 PHARMACEUTICALS: STEAM TRAP MARKET, BY MECHANICAL PRODUCT TYPE, 2019–2022 (USD MILLION)
                    TABLE 82 PHARMACEUTICALS: STEAM TRAP MARKET, BY MECHANICAL PRODUCT TYPE, 2023–2028 (USD MILLION)
                    TABLE 83 PHARMACEUTICALS: STEAM TRAP MARKET, BY THERMOSTATIC PRODUCT TYPE, 2019–2022 (USD MILLION)
                    TABLE 84 PHARMACEUTICALS: STEAM TRAP MARKET, BY THERMOSTATIC PRODUCT TYPE, 2023–2028 (USD MILLION)
                    TABLE 85 PHARMACEUTICALS: STEAM TRAP MARKET, BY APPLICATION, 2019–2022 (USD MILLION)
                    TABLE 86 PHARMACEUTICALS: STEAM TRAP MARKET, BY APPLICATION, 2023–2028 (USD MILLION)
    9.7 OTHERS 
           TABLE 87 OTHERS: STEAM TRAP MARKET, BY REGION, 2019–2022 (USD MILLION)
           TABLE 88 OTHERS: STEAM TRAP MARKET, BY REGION, 2023–2028 (USD MILLION)
           TABLE 89 OTHERS: STEAM TRAP MARKET, BY PRODUCT, 2019–2022 (USD MILLION)
           TABLE 90 OTHERS: STEAM TRAP MARKET, BY PRODUCT, 2023–2028 (USD MILLION)
           TABLE 91 OTHERS: STEAM TRAP MARKET, BY MECHANICAL PRODUCT TYPE, 2019–2022 (USD MILLION)
           TABLE 92 OTHERS: STEAM TRAP MARKET, BY MECHANICAL PRODUCT TYPE, 2023–2028 (USD MILLION)
           TABLE 93 OTHERS: STEAM TRAP MARKET, BY THERMOSTATIC PRODUCT TYPE, 2019–2022 (USD MILLION)
           TABLE 94 OTHERS: STEAM TRAP MARKET, BY THERMOSTATIC PRODUCT TYPE, 2023–2028 (USD MILLION)
           TABLE 95 OTHERS: STEAM TRAP MARKET, BY APPLICATION, 2019–2022 (USD MILLION)
           TABLE 96 OTHERS: STEAM TRAP MARKET, BY APPLICATION, 2023–2028 (USD MILLION)
 
10 STEAM TRAP MARKET, BY REGION (Page No. - 106)
     10.1 INTRODUCTION 
             FIGURE 34 INDIA TO REGISTER HIGHEST CAGR IN OVERALL STEAM TRAP MARKET DURING FORECAST PERIOD
             FIGURE 35 ASIA PACIFIC TO ACCOUNT FOR LARGEST SHARE OF GLOBAL STEAM TRAP MARKET DURING FORECAST PERIOD
             TABLE 97 STEAM TRAP MARKET, BY REGION, 2019–2022 (USD MILLION)
             TABLE 98 STEAM TRAP MARKET, BY REGION, 2023–2028 (USD MILLION)
     10.2 NORTH AMERICA 
             10.2.1 NORTH AMERICA: RECESSION IMPACT
                        FIGURE 36 NORTH AMERICA: STEAM TRAP MARKET SNAPSHOT
                        TABLE 99 NORTH AMERICA: STEAM TRAP MARKET, BY COUNTRY, 2019–2022 (USD MILLION)
                        TABLE 100 NORTH AMERICA: STEAM TRAP MARKET, BY COUNTRY, 2023–2028 (USD MILLION)
                        TABLE 101 NORTH AMERICA: STEAM TRAP MARKET, BY END-USER INDUSTRY, 2019–2022 (USD MILLION)
                        TABLE 102 NORTH AMERICA: STEAM TRAP MARKET, BY END-USER INDUSTRY, 2023–2028 (USD MILLION)
             10.2.2 US
                        10.2.2.1 Rising adoption of steam traps in oil & gas sector to contribute to market growth
             10.2.3 CANADA
                        10.2.3.1 Growing emphasis on reducing energy usage to propel market growth
             10.2.4 MEXICO
                        10.2.4.1 Pursuit of achieving high operational efficiency in various industries to boost market growth
     10.3 EUROPE 
             10.3.1 EUROPE: RECESSION IMPACT
                        FIGURE 37 EUROPE: STEAM TRAP MARKET SNAPSHOT
                        TABLE 103 EUROPE: STEAM TRAP MARKET, BY COUNTRY, 2019–2022 (USD MILLION)
                        TABLE 104 EUROPE: STEAM TRAP MARKET, BY COUNTRY, 2023–2028 (USD MILLION)
                        TABLE 105 EUROPE: STEAM TRAP MARKET, BY END-USER INDUSTRY, 2019–2022, (USD MILLION)
                        TABLE 106 EUROPE: STEAM TRAP MARKET, BY END-USER INDUSTRY, 2023–2028 (USD MILLION)
             10.3.2 GERMANY
                        10.3.2.1 Rising adoption of steam traps by process industries to stimulate market growth
             10.3.3 UK
                        10.3.3.1 Rapid expansion of industrial sector and surging demand from oil & gas sector to support market growth
             10.3.4 FRANCE
                        10.3.4.1 Chemicals and food & beverages industries to propel demand for steam traps
             10.3.5 REST OF EUROPE
     10.4 ASIA PACIFIC 
             10.4.1 ASIA PACIFIC: RECESSION IMPACT
                        FIGURE 38 ASIA PACIFIC: STEAM TRAP MARKET SNAPSHOT
                        TABLE 107 ASIA PACIFIC: STEAM TRAP MARKET, BY COUNTRY, 2019–2022 (USD MILLION)
                        TABLE 108 ASIA PACIFIC: STEAM TRAP MARKET, BY COUNTRY, 2023–2028 (USD MILLION)
                        TABLE 109 ASIA PACIFIC: STEAM TRAP MARKET, BY END-USER INDUSTRY, 2019–2022 (USD MILLION)
                        TABLE 110 ASIA PACIFIC: STEAM TRAP MARKET, BY END-USER INDUSTRY, 2023–2028 (USD MILLION)
             10.4.2 CHINA
                        10.4.2.1 Government initiatives to promote energy efficiency to create demand for steam traps
             10.4.3 INDIA
                        10.4.3.1 Rapid industrialization and commitment to energy efficiency to drive market
             10.4.4 JAPAN
                        10.4.4.1 Increasing focus on enhancing production capabilities and overall operational efficiency to boost requirement for steam traps
             10.4.5 REST OF ASIA PACIFIC
     10.5 REST OF THE WORLD (ROW) 
             10.5.1 REST OF THE WORLD: IMPACT OF RECESSION
                        TABLE 111 REST OF THE WORLD: STEAM TRAP MARKET, BY END-USER INDUSTRY, 2019–2022 (USD MILLION)
                        TABLE 112 REST OF THE WORLD: STEAM TRAP MARKET, BY END-USER INDUSTRY, 2023–2028, (USD MILLION)
                        TABLE 113 REST OF THE WORLD: STEAM TRAP MARKET, BY REGION, 2019–2022 (USD MILLION)
                        TABLE 114 REST OF THE WORLD: STEAM TRAP MARKET, BY REGION, 2023–2028 (USD MILLION)
             10.5.2 AFRICA
                        10.5.2.1 High demand from oil & gas and mining industries to boost market growth
             10.5.3 MIDDLE EAST
                        10.5.3.1 Booming oil & gas industry to increase demand for steam traps
             10.5.4 SOUTH AMERICA
                        10.5.4.1 Thriving mining industry to contribute to market growth
 
11 COMPETITIVE LANDSCAPE (Page No. - 127)
     11.1 OVERVIEW 
     11.2 MARKET SHARE ANALYSIS, 2022 
             TABLE 115 STEAM TRAP MARKET: DEGREE OF COMPETITION
             FIGURE 39 MARKET SHARE ANALYSIS, 2022
     11.3 EVALUATION MATRIX OF KEY COMPANIES, 2022 
             11.3.1 STARS
             11.3.2 EMERGING LEADERS
             11.3.3 PERVASIVE PLAYERS
             11.3.4 PARTICIPANTS
                        FIGURE 40 STEAM TRAP MARKET: EVALUATION MATRIX OF KEY COMPANIES, 2022
     11.4 COMPETITIVE SCENARIOS AND TRENDS 
             11.4.1 PRODUCT LAUNCHES AND DEVELOPMENTS
                        TABLE 116 STEAM TRAP MARKET: PRODUCT LAUNCHES AND DEVELOPMENTS, 2018–2022
             11.4.2 DEALS
                        TABLE 117 STEAM TRAP MARKET: DEALS, 2019–2023
 
12 COMPANY PROFILES (Page No. - 133)
(Business overview, Products/Solutions/Services offered, Recent Developments, MNM view)*  
     12.1 KEY PLAYERS 
             12.1.1 SPIRAX-SARCO ENGINEERING PLC
                        TABLE 118 SPIRAX-SARCO ENGINEERING PLC: COMPANY OVERVIEW
                        FIGURE 41 SPIRAX-SARCO ENGINEERING PLC: COMPANY SNAPSHOT
                        TABLE 119 SPIRAX-SARCO ENGINEERING PLC: PRODUCTS/SOLUTIONS/SERVICES OFFERED
                        TABLE 120 SPIRAX-SARCO ENGINEERING PLC: PRODUCT LAUNCHES
                        TABLE 121 SPIRAX-SARCO ENGINEERING PLC: DEALS
             12.1.2 EMERSON ELECTRIC CO.
                        TABLE 122 EMERSON ELECTRIC CO.: COMPANY OVERVIEW
                        FIGURE 42 EMERSON ELECTRIC CO.: COMPANY SNAPSHOT
                        TABLE 123 EMERSON ELECTRIC CO.: PRODUCTS/SOLUTIONS/SERVICES OFFERED
                        TABLE 124 EMERSON ELECTRIC CO.: DEALS
             12.1.3 THERMAX LIMITED
                        TABLE 125 THERMAX LIMITED: COMPANY OVERVIEW
                        FIGURE 43 THERMAX LIMITED: COMPANY SNAPSHOT
                        TABLE 126 THERMAX LIMITED: PRODUCTS/SOLUTIONS/SERVICES OFFERED
             12.1.4 SCHLUMBERGER LIMITED
                        TABLE 127 SCHLUMBERGER LIMITED: COMPANY OVERVIEW
                        FIGURE 44 SCHLUMBERGER LIMITED: COMPANY SNAPSHOT
                        TABLE 128 SCHLUMBERGER LIMITED: PRODUCTS/SOLUTIONS/SERVICES OFFERED
             12.1.5 VELAN INC.
                        TABLE 129 VELAN INC.: COMPANY OVERVIEW
                        FIGURE 45 VELAN INC.: COMPANY SNAPSHOT
                        TABLE 130 VELAN INC.: PRODUCTS/SOLUTIONS/SERVICES OFFERED
                        TABLE 131 VELAN INC.: DEALS
             12.1.6 WATTS WATER TECHNOLOGIES, INC.
                        TABLE 132 WATTS WATER TECHNOLOGIES, INC.: COMPANY OVERVIEW
                        FIGURE 46 WATTS WATER TECHNOLOGIES, INC.: COMPANY SNAPSHOT
                        TABLE 133 WATTS WATER TECHNOLOGIES, INC.: PRODUCTS/SOLUTIONS/SERVICES OFFERED
             12.1.7 ARMSTRONG INTERNATIONAL INC.
                        TABLE 134 ARMSTRONG INTERNATIONAL INC.: COMPANY OVERVIEW
                        TABLE 135 ARMSTRONG INTERNATIONAL INC.: PRODUCTS/SOLUTIONS/SERVICES OFFERED
                        TABLE 136 ARMSTRONG INTERNATIONAL INC.: DEALS
             12.1.8 TLV CO., LTD.
                        TABLE 137 TLV CO., LTD.: COMPANY OVERVIEW
                        TABLE 138 TLV CO., LTD.: PRODUCTS/SOLUTIONS/SERVICES OFFERED
                        TABLE 139 TLV CO., LTD.: PRODUCT LAUNCHES
             12.1.9 FORBES MARSHALL
                        TABLE 140 FORBES MARSHALL: COMPANY OVERVIEW
                        TABLE 141 FORBES MARSHALL: PRODUCTS/SOLUTIONS/SERVICES OFFERED
             12.1.10 XYLEM
                        TABLE 142 XYLEM: COMPANY OVERVIEW
                        FIGURE 47 XYLEM: COMPANY SNAPSHOT
                        TABLE 143 XYLEM: PRODUCTS/SOLUTIONS/SERVICES OFFERED
     12.2 OTHER PLAYERS 
             12.2.1 WATSON MCDANIEL
                        TABLE 144 WATSON MCDANIEL: COMPANY OVERVIEW
             12.2.2 MIYAWAKI INC.
                        TABLE 145 MIYAWAKI INC.: COMPANY OVERVIEW
             12.2.3 HAWA ENGINEERS LTD.
                        TABLE 146 HAWA ENGINEERS LTD.: COMPANY OVERVIEW
             12.2.4 ARI-ARMATUREN
                        TABLE 147 ARI-ARMATUREN: COMPANY OVERVIEW
             12.2.5 VENN CO., LTD.
                        TABLE 148 VENN CO., LTD.: COMPANY OVERVIEW
             12.2.6 AYVAZ
                        TABLE 149 AYVAZ: COMPANY OVERVIEW
             12.2.7 NETA METAL WORKS
                        TABLE 150 NETA METAL WORKS: COMPANY OVERVIEW
             12.2.8 THERMOMEGATECH, INC.
                        TABLE 151 THERMOMEGATECH, INC.: COMPANY OVERVIEW
             12.2.9 TUNSTALL
                        TABLE 152 TUNSTALL: COMPANY OVERVIEW
             12.2.10 THERMAL ENERGY INTERNATIONAL INC.
                        TABLE 153 THERMAL ENERGY INTERNATIONAL INC.: COMPANY OVERVIEW
             12.2.11 BARNES & JONES, LLC
                        TABLE 154 BARNES & JONES, LLC: COMPANY OVERVIEW
             12.2.12 ESCO GROUP OF COMPANIES
                        TABLE 155 ESCO GROUP OF COMPANIES: COMPANY OVERVIEW
             12.2.13 UNITED BRASS WORKS
                        TABLE 156 UNITED BRASS WORKS: COMPANY OVERVIEW
             12.2.14 COLTON INDUSTRIES
                        TABLE 157 COLTON INDUSTRIES: COMPANY OVERVIEW
             12.2.15 RICHARDS INDUSTRIALS
                        TABLE 158 RICHARDS INDUSTRIALS: COMPANY OVERVIEW
*Details on Business overview, Products/Solutions/Services offered, Recent Developments, MNM view might not be captured in case of unlisted companies.   
 
13 ADJACENT AND RELATED MARKETS (Page No. - 172)
     13.1 INTRODUCTION 
     13.2 STUDY LIMITATIONS 
     13.3 INDUSTRIAL VALVES MARKET, BY COMPONENT 
             13.3.1 INTRODUCTION
                        FIGURE 48 INDUSTRIAL VALVES MARKET, BY COMPONENT
                        TABLE 159 INDUSTRIAL VALVES MARKET, BY COMPONENT, 2019–2022 (USD MILLION)
                        TABLE 160 INDUSTRIAL VALVES MARKET, BY COMPONENT, 2023–2028 (USD MILLION)
     13.4 ACTUATORS 
             13.4.1 PNEUMATIC ACTUATORS
                        13.4.1.1 Diaphragm actuators
                                     13.4.1.1.1 Suitable for control valves used in oil & gas industry
                        13.4.1.2 Piston actuators
                                     13.4.1.2.1 Designed for butterfly valves used in food, chemicals, and pharmaceutical industries
             13.4.2 ELECTRIC ACTUATORS
                        13.4.2.1 Wide use in water & wastewater treatment and chemical plants to boost segmental growth
             13.4.3 HYDRAULIC ACTUATORS
                        13.4.3.1 Integration of hydraulic actuators in HVAC, fire protection, and irrigation systems to propel market growth
                                     TABLE 161 ACTUATORS: INDUSTRIAL VALVES MARKET, BY TYPE, 2019–2022 (USD MILLION)
                                     TABLE 162 ACTUATORS: INDUSTRIAL VALVES MARKET, BY TYPE, 2023–2028 (USD MILLION)
     13.5 VALVE BODY 
             13.5.1 RISING DEMAND FOR VALVE BODIES FEATURING HIGH CORROSION RESISTANCE AND BETTER CHEMICAL COMPATIBILITY TO SUPPORT SEGMENTAL GROWTH
     13.6 OTHER COMPONENTS 
 
14 APPENDIX (Page No. - 177)
     14.1 INSIGHTS FROM INDUSTRY EXPERTS 
     14.2 DISCUSSION GUIDE 
     14.3 KNOWLEDGESTORE: MARKETSANDMARKETS’ SUBSCRIPTION PORTAL 
     14.4 CUSTOMIZATION OPTIONS 
     14.5 RELATED REPORTS 
     14.6 AUTHOR DETAILS 


The study involves four significant activities for estimating the size of the steam trap market. Exhaustive secondary research has been conducted to collect information related to the market. The next step has been validating these findings, assumptions, and sizing with the industry experts across the value chain through primary research. Both top-down and bottom-up approaches have been employed to estimate the overall size of the steam trap market. After that, market breakdown and data triangulation procedures were used to determine the extent of different segments and subsegments of the market.

Secondary Research

Secondary sources in this research study include corporate filings (such as annual reports, investor presentations, and financial statements); trade, business, and professional associations; white papers, certified publications, articles from recognized authors; directories; and databases. The secondary data has been collected and analyzed to determine the overall market size estimations, further validated by primary research.

Primary Research

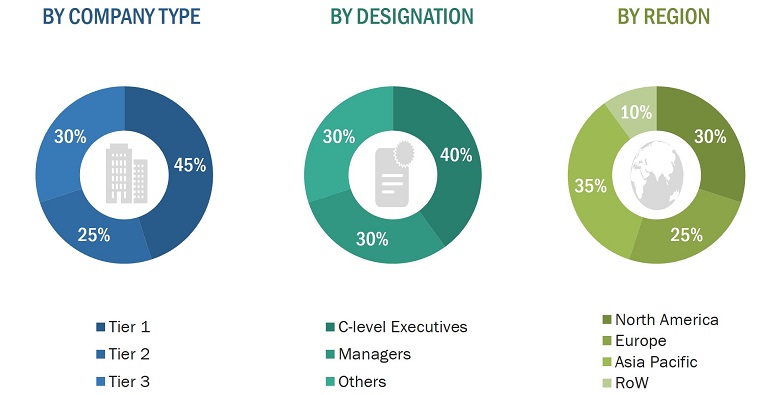
In the primary research process, several sources from both supply and demand sides were interviewed to obtain qualitative and quantitative information about this report. Several primary interviews have been conducted with market experts from both demand and supply sides across four major regions—North America, Europe, Asia Pacific, and the Rest of the World. This primary data has been collected through questionnaires, emails, and telephonic interviews. Approximately 60% of the preliminary interviews have been conducted with the demand side and 40% with the supply side. This primary data has been collected mainly through telephonic interviews, which accounted for 80% of the total primary interviews. Additionally, questionnaires and emails were used to collect the data.
Steam Trap Market Size, and Share

To know about the assumptions considered for the study, download the pdf brochure

Market Size Estimation

In the complete market engineering process, both top-down and bottom-up approaches have been implemented, along with several data triangulation methods, to estimate and validate the size of the steam trap market and other dependent submarkets listed in this report.

  • The key players in the industry and markets have been identified through extensive secondary research.
  • Both the supply chain of the industry and the market size, in terms of value, have been determined through primary and secondary research.
  • All percentage shares, splits, and breakdowns have been determined using secondary sources and verified through primary sources.

Data Triangulation

After arriving at the overall market size, the total market has been split into several segments. The market breakdown and data triangulation procedures have been employed wherever applicable to complete the overall market engineering process and arrive at exact statistics for all segments. The data has been triangulated by studying various factors and trends from both the demand and supply sides. The market has also been validated using both top-down and bottom-up approaches.

Market Definition

A steam trap is an automatic device designed to eliminate condensate and non-condensable gases from a steam system while ensuring that live steam is not released. Functioning as an automatic valve, it opens to permit condensate discharge and closes to safeguard against live steam leakage. The presence of steam traps is crucial for the efficient functioning of steam systems. They play a vital role in preventing the accumulation of condensate, which could otherwise lead to energy wastage and equipment deterioration. Additionally, steam traps aid in removing non-condensable gases, preventing any hindrance to the steam flow and preserving the system’s overall efficiency. Different types of steam traps are available, each with its own mechanism and operation principles. Some common types include mechanical steam traps, thermostatic steam traps, and thermodynamic traps. Each type is suitable for specific applications and operating conditions, and selecting the appropriate steam trap is essential to ensure optimal performance and energy efficiency in steam systems.

Key Stakeholders

  • Government bodies and policymakers
  • Industry organizations, forums, alliances, and associations
  • Market research and consulting firms
  • Raw material suppliers and distributors
  • Research institutes and organizations
  • Analysts and strategic business planners
  • End users of steam trap across various industries such as the oil & gas, chemical, food & beverage, pharmaceutical, energy & power, and others (metals & mining), pulp & paper, and water & wastewater treatment.

Study Objectives:

  • To define, describe, and forecast the steam trap market by product, application, body material, end-user industry, and geography
  • To provide the market statistics, along with a detailed classification of the market size in terms of value
  • To provide critical trends related to the steam trap market that shape and influence business growth
  • To forecast the market size for various segments—in terms of value, concerning four main regions (along with their respective countries), namely North America, Europe, Asia Pacific (APAC), and Rest of the World (RoW)
  • To strategically profile the key players in the market and analyze their market position in terms of ranking and core competencies1, along with detailing the competitive landscape for market leaders
  • To provide detailed information regarding major factors influencing the growth of the steam trap market (drivers, restraints, opportunities, and industry-specific challenges)
  • To provide an overall view of the global market through illustrative segmentation, analysis, and forecast of the significant regional segments
  • To analyze strategic developments—such as joint ventures, mergers and acquisitions, new product launches and developments, and research and development—in the steam trap market

Available Customizations

With the given market data, MarketsandMarkets offers customizations according to the specific requirements of companies. The following customization options are available for the report:

Product Analysis

  • Product matrix that gives a detailed comparison of the product portfolio of each company

Company Information

  • Detailed analysis and profiling of 25 market players
Custom Market Research Services

We will customize the research for you, in case the report listed above does not meet with your exact requirements. Our custom research will comprehensively cover the business information you require to help you arrive at strategic and profitable business decisions.

Request Customization
Report Code
SE 5172
Published ON
Aug, 2023
Choose License Type
BUY NOW
  • SHARE
X
Request Customization
Speak to Analyst
Speak to Analyst
OR FACE-TO-FACE MEETING
PERSONALIZE THIS RESEARCH
  • Triangulate with your Own Data
  • Get Data as per your Format and Definition
  • Gain a Deeper Dive on a Specific Application, Geography, Customer or Competitor
  • Any level of Personalization
REQUEST A FREE CUSTOMIZATION
LET US HELP YOU!
  • What are the Known and Unknown Adjacencies Impacting the Steam Trap Market
  • What will your New Revenue Sources be?
  • Who will be your Top Customer; what will make them switch?
  • Defend your Market Share or Win Competitors
  • Get a Scorecard for Target Partners
CUSTOMIZED WORKSHOP REQUEST
+1-888-600-6441
  • Call Us
  • +1-888-600-6441 (Corporate office hours)
  • +1-888-600-6441 (US/Can toll free)
  • +44-800-368-9399 (UK office hours)
CONNECT WITH US
ABOUT TRUST ONLINE
©2024 MarketsandMarkets Research Private Ltd. All rights reserved
DMCA.com Protection Status Website Feedback