String Inverter Market by Phase (Single and Three), System Type (On-Grid and Off-Grid), Power Rating (Up to 10kw, 11kw�40kw, 41kw�80kw, and Above 80kw), End-User (Residential, Commercial & Industrial, and Utilities), and Region - Global Forecast to 2021


[151 Pages Report] The string inverter market was valued at USD 2.44 Billion in 2015, and is expected to grow at a CAGR of 8.29% from 2016 to 2021. Decrease balance of system cost, remote systems monitoring capabilities, and easy installation & customization are the major factors driving the string inverter market.
The years considered for the study are as follows:
- Base Year � 2015
- Estimated Year � 2016
- Projected Year � 2021
- Forecast Period � 2016�2021
2015 has been considered as the base year for company profiles. Whenever information was unavailable for the base year, the prior year has been considered.
Objectives of the Study
- To define, describe, and forecast the global string inverter market on the basis of phase, power rating, end-user, system type, and region
- To provide detailed information regarding the major factors influencing market growth (drivers, restraints, opportunities, and industry-specific challenges)
- To strategically analyze the market with respect to individual growth trends of manufacturers and service providers, their future expansions, and contribution to the market
- To forecast the growth of the market with respect to the main regions (Asia-Pacific, Europe, the Americas, and the Middle East & Africa)
- To strategically profile key market players and comprehensively analyze their market shares and core competencies
- To analyze market opportunities for stakeholders and provide details of competitive developments, such as contracts & agreements, mergers & acquisitions, expansions, and new product/technology launches, in the global market
Research Methodology
This research study involved the use of extensive secondary sources, directories, and databases such as Hoovers, Bloomberg Businessweek, Factiva, and OneSource to identify and collect information useful for a technical, market-oriented, and commercial study of the global string inverter market. Primary sources are mainly industry experts from core and related industries, preferred suppliers, manufacturers, distributors, service providers, technology developers, standard and certification organizations of companies, and organizations related to all the segments of this industry�s value chain. The points given below explain the research methodology.
- Study of annual revenue and market developments of major players providing string inverter
- Assessment of future trends and industrial growth of end-use industries
- Assessment of the string inverter market with respect to the system type, phase, and power rating
- Study of market trends in various regions/countries supported by application of string inverter in the residential, commercial, industrial, and utilities sectors.
- Study of contracts and developments related to string inverter, for key players, across different regions
- Finalization of the overall market sizes by triangulating the supply-side data, which includes product developments, supply chain, and annual revenues of companies manufacturing string inverter across the globe
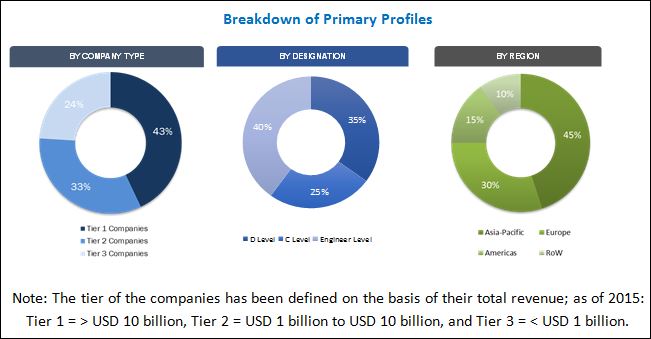
After arriving at the overall string inverter market size, the total market has been split into several segments and subsegments. The figure given below shows the breakdown of primaries on the basis of company type, designation, and region, conducted during the research study.
To know about the assumptions considered for the study, download the pdf brochure
Market Ecosystem:
The ecosystem of the global string inverter market starts with suppliers of basic components such as magnets, transformers, circuitry, wiring, enclosure, packing, and miscellaneous parts. The manufactured parts are then assembled by the OEM (original equipment manufacturer) to form a string inverter, which is then tested. This is followed by the distribution stage, following which the product is provided to the end-users. Distribution is the next stage of the supply chain. The top players in the industry market their products through self-operated sales offices located near target markets, while regional players rely on distribution partnerships to access diverse markets. Some of the major players in the market are KACO New Energy GmbH (Germany), Delta Energy Systems GmbH (Germany), ABB Limited (Switzerland), Chint Power Systems Co., Ltd. (China), Ningbo Ginlong Technologies (China), Samil Power Co., Ltd. (China), Fronius International GmbH (Austria), SMA Solar Technology AG (Germany), and Huawei Technologies Co. Ltd. (China).
Target Audience:
The report�s target audience includes:
- String inverter manufacturers, dealers, and suppliers
- String inverter equipment manufacturing companies
- Government and research organizations
- Environmental and industrial associations
- Banks, venture capitalists, financial institutions, and other investors
- Market research and consulting firms
Get online access to the report on the World's First Market Intelligence Cloud
Request Sample Scope of the Report
:

- By System type
- On-Grid
- Off-Grid
- By Phase
- Single-Phase
- Three-Phase
- By End�Users
- Residential
- Commercial & Industrial
- Utilities
- By Power Rating
- Up to 10 kW
- 11 kW � 40 kw
- 41 kW � 80 kW
- Above 80 kW
- By Region
- Americas
- Europe
- Asia-Pacific
- Middle East & Africa
Available Customizations:
With the given market data, MarketsandMarkets offers customizations as per the client�s specific needs. The following customization options are available for this report:
Regional Analysis
Further breakdown of region/country-specific analysis
Company Information
Detailed analysis and profiling of additional market players (Up to five)
The global string inverter market is projected to grow at a CAGR of 8.29% from 2016 to 2021, to reach a market size of USD 3.89 Billion by 2021. The growth is attributed to decrease balance of system cost, remove systems monitoring capabilities, and easy installation & customization.
The report segments the string inverter market based on end-users into residential, commercial & industrial, and utilities. Utilities segment is the largest end-user of string inverter owing to growing number of utilities in the solar sector, serving both, the distributed solar market as well as building and operating large-scale PV power plants. Based on system type, the on-grid segment is expected to dominate the string inverter market during the forecast period. The market has also been segmented based on power rating into four segments: up to 10 kW, 11 kW � 40 kW, 41 kW � 80 kW, and above 80 kW. The 41 kW-80 kW segment is the largest market; due to their compact size and light weight, these inverters offer more design flexibility for all sizes of PV plants and provide higher level of protection and enhances durability in a harsh outdoor environment. The report segments the market based on phase into single-phase and three-phase. The latter is estimated to be the largest market owing to rising installations of large utility-scale solar systems in Japan, China, and other European countries. Inverter manufacturers have been strongly promoting the installation of three-phase string inverters in large power plants, due to which the global shipments are projected to double in the next 4 years.
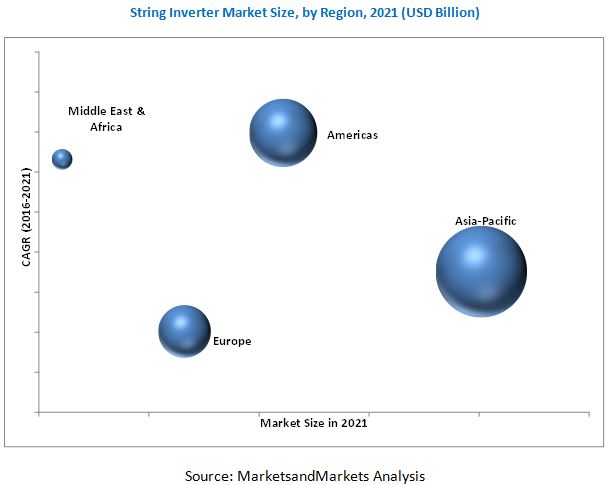
In this report, the string inverter market has been analyzed with respect to four regions, namely, the Americas, Europe, Asia-Pacific, and the Middle East & Africa. Asia-Pacific is expected to dominate the global market during the forecast period, owing to government targets, policy support (tax incentives and RPOs), incentives such as feed-in tariffs, and tenders and competitive bidding in the region. The Americas, on the other hand, is expected to be the fastest growing market among other regions, during the forecast period.
Higher heat loss due to the large size and no panel level monitoring are expected to slow down the demand for string inverters during the forecast period. However, government incentives schemes offer huge opportunities. Some of the leading players in the string inverter market include KACO New Energy GmbH (Germany), Delta Energy Systems GmbH (Germany), ABB Limited (Switzerland), Chint Power Systems Co., Ltd. (China), Ningbo Ginlong Technologies (China), Samil Power Co., Ltd. (China), Fronius International GmbH (Austria), SMA Solar Technology AG (Germany), and Huawei Technologies Co. Ltd. (China), among others. Contracts & agreement was the strategy most commonly adopted by the top players in the string inverter market, constituting 45% of the total developments from 2013 to 2016. It was followed by new product development, expansion, partnerships/joint ventures/collaboration, and merger & acquisitions.
To speak to our analyst for a discussion on the above findings, click Speak to Analyst
Table of Contents
1 Introduction (Page No. - 14)
1.1 Objectives of the Study
1.2 Market Definition
1.3 Market Scope
1.3.1 Markets Covered
1.3.2 Countries Covered
1.3.3 Years Considered for the Study
1.4 Currency
1.5 Limitations
1.6 Stakeholders
2 Research Methodology (Page No. - 18)
2.1 Research Data
2.1.1 Secondary Data
2.1.1.1 Key Data From Secondary Sources
2.1.2 Primary Data
2.1.2.1 Key Data From Primary Sources
2.1.2.2 Key Industry Insights
2.1.2.3 Breakdown of Primaries
2.2 Market Size Estimation
2.3 Data Triangulation
2.4 Research Assumptions & Limitations
2.4.1 Assumptions
3 Executive Summary (Page No. - 26)
3.1 Introduction
3.2 Historical Backdrop and Evolution
3.3 Current Scenario
3.4 Future Outlook
3.5 Conclusion
4 Premium Insights (Page No. - 32)
4.1 String Inverter Market, By Phase
4.2 Market, By Power Rating
4.3 Market, By System Type
4.4 Market, By End-User
4.5 Market: Phase vs System-Type
4.6 Asia-Pacific: the Largest Market During the Forecast Period
5 Market Overview (Page No. - 37)
5.1 Introduction
5.2 Market Segmentation
5.2.1 By Phase
5.2.2 By Power Rating
5.2.3 By End-User
5.2.4 By Region
5.2.5 By System Type
5.3 Market Dynamics
5.3.1 Drivers
5.3.1.1 Decreased Balance of System Cost
5.3.1.2 Remote System Monitoring Capabilities
5.3.1.3 Easy Installation & Customization
5.3.2 Restraints
5.3.2.1 Shading One Panel Reduces the Efficiency of All Panels
5.3.2.2 Higher Heat Loss Due to Large Size
5.3.2.3 No Panel Level Monitoring
5.3.3 Opportunities
5.3.3.1 Government Incentive Schemes
5.3.4 Challenges
5.3.4.1 Pricing Pressure
5.3.4.2 Safety Hazards Associated With High Voltage
6 Market, By Phase (Page No. - 46)
6.1 Introduction
6.2 Single-Phase
6.3 Three-Phase
7 Market, By System Type (Page No. - 50)
7.1 Introduction
7.2 On-Grid
7.3 Off-Grid
8 Market, By End-User (Page No. - 54)
8.1 Introduction
8.2 Residential
8.2.1 Commercial & Industrial
8.3 Utilities
9 Market, By Power Rating (Page No. - 60)
9.1 Introduction
9.2 Upto 10 kW
9.3 11 kW�40 kW
9.4 41 kW�80 kW
9.5 Above 80 kW
10 Market, By Region (Page No. - 64)
10.1 Introduction
10.2 Asia-Pacific
10.2.1 By System Type
10.2.2 By Phase
10.2.3 By Power Rating
10.2.4 By End-User
10.2.5 By Country
10.2.5.1 China
10.2.5.2 Japan
10.2.5.3 India
10.2.5.4 South Korea
10.2.5.5 Australia
10.2.5.6 Rest of Asia-Pacific
10.3 Europe
10.3.1 By System Type
10.3.2 By Phase
10.3.3 By Power Rating
10.3.4 By End-User
10.3.5 By Country
10.3.5.1 Germany
10.3.5.2 U.K.
10.3.5.3 France
10.3.5.4 Italy
10.3.5.5 Spain
10.3.5.6 Rest of Europe
10.4 Americas
10.4.1 By System Type
10.4.2 By Phase
10.4.3 By Power Rating
10.4.4 By End-User
10.4.5 By Country
10.4.5.1 U.S.
10.4.5.2 Canada
10.4.5.3 Mexico
10.4.5.4 Rest of Americas
10.5 Middle East & Africa
10.5.1 By System Type
10.5.2 By Phase
10.5.3 By Power Rating
10.5.4 By End-User
10.5.5 By Country
10.5.5.1 UAE
10.5.5.2 Algeria
10.5.5.3 South Africa
10.5.5.4 Rest of Middle East & Africa
11 Competitive Landscape (Page No. - 91)
11.1 Overview
11.2 Competitive Situation & Trends
11.3 String Inverter Market Share Analysis, Market (By Key Players)
11.4 Contracts & Agreements
11.5 Expansions
11.6 Partnerships, Joint Ventures, Collaborations
11.7 New Product Development/Launches
11.8 Mergers & Acquisitions
12 Company Profiles (Page No. - 99)
(Overview, Products & Services, Strategies & Insights, Developments and MnM View)*
12.1 Introduction
12.2 SMA Solar Technology AG
12.3 Solaredge Technologies, Inc.
12.4 Schneider Electric Solar
12.5 ABB Limited
12.6 Sungrow Power Supply Co., Ltd.
12.7 Fronius International GmbH
12.8 Solarmax Group
12.9 Yaskawa � Solectria Solar
12.10 Ginlong Technologies
12.11 Delta Energy System GmbH
12.12 Samil Power Co., Ltd.
12.13 KACO New Energy GmbH
12.14 Chint Power Systems Co., Ltd.
12.15 Huawei Technologies Co. Ltd
12.16 Growatt New Energy Technology Co., Ltd.
*Details on Overview, Products & Services, Strategies & Insights, Developments and MnM View Might Not Be Captured in Case of Unlisted Companies.
13 Appendix (Page No. - 142)
13.1 Insights of Industry Experts
13.2 Discussion Guide
13.4 Knowledge Store: Marketsandmarkets� Subscription Portal
13.5 Introducing RT: Real-Time Market Intelligence
13.6 Available Customizations
13.7 Related Reports
13.8 Author Details
List of Tables (66 Tables)
Table 1 String Inverter Market Size, By Phase, 2014�2021 (USD Million)
Table 2 Single-Phase: Market Size, By Region, 2014�2021 (USD Million)
Table 3 Three-Phase: Market Size, By Region, 2014�2021 (USD Million)
Table 4 String Inverter Market Size, By System Type, 2014�2021 (USD Million)
Table 5 On-Grid: Market Size, By Region, 2014�2021 (USD Million)
Table 6 Off-Grid: Market Size, By Region, 2014�2021 (USD Million)
Table 7 String Inverter Market Size, By End-User, 2014�2021 (USD Million)
Table 8 Residential: Market Size, By Region, 2014�2021 (USD Million)
Table 9 Residential: Market Size, By Top Five Countries, 2014�2021 (USD Million)
Table 10 Commercial & Industrial: Market Size, By Region, 2014�2021 (USD Million)
Table 11 Commercial & Industrial: Market Size, By Top Five Countries, 2014�2021 (USD Million)
Table 12 Utilities : Market Size, By Region, 2014�2021 (USD Million)
Table 13 Utilities: Market Size, By Top Five Countries, 2014�2021 (USD Million)
Table 14 String Inverter Market Size, By Power Rating, 2014�2021 (USD Million)
Table 15 Up to 10 kW: Market Size, By Region, 2014�2021 (USD Million)
Table 16 11 kW�40 kW: By Market Size, By Region, 2014�2021 (USD Million)
Table 17 41 kW�80 kW: By Market Size, By Region, 2014�2021 (USD Million)
Table 18 Above 80 kW : Market Size, By Region, 2014�2021 (USD Million)
Table 19 String Inverter Market Size, By Region, 2014�2021 (USD Million)
Table 20 Top Five Countries: Market Size, 2014�2021 (USD Million)
Table 21 Top Five Countries: Market Size, 2014�2021 (USD Million)
Table 22 Asia-Pacific: Market Size, By System Type, 2014�2021 (USD Million)
Table 23 Asia-Pacific: By Market Size, By Phase, 2014�2021 (USD Million)
Table 24 Asia-Pacific: By Market Size, By Power Rating, 2014�2021 (USD Million)
Table 25 Asia-Pacific: By Market Size, By End-User, 2014�2021 (USD Million)
Table 26 Asia-Pacific: By Market Size, By Country, 2014�2021 (USD Million)
Table 27 China: Market Size, By End-User, 2014�2021 (USD Million)
Table 28 Japan: Market Size, By End-User, 2014�2021 (USD Million)
Table 29 India: Market Size, By End-User, 2014�2021 (USD Million)
Table 30 South Korea: Market Size, By End-User, 2014�2021 (USD Million)
Table 31 Australia: Market Size, By End-User, 2014�2021 (USD Million)
Table 32 Rest of Asia-Pacific: Market Size, By End-User, 2014�2021 (USD Million)
Table 33 Europe: Market Size, By System Type, 2014�2021 (USD Million)
Table 34 Europe: By Market Size, By Phase, 2014�2021 (USD Million)
Table 35 Europe: By Market Size, By Power Rating, 2014�2021 (USD Million)
Table 36 Europe: By Market Size, By End-User, 2014�2021 (USD Million)
Table 37 Europe: By Market Size, By Country, 2014�2021 (USD Million)
Table 38 Germany: Market Size, By End-User, 2014�2021 (USD Million)
Table 39 U.K.: Market Size, By End-User, 2014�2021 (USD Million)
Table 40 France: Market Size, By End-User, 2014�2021 (USD Million)
Table 41 Italy: Market Size, By End-User, 2014�2021 (USD Million)
Table 42 Spain: Market Size, By End-User, 2014�2021 (USD Million)
Table 43 Rest of Europe: Market Size, By End-User, 2014�2021 (USD Million)
Table 44 Americas: Market Size, By System Type, 2014�2021 (USD Million)
Table 45 Americas: By Market Size, By Phase, 2014�2021 (USD Million)
Table 46 Americas: By Market Size, By Power Rating, 2014�2021 (USD Million)
Table 47 Americas: By Market Size, By End-User, 2014�2021 (USD Million)
Table 48 Americas: By Market Size, By Country, 2014�2021 (USD Million)
Table 49 U.S.: By String Inverter Market Size, By End-User, 2014�2021 (USD Million)
Table 50 Canada: By Market Size, By End-User, 2014�2021 (USD Million)
Table 51 Mexico: By Market Size, By End-User, 2014�2021 (USD Million)
Table 52 Rest of Americas: By Market Size, By End-User, 2014�2021 (USD Million)
Table 53 Middle East & Africa: String Inverter Market Size, By System Type, 2014�2021 (USD Million)
Table 54 Middle East & Africa: By Market Size, By Phase, 2014�2021 (USD Million)
Table 55 Middle East & Africa: By Market Size, By Power Rating, 2014�2021 (USD Million)
Table 56 Middle East & Africa: By Market Size, By End-User, 2014�2021 (USD Million)
Table 57 Middle East & Africa: By Size, By Country, 2014�2021 (USD Million)
Table 58 UAE: By Market Size, By End-User, 2014�2021 (USD Million)
Table 59 Algeria: By Market Size, By End-User, 2014�2021 (USD Million)
Table 60 South Africa: By Market Size, By End-User, 2014�2021 (USD Million)
Table 61 Rest of Middle East & Africa: By Market Size, By End-User, 2014�2021 (USD Million)
Table 62 Contracts & Agreements, 2013-16
Table 63 Expansions, 2013-2016
Table 64 Partnerships, Joint Ventures, Collaborations, 2013-2016
Table 65 New Product Development/Launches, 2013-2016
Table 66 Mergers & Acquisitions, 2103-2016
List of Figures (41 Figures)
Figure 1 String Inverter Market: Research Design
Figure 2 Breakdown of Primary Interviews: By Company Type, Designation, & Region
Figure 3 String Inverter Market Size Estimation Methodology: Bottom-Up Approach
Figure 4 String Inverter Market Size Estimation Methodology: Top-Down Approach
Figure 5 String Inverter Market: Data Triangulation
Figure 6 Asia-Pacific Accounted for the Largest String Inverter Market Share in Market in 2015
Figure 7 Asia-Pacific is Expected to Dominate Market By 2021
Figure 8 Three Phase Segment is Expected to Dominate Market, 2016�2021
Figure 9 String Inverter Market Size, By End-User, 2016�2021 (USD Million)
Figure 10 41 kW � 80 kW Power Rating is Expected to Lead Market, 2016�2021
Figure 11 On-Grid Segment is Projected to Dominate Market During the Forecast Period
Figure 12 Attractive Market Opportunities in the Market
Figure 13 String Inverters Market Share, By Type, 2016�2021
Figure 14 41 kW-80 kW Segment is Expected to Dominate the Market, 2021
Figure 15 On-Grid Segment is the Largest System Type Segment in the String Inverter Market, 2016�2021
Figure 16 Residential End-User is the Fastest Growing Segment in the Market, 2016�2021
Figure 17 On-Grid String Inverter Segment Holds the Largest Market Share in 2016
Figure 18 String Inverters Market Share (Value), By Region, 2015
Figure 19 String Inverters Market Segmentation
Figure 20 Decreased Direct Current Balance of System Cost is Expected to Drive the Market
Figure 21 I-V Characteristics of the Module Under Uniform Shading
Figure 22 Three-Phase Phase Segment to Remain the Dominating Market During the Forecast Period
Figure 23 On-Grid System Type Segment Expected to Dominate Market From 2016 to 2021
Figure 24 Utilities End-User Segment is Expected to Dominate the Market By 2021
Figure 25 41 kW-80 kW Segment is Expected to Dominate the Market By 2021
Figure 26 String Inverter Market Share (By Value), By Region, 2015
Figure 27 Regional Snapshot: Growth Rate of the Market in From 2014 to 2021
Figure 28 China Continue to Dominate Among Top Five Countries in Market From 2016 to 2021
Figure 29 China Continue to Dominate Among Top Five Countries in Market From 2016 to 2021
Figure 30 Regional Snapshot: Asia-Pacific Offered Attractive Market Opportunities in 2015
Figure 31 Regional Snapshot: Europe Was the Second Largest Market in 2015
Figure 32 Americas: Grid-Connected Solar PV Annual Capacity (Mw), 2014
Figure 33 Companies Adopted the Strategy of Contracts & Agreements to Garner Market Share in 2013-2016
Figure 34 Battle for Market Share: Contracts & Agreements is the Key Strategy Adopted By Major Players, 2013-2016
Figure 35 String Inverter Market Evolution Framework: Contracts & Agreements Have Fuelled Growth From 2013 to 2016
Figure 36 String Inverter Market Share Analysis (Revenue, 2015)
Figure 37 Region-Wise Revenue Mix of the Top 5 Market Players
Figure 38 SMA Solar Technology AG : Company Snapshot
Figure 39 Solaredge Technologies, Inc. : Company Snapshot
Figure 40 Schneider Electric Solar: Company Snapshot
Figure 41 ABB Limited : Company Snapshot


Growth opportunities and latent adjacency in String Inverter Market