Surfactant EOR Market by Origin (Surfactants, Biosurfactants), Type (Anionic Surfactants, Other Surfactants), Technique (ASP Flooding, SP Flooding), Application (Onshore, Offshore), and by Region - Global Forecast to 2021


[153 Pages Report] Surfactant EOR Market size is projected to reach USD 70.9 Million, by 2021, and register a CAGR of 3.20%, between 2016 and 2021. The main objective of the study is to define, describe, and forecast the Surfactants EOR market on the basis of origin, type, technique, application and region. The study considers 2015 as the base year and forecast period between 2016 and 2021. The report includes detailed information about the major factors influencing the growth of the market (drivers, restraints, opportunities, industry specific challenges, and winning imperatives). The report strategically analyzes the market segments with respect to individual growth trends, growth prospects, and contribution to the total market. In the report, the market size is forecasted for the segments, in terms of value, with respect to five major regions, namely, North America, Europe, Asia & Middle East, Africa, and Central & South America.
In the secondary research process, various sources have been referred to for the identification and collection of information for this study. These secondary sources include annual reports, press releases, and investor presentations of companies, white papers and certified publications, and articles from recognized authors. In the primary research process, sources from both, the supply and demand sides have been interviewed to obtain qualitative and quantitative information. The bottom-up approach has been used to estimate the Surfactants EOR market size, in terms of value, on the basis of origin, type, technique application, and region. The top-down approach has been implemented to validate the market size, in terms of value. Through the data triangulation procedure and validation of data via primary interviews, the exact values of the overall parent market size and individual market sizes have been determined and confirmed in the study.
The figure below provides a break-up of the profile of primary discussion participants.
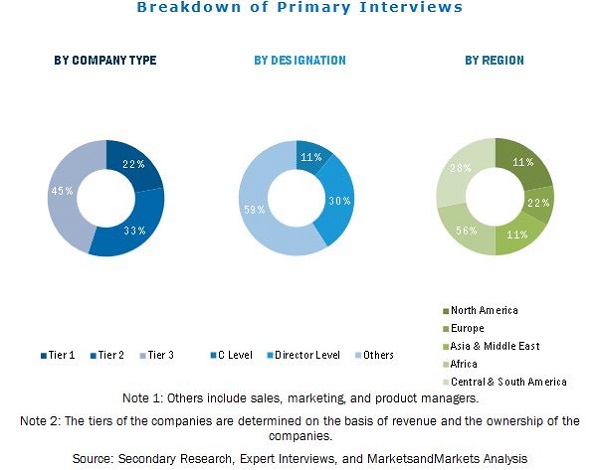
To know about the assumptions considered for the study, download the pdf brochure
Surfactant EOR value chain starts with the manufacturers. The major manufacturers are the Dow Chemical Company (U.S.), BASF SE (Germany), and Stepan Company (U.S.). The second node of the value chain consists of the Surfactants EOR formulators such as Schlumberger (U.S.), Baker Hughes (U.S.), and Halliburton (U.S.). The third node in the value chain consists of distribution and marketing of Surfactants EOR to particular end-use industries such as onshore and offshore.
�This study answers several questions for stakeholders, primarily, which market segments to focus on in the next two to five years for prioritizing efforts and investments�.
Target Audience:
- Surfactants EOR manufacturers
- Surfactants EOR formulators
- Surfactants EOR traders, distributors, and suppliers
- Raw material suppliers
- Government and research organizations
- Environment regulatory bodies
Get online access to the report on the World's First Market Intelligence Cloud
Request Sample Scope of the Report
:

The report segments the markets of Surfactants EOR on the basis of origin, type, technique, application �ion, and provides a forecast of market size, in terms of value, and an analysis of trends in each of the submarkets.
On the basis of Type:
- Anionic surfactants
- Others (cationic and non-ionic surfactants)
On the basis of Application:
- Onshore
- Offshore
On the basis of Origin
- Surfactants
- Biosurfactants
On the basis of Technique
- Alkaline-surfactant-polymer (ASP) flooding
- Surfactant-polymer (SP) flooding
On the basis of Region:
- North America
- Europe
- Asia & Middle East
- Africa
- Central & South America
Available Customizations: The following customization options are available for this report:
- Company Information
Analysis and profiling of additional global as well as regional market players (Up to three)
- Country Information
Market analysis for additional countries
- Pricing Analysis
Detailed pricing analysis for each type of Surfactants EOR product
The Surfactants EOR market, in terms of value, is projected to reach USD 70.9 Million, by 2021, at a CAGR of 3.20%, between 2016 and 2021. Environmentally-friendly biosurfactants and increasing oil E&P activities in Asia & the Middle East are the key factors driving the growth of the Surfactants EOR market.
As the oil reserves are depleting, the need for deeper drilling activities has increased. This is expected to influence the market players to use the EOR techniques, resulting in increased demand for surfactants.
The Surfactants EOR market has been segmented based on origin as synthetic and biosurfactants. Synthetically produced surfactants are the largest-growing segments of the Surfactants EOR market. Biosurfactants are surface active chemical compounds, amphiphilic, and are synthesized by microorganisms. Synthetically produced surfactants are widely used in the surfactant EOR market in comparison to biosurfactants because the latter is relatively expensive and weaker than conventionally used surfactants.
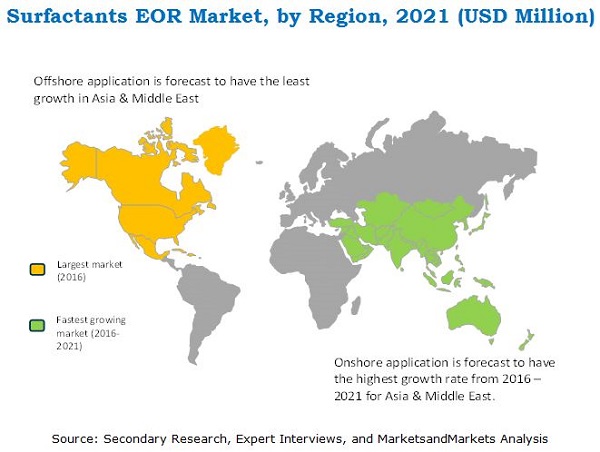
The Surfactants EOR market has been segmented based on application, which are onshore and offshore. Onshore is the largest application in the Surfactants EOR market. Surfactants are widely used to recover a large quantity of oil from onshore reserves in comparison to offshore reserves.
Asia & Middle East is the fastest-growing region of the Surfactants EOR market. The ongoing surfactant EOR projects in China and India are expected to drive the market in Asia & the Middle East, during forecast period, between 2016 and 2021. The EOR project in countries such as Qatar, UAE, and Kuwait provide immense growth opportunity to the market during the forecast period.
Although the Surfactants EOR market is growing at a significant rate, certain factors could hinder the market growth. The development of cheaper substitutes can provide a significant impetus to the growth of the market. Restrictions in developing cheaper surfactants providing a similar level of effectiveness act as the most important challenge for the surfactant EOR market. Limitation of surfactants to effectively perform in the offshore field EOR process is currently a major challenge in the market.
Companies such as BASF SE (Germany), Shell Chemicals (The Netherlands), Halliburton (U.S.), and Huntsman Corporation (U.S.) are key players in the Surfactants EOR market. They have strengthened their market position through diverse product portfolios, strategically positioned R&D centers, consistent strategic development activities, and technological advancements. They have been adopting various organic and inorganic growth strategies, such as expansions, agreements & joint ventures, and new product launches & developments to increase their market share.
To speak to our analyst for a discussion on the above findings, click Speak to Analyst
Table of Contents
1 Introduction (Slide No. - 13)
1.1 Market Definition
1.2 Stakeholders
2 Research Methodology (Slide No. - 16)
2.1 Research Data
2.1.1 Secondary Data
2.1.1.1 Key Data From Secondary Sources
2.1.2 Primary Data
2.1.2.1 Key Data From Primary Sources
2.1.2.2 Breakdown of Primaries
2.2 Market Size Estimation
2.2.1 Bottom-Up Approach
2.2.2 Top-Up Approach
2.3 Data Triangulation
2.4 Research Assumptions
2.4.1 Assumptions
3 Executive Summary (Slide No. - 24)
4 Premium Insights (Slide No. - 29)
4.1 Opportunities in the Surfactant EOR Market
4.2 Surfactant EOR Market Attractiveness
4.3 Surfactant EOR Market, By Technique
4.4 High Growth Potential in Asia & Middle East Surfactant EOR Market, 2016-2021
5 Surfactant EOR Market Overview and Industry Trends (Slide No. - 35)
5.1 Selectivity Factor of Surfcatants in EOR Techniques
5.2 Market Dynamics
5.2.1 Drivers
5.2.2 Restraints
5.2.3 Opportunities
5.2.4 Challenges
5.3 Value Chain Anallysis
5.4 Porters Five Forces Anallysis
5.4.1 Threat of New Entrants
5.4.2 Threat of Substitutes
5.4.3 Bargaining Power of Suppliers
5.4.4 Bargaining Power of Buyers
5.4.5 Intensity of Competitive Rivalry
5.5 Price Analysis
6 Surfactant EOR Market, By Origin (Slide No. - 41)
6.1 Introduction
6.1.1 Surfactants
6.1.2 Biosurfactants
7 Surfactant EOR Market, By Technique (Slide No. - 47)
7.1 Introduction
7.1.1 ASP Flooding
7.1.2 SP Flooding
8 Surfactant EOR Market, By Type (Slide No. - 54)
8.1 Introduction
8.2 Surfactant EOR Market, Segmentation
9 Surfactant EOR Market, By Application (Slide No. - 59)
9.1 Introduction
9.1.1 Overview of Someglobal Onshore and Offshore Projects
9.1.2 Onshore
9.2.3 Offshore
9.2.3.1 Existing Offshore Chemical EOR Projects: Overview
10 Surfactant EOR Market, Regional & Country Level Analysis (Slide No. - 70)
10.1 Introduction
11 North America: Surfactant EOR Market (Slide No. - 73)
11.1 Introduction
11.1.1 Surfactant EOR Market in North America
11.1.2 North America Market: Overview
11.1.3 Market in the U.S.
11.1.4 Market in Canada
11.1.5 Market in Mexico
12 Europe: Surfactant EOR Market (Slide No. - 80)
12.1 Introduction
12.1.1 Surfactant EOR Market in Europe
12.1.2 Europe Market: Overview
12.1.3 Market in Russia
12.1.4 Market in U.K.
12.1.5 Market in Norway
12.1.6 Market in France
12.1.7 Market in Rest of Europe
13 Asia & Middle East: Surfactant EOR Market (Slide No. - 89)
13.1 Introduction
13.1.1 Surfactant EOR Market in Asia & Middle East
13.1.2 Asia & Middle East Market: Overview
13.1.3 Market in China
13.1.4 Market India.
13.1.5 Market in Saudi Arabia
13.1.6 Market in UAE
13.1.7 Market in Qatar
13.1.8 Market in Rest of Asia & Middle East
14 Africa: Surfactant EOR Market (Slide No. - 98)
14.1 Introduction
14.1.1 Surfactant EOR Market in Africa
14.1.2 Africa Market: Overview
14.1.3 Market in Nigeria
14.1.4 Market Angola.
14.1.5 Market in Libya
14.1.6 Market in Rest of Africa
15 Central & South America: Surfactant EOR Market (Slide No. - 106)
15.1 Introduction
15.1.1 Surfactant EOR Market in Central & South America
15.1.2 Central & South America Market: Overview
15.1.3 Market in Colombia
15.1.4 Market Venezuela.
15.1.5 Market in Brazil
15.1.6 Market in Rest Ofcentral & Soth America
16 Competitive Landscape and Company Profiles (Slide No. - 113)
16.1 Ranking of Major Market Players
16.2 The DOW Chemical Company
16.2.1 Business Overview
16.2.2 Products Offered
16.2.3 SWOT Analysis
16.3 BASF SE
16.3.1 Business Overview
16.3.2 Products Offered
16.3.3 SWOT Analysis
16.4 Shell Chemicals
16.4.1 Business Overview
16.4.2 Products Offered
16.4.3 SWOT Analysis
16.5 Huntsman Corporation.
16.5.1 Business Overview
16.5.2 Products Offered
16.5.3 SWOT Analysis
16.6 Stepan Company
16.6.1 Business Overview
16.6.2 Products Offered
16.6.3 SWOT Analysis
16.7 Halliburton Company.
16.7.1 Business Overview
16.7.2 Products Offered
16.8 Sasol Ltd.
16.8.1 Business Overview
16.8.2 Products Offered
16.9 Oil Chem Technologies
16.9.1 Business Overview
16.9.2 Products Offered
16.10 Lubrizol Corporation
16.10.1 Business Overview
16.10.2 Products Offered
16.11 Solvay S.A.
16.11.1 Business Overview
16.11.2 Products Offered
16.12 Recent Developments
17 Appendix (Slide No. - 153)
17.1 Discussion Guide
List of Tables (65 Tables)
Table 1 Properties of Surfactants Required for the EOR Process
Table 2 Surfactant EOR Market, By Origin: Snapshot, 2015 (USD Million)
Table 3 Market, By Origin (USD Million)
Table 4 Regional-Level Analysis: Surfactant EOR Market, Surfactants (USD Million)
Table 5 Regional-Level Analysis: Market, Biosurfactants (USD Million)
Table 6 Chemical EOR Method Comparison Chart
Table 7 Surfactant EOR Market, By Technique: Snapshot, 2015 (USD Million)
Table 8 Market, By Technique (USD Million)
Table 9 Regional-Level Analysis: Surfactant EOR Market, ASP Flooding (USD Million)
Table 10 Regional-Level Analysis: Market, SP Flooding (USD Million)
Table 11 Surfactant EOR Market, By Type: Snapshot, 2015 (USD Million)
Table 12 Global Surfactant EOR Market, By Type (USD Million)
Table 13 Overview: Some of the Global Onshore and Offshore Projects
Table 14 Surfactant EOR Market, By Application: Snapshot, 2015 (USD Million)
Table 15 Market, By Application (USD Million)
Table 16 Regional-Level Analysis: Surfactant EOR Market, Onshore (USD Million)
Table 17 Regional-Level Analysis: Market, Offshore (USD Million)
Table 18 Regional-Level Analysis: Market (USD Million)
Table 19 North America: Surfactant EOR Market, 2014�2021 (USD Million)
Table 20 North America: Surfactant EOR Market, By Origin (USD Million)
Table 21 North America: Surfactant EOR Market, By Technique (USD Million)
Table 22 North America: Surfactant EOR Market, By Application (USD Million)
Table 23 North America: Surfactant EOR Market, By Country (USD Million)
Table 24 U.S.: Surfactant EOR Market, By Technique (USD Million)
Table 25 Canada: Surfactant EOR Market, By Technique (USD Million)
Table 26 Mexico: Surfactant EOR Market, By Technique (USD Million)
Table 27 Europe: Surfactant EOR Market, 2014�2021 (USD Million)
Table 28 Europe: Market, By Origin (USD Million)
Table 29 Europe: Market, By Technique (USD Million)
Table 30 Europe: Market, By Application (USD Million)
Table 31 Europe: Market, By Country (USD Million)
Table 32 Russia: Surfactant EOR Market, By Technique (USD Million)
Table 33 Russia: Market, By Technique (USD Million)
Table 34 Norway: Surfactant EOR Market, By Technique (USD Million)
Table 35 France: Surfactant EOR Market, By Technique (USD Million)
Table 36 Rest of Europe: Surfactant EOR Market, By Technique (USD Million)
Table 37 Asia & Middle East: Market, 2014�2021 (USD Million)
Table 38 Asia & Middle East: Market, By Origin (USD Million)
Table 39 Asia & Middle East: Market, By Technique (USD Million)
Table 40 Asia & Middle East: Market, By Origin (USD Million)
Table 41 Asia & Middle East: Market, By Country (USD Million)
Table 42 China: Surfactant EOR Market, By Technique (USD Million)
Table 43 India: Surfactant EOR Market, By Technique (USD Million)
Table 44 UAE: Surfactant EOR Market, By Technique (USD Million)
Table 45 Qatar: Surfactant EOR Market, By Technique (USD Million)
Table 46 Some Facts and Figures, 2015
Table 47 Rest of Asia & Middle East: Surfactant EOR Market, By Technique (USD Million)
Table 48 Africa: Surfactant EOR Market, 2014�2021 (USD Million)
Table 49 Africa: Market, By Origin (USD Million)
Table 50 Africa: Market, By Technique (USD Million)
Table 51 Africa: Market, By Application (USD Million)
Table 52 Africa: Market, By Country (USD Million)
Table 53 Nigeria: Surfactant EOR Market, By Technique (USD Million)
Table 54 Angola: Surfactant EOR Market, By Technique (USD Million)
Table 55 Libya: Surfactant EOR Market, By Technique (USD Million)
Table 56 Some Facts and Figures, 2015
Table 57 Rest of Africa: Surfactant EOR Market, By Technique (USD Million)
Table 58 Central & South America: Surfactant EOR Market, By Origin (USD Million)
Table 59 Central & South America: Surfactant EOR Market, By Technique (USD Million)
Table 60 Central & South America: Surfactant EOR Market, By Application (USD Million)
Table 61 Central & South America: Surfactant EOR Market, By Country (USD Million)
Table 62 Surfactant EOR Market in Colombia (Country-Level Analysis)
Table 63 Venezuela: Surfactant EOR Market, By Technique (USD Million)
Table 64 Brazil: Surfactant EOR Market, By Technique (USD Million)
Table 65 Rest of Central & South America: Surfactant EOR Market, By Technique (USD Million)
List of Figures (56 Figures)
Figure 1 Surfactant EOR Market Segmentation
Figure 2 Years Considered for the Study
Figure 3 Surfactant EOR Market: Research Design
Figure 4 Breakdown of Primary Interviews
Figure 5 Market Size Estimation: Top-Down Approach
Figure 6 Market Size Estimation: Bottom Up Approach
Figure 7 Biosurfactants to Register Highest CAGR During the Forecast Period
Figure 8 SP Flooding Technique to Register Highest CAGR During the Forecast Period
Figure 9 Anionic Surfactants to Dominate the Market During the Forecast Period
Figure 10 Onshore Application to Dominate the Market During the Forecast Period
Figure 11 Asia & Middle East Projected to Register Highest CAGR During the Forecast Period
Figure 12 Low Growth in the Surfactant EOR Market
Figure 13 Asia & Middle East to Be the Fastest-Growing Region in the Surfactant EOR Market, 2016�2021
Figure 14 Surfactant EOR Market to Register High Growth in Developing Countries Between 2016 and 2021
Figure 15 North America Accounted for the Largest Share of the Surfactant EOR Market, By Technique (2015)
Figure 16 Developing Economies to Grow at A Faster Rate By 2021
Figure 17 Market Dynamics
Figure 18 Average Price - By Region (2015)
Figure 19 Average Price - By Type (2015)
Figure 20 Surfactant EOR Market Share, By Origin, 2015
Figure 21 Market Share, By Technique, 2015
Figure 22 Market Share, By Type, 2015
Figure 23 Market Size, 2015
Figure 24 Canada, the Largest Market for Surfactant EOR in U.S. (2015)
Figure 25 U.S.: Surfactant EOR Market, By Technique (2015)
Figure 26 Canada: Surfactant EOR Market, By Technique (2015)
Figure 27 Mexico: Surfactant EOR Market, By Technique (2015)
Figure 28 Country Split, 2015
Figure 29 Russia: Surfactant EOR Market, By Technique (2016-2021)
Figure 30 Russia: Market, By Technique (2016-2021)
Figure 31 Norway: Surfactant EOR Market, By Technique (2015)
Figure 32 France: Surfactant EOR Market, By Technique (2016�2021)
Figure 33 Rest of Europe: Surfactant EOR Market, By Technique (2015)
Figure 34 Country Split, 2015
Figure 35 China: Surfactant EOR Market, By Technique (2015)
Figure 36 India: Surfactant EOR Market, By Technique (2016�2021)
Figure 37 UAE: Surfactant EOR Market, By Technique (2016�2021)
Figure 38 Rest of Asia & Middle East: Surfactant EOR Market, By Technique (2015)
Figure 39 Country Split (2015)
Figure 40 Nigeria: Surfactant EOR Market, By Technique (2015)
Figure 41 Angola: Surfactant EOR Market, By Technique (2015)
Figure 42 Rest of Africa: Surfactant EOR Market, By Technique (2015)
Figure 43 Colombia: Surfactant EOR Market, By Technique (2016-2021)
Figure 44 Venezuela: Surfactant EOR Market, By Technique (2015)
Figure 45 Brazil: Surfactant EOR Market, By Technique (2015)
Figure 46 Rest of Central & South America: Surfactant EOR Market, By Technique (2015)
Figure 47 The DOW Chemical Company: Company Snapshot
Figure 48 BASF SE: Company Snapshot
Figure 49 Shell Chemicals: Company Snapshot
Figure 50 Hunstman Corporation: Company Snapshot
Figure 51 Stepan Company: Company Snapshot
Figure 52 Halliburton Company: Company Snapshot
Figure 53 Sasol Ltd. : Company Snapshot
Figure 54 Oil Chem Technologies: Company Snapshot
Figure 55 Lubrizol Corporation: Company Snapshot
Figure 56 Solvay S.A.: Company Snapshot


Growth opportunities and latent adjacency in Surfactant EOR Market