TolueneĀMarket by Application and Derivative (Benzene and Xylene, Solvents, Gasoline Additive, Toluene Di-Isocyanate, Benzoic Acid, Trinitrotoluene, Andbenzaldehyde) - Global Forecast to 2021


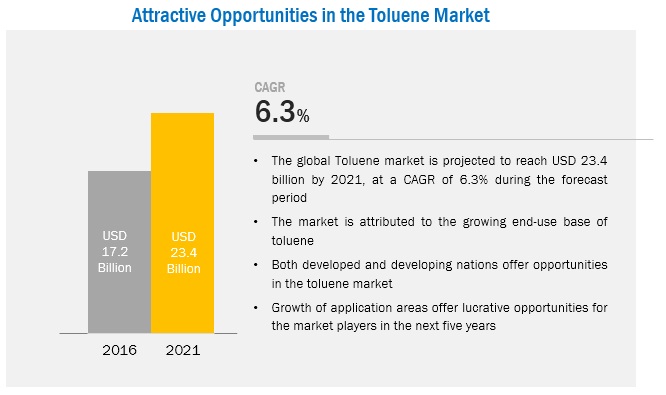
The toluene market is projected to reach USD 23.41 Billion by 2021, at a CAGR of 6.3%. In this report, 2015 is considered the base year and the forecast period is from 2016 to 2021.
The Objectives of Toluene Market Study are:
- To analyze and forecast the market size of toluene, in terms of value and volume
- To define, describe, and segment the global toluene market by application and derivative
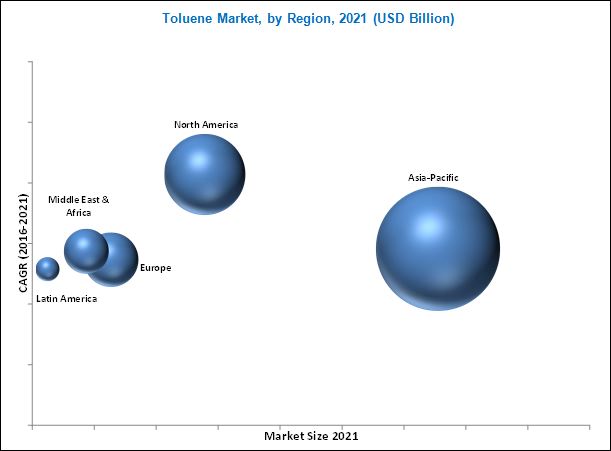
- To forecast the sizes of the market segments based on regions such as, Asia-Pacific, North America, Europe, Latin America, and the Middle East & Africa.
- To provide detailed information regarding the important factors influencing the growth of the market (drivers, restraints, and opportunities)
- To strategically analyze the segmented markets with respect to individual growth trends, prospects, and contribution to the overall market
- To identify and analyze opportunities for stakeholders in the market
- To analyze the market shares of major players in the toluene market
- To strategically profile key players and comprehensively analyze their core competencies
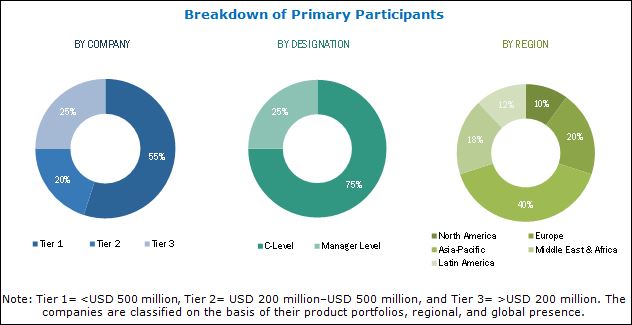
This research study involves the extensive use of secondary sources, directories, and databases (such as Hoovers, Bloomberg, BusinessWeek, and Factiva) to identify and collect information useful for this technical, market-oriented, and commercial study of the toluene market. The primary sources mainly include several industry experts from core and related industries and preferred suppliers, manufacturers, distributors, service providers, and organizations related to all segments of the industry’s supply chain. After arriving at the overall market size, the total market has been split into several segments and subsegments. The figure below illustrates the breakdown of the primary interviews based on company type, designation, and region conducted during the research study.
To know about the assumptions considered for the study, download the pdf brochure
The value chain for the toluene market consists of various stages such as, raw material procurement, manufacturers, distributors, and end-users. Naphtha is the main feedstock used for toluene. Light naphtha and heavy naphtha are the two main grades of naphtha that are produced after the distillation of crude oil. Naphtha accounts for the maximum share in terms of the feedstock used for producing toluene and other aromatics. Apart from naphtha, Coke Oven Light Oil (COLO) can also be used as an alternative for producing aromatics; however, because of the shortage of supply and the lower combustion value of these products, naphtha is the most commonly used raw material for the production of toluene and other aromatics. Apart from naphtha, coal, shale oil, and biomass (lignin) can also be used as raw materials for the production of toluene.
Target Audience in Toluene Market
- Toluene manufacturers
- Toluene dealers
- Toluene suppliers
- End users, raw material suppliers, and others
Toluene Market Report Scope
This report categorizes the global toluene market based on application and derivative; and region.
Toluene Market Segmentation, by Application and Derivative:
- Benzene and Xylene
- Solvents
- Gasoline Additives
- TDI
-
Others
- Trinitrotoluene
- Benzoic acid
- Benzaldehyde
Toluene Market Segmentation, by Region:
-
Asia-Pacific
- China
- South Korea
- India
- Japan
- Taiwan
- Singapore
- Malaysia
- Rest of Asia-Pacific
-
North America
- U.S.
- Canada
- Mexico
-
Europe
- Germany
- Russia
- France
- U.K.
- Spain
- Rest of Europe
-
Latin America
- Brazil
- Venezuela
- Colombia
- Argentina
- Rest of Latin America
-
Middle East & Africa
- Saudi Arabia
- Iran
- U.A.E.
- South Africa
- Rest of Middle East & Africa
Toluene Market Report Available Customizations
With the given market data, MarketsandMarkets offers customizations according to the company’s specific needs. The following customization options are available for the report:
Toluene Market Product Analysis
- Product matrix that gives a detailed comparison of the product portfolio of each company
Toluene Market Regional Analysis
- Further breakdown of a region with respect to a particular country
Toluene Market Company Information
- Detailed analysis and profiles of additional market players (Up to five)
The toluene market is projected to reach USD 23.41 Billion by 2021, at a CAGR of 6.3% from 2016 to 2021. The market is expected to be driven by the growing end-user base of toluene and its derivatives in various industries such as, building & construction, automotive, oil & gas, and consumer appliances, among others. The growing petrochemical industry in the Asia-Pacific region countries such as India, Taiwan, and Thailand has also opened new markets for toluene.
The toluene market is segmented by application and derivative; and region. The toluene market can be classified into application and derivative segments such as, benzene and xylene; solvents; gasoline additives; TDI; and others such as, trinitrotoluene, benzoic acid, and benzaldehyde. The benzene and xylene segment is projected to be the largest market of toluene due to the growing demand for its derivatives such as, Polystyrene (PS) and Polyethylene Terephthalate (PET) in various applications. This trend is projected to continue due to the increasing automobile and consumer appliances industry in the Asia-Pacific, and Middle Eastern & African regions.
The Asia-Pacific region, with its growing economies and rapidly expanding commercial and industrial bases, is projected to lead the toluene market from 2016 to 2021, both, in terms of value and volume. The toluene market in Europe and North America is consolidated, whereas the market in the Asia-Pacific region has a fragmented structure, where China, Japan, India, and South Korea are the leading players.
The TDI segment is expected to be the fastest growing market for toluene during the forecast period. It is majorly used in the production of PU foams, which are widely used in industries such as, oil & gas, building & construction, and automotive for insulating applications. Rising energy costs and greenhouse gas emissions have also prompted companies to improve energy efficiency in households and industrial buildings, which is leading to the growing use of PU foams as insulators in the building & construction industry. PU is also used in automobiles due to its light weight, which enables lowering fuel emissions. These unique characteristics of PU foams are expected to drive its demand in the automotive industry, which, in turn, drive the market for TDI, which is a major raw material for the production of PU.
Key Players in Toluene Market Industry
The major restraints in the toluene market are, the limitations in sourcing toluene, increasing demand for diesel as against gasoline, and the discovery of shale gas. The discovery of shale oil is a major opportunity for the market as it is richer in aromatic content than the conventional oil. The companies profiled in this report include, China Petroleum & Chemical Corporation (China), China National Petroleum Corporation (China), Exxon Mobil Corporation (U.S.), Covestro AG (Germany), BP P.L.C. (U.K.), SK Innovations (South Korea), BASF SE (Germany), GS Caltex (South Korea), Formosa Chemical & Fiber Corporation (Taiwan), Royal Dutch Shell (Netherlands), and CPC Corporation (Taiwan), among others.
Frequently Asked Questions (FAQ):
What is the Toluene Market growth?
Growth of Toluene Market - At a CAGR of 6.3% from 2015 to 2021.
Who leading market players in Toluene industry?
The global toluene market has a large number of market players; however the market is led by some of the major players, such as, China Petroleum & Chemical Corporation (China), China National Petroleum Corporation (China), Exxon Mobil Corporation (U.S.), Covestro AG (Germany), BP P.L.C. (U.K.), SK Innovations (South Korea), BASF SE (Germany), GS Caltex (South Korea), Formosa Chemical & Fiber Corporation (Taiwan), Royal Dutch Shell (Netherlands), and CPC Corporation (Taiwan), among others.
How big is the Toluene Market?
The global toluene market is projected to reach USD 23.41 Billion by 2021.
Which segments are covered in Toluene Market report?
By Application and Derivative (Benzene and Xylene, Solvents, Gasoline Additive, Toluene Di-Isocyanate, Benzoic Acid, Trinitrotoluene, Andbenzaldehyde).
To speak to our analyst for a discussion on the above findings, click Speak to Analyst
Table of Contents
1 Introduction (Page No. - 19)
1.1 Objectives of the Study
1.2 Market Definition
1.3 Scope of the Market
1.3.1 Markets Covered
1.3.2 Years Considered for the Report
1.3.3 Currency & Pricing
1.3.4 Package Size
1.4 Stakeholders
1.5 Limitations
2 Research Methodology (Page No. - 23)
2.1 Research Data
2.1.1 Secondary Data
2.1.1.1 Key Data From Secondary Sources
2.1.2 Primary Research
2.1.2.1 Key Data From Primary Sources
2.1.2.2 Key Industry Insights
2.2 Market Size Estimation
2.2.1 Bottom-Up Approach
2.2.2 Top-Down Approach
2.3 Data Triangulation
2.3.1 Assumptions
3 Executive Summary (Page No. - 32)
4 Premium Insights (Page No. - 38)
4.1 Attractive Growth Opportunities for Toluene Manufacturers in the Market
4.2 Global Toluene Market to Grow at Moderate Rate, By Volume
4.3 Asia-Pacific Toluene Market Scenario By Country and Application and Derivative
4.4 Leading Countries in the Global Toluene Market, 2015
4.5 Toluene Market Size, By Application and Derivative
5 Market Overview (Page No. - 43)
5.1 Introduction
5.2 Market Segmentation
5.2.1 By Application and Derivative
5.2.2 By Region
5.3 Market Dynamics
5.3.1 Drivers
5.3.1.1 Growing End User Base of Toluene
5.3.1.2 Growing Petrochemical (Aromatics) Industry in Asian Countries
5.3.1.2.1 Japan
5.3.1.2.2 India
5.3.1.2.3 Taiwan
5.3.1.2.4 Thailand
5.3.2 Restraints
5.3.2.1 Shifting Trends in Oil & Gas and Petrochemical (Aromatics) Industry
5.3.2.1.1 Limitations in Toluene’s Sources
5.3.2.1.2 Increasing Demand of Diesel Against Gasoline
5.3.2.1.3 Discovery of Shale Gas
5.3.3 Opportunities
5.3.3.1 Extraction of Aromatics From Shale Oil Or Tight Oil
5.4 Regulatory Framework
5.5 Market Share Analysis
6 Industry Trends (Page No. - 63)
6.1 Introduction
6.2 Value Chain Analysis
6.2.1 Raw Materials
6.2.2 Manufacturing Process
6.2.3 Distribution
6.2.4 End-Use Industries
6.3 Porter’s Five Forces Analysis
6.3.1 Bargaining Power of Buyers
6.3.2 Bargaining Power of Suppliers
6.3.3 Threat of New Entrants
6.3.4 Threat of Substitutes
6.3.5 Intensity of Competitive Rivalry
6.4 Pricing Analysis
6.4.1 Supply
6.4.2 Demand
6.4.3 Contracts
7 Toluene Market, By Application and Derivative (Page No. - 75)
7.1 Introduction
7.2 Market Analysis By Application and Derivative
7.2.1 Benzene and Xylene
7.2.2 Solvents
7.2.3 Gasoline Additives
7.2.4 TDI
7.2.5 Others
8 Toluene Market, By Region (Page No. - 80)
8.1 Introduction
8.2 Asia-Pacific
8.2.1 Overview
8.2.1.1 China
8.2.1.2 South Korea
8.2.1.3 India
8.2.1.4 Japan
8.2.1.5 Taiwan
8.2.1.6 Singapore
8.2.1.7 Malaysia
8.2.1.8 Rest of Asia-Pacific
8.3 North America
8.3.1 Overview
8.3.1.1 U.S.
8.3.1.2 Canada
8.3.1.3 Mexico
8.4 Europe
8.4.1 Overview
8.4.1.1 Germany
8.4.1.2 Russia
8.4.1.3 France
8.4.1.4 U.K.
8.4.1.5 Spain
8.4.1.6 Rest of Europe
8.5 Middle East & Africa
8.5.1 Overview
8.5.1.1 Saudi Arabia
8.5.1.2 Iran
8.5.1.3 U.A.E.
8.5.1.4 South Africa
8.5.1.5 Rest of Middle East & Africa
8.6 Latin America
8.6.1 Overview
8.6.1.1 Brazil
8.6.1.2 Venezuela
8.6.1.3 Colombia
8.6.1.4 Argentina
8.6.1.5 Rest of Latin America
9 Company Profiles (Page No. - 143)
(Overview, Financial*, Products & Services, Strategy, and Developments)
9.1 China Petroleum & Chemical Corporation
9.2 Exxon Mobil Corporation
9.3 Covestro AG
9.4 BP PLC
9.5 SK Innovation Co., Ltd
9.6 BASF SE
9.7 Royal Dutch Shell PLC
9.8 China National Petroleum Corporation
9.9 Formosa Chemicals & Fibre Corporation
9.10 CPC Corporation
9.11 Braskem SA
9.12 Indian Oil Corporation Limited
9.13 Lyondellbasell Industries NV
9.14 Mitsui Chemicals, Inc.
9.15 The DOW Chemical Company
9.16 Tosoh Corporation
9.17 Total SA
9.18 GS Caltex Corporation
9.19 Chevron Phillips Chemical Company LLC
9.20 Mitsubishi Chemical Corporation
9.21 NOVA Chemicals Corporation
9.22 Other Key Market Players
9.22.1 Oci Company Ltd.
9.22.2 Husky Energy Inc.
9.22.3 Marathon Petroleum Corp.
9.22.4 Valero Energy Corporation
9.22.5 Borsodchem
9.22.6 Vencorex
9.22.7 Reliance Industries Limited
9.22.8 Citgo Petroleum Corporation
9.22.9 Pemex
9.22.10 Flint Hill Resources, LP
*Details Might Not Be Captured in Case of Unlisted Companies
10 Appendix (Page No. - 204)
10.1 Insights From Industry Experts
10.2 Discussion Guide
10.3 Knowledge Store: Marketsandmarkets’ Subscription Portal
10.4 Introducing RT: Real-Time Market Intelligence
10.5 Available Customizations
10.6 Related Reports
10.7 Author Details
List of Tables (90 Tables)
Table 1 Polyethylene Terepthalate Statistics
Table 2 Polystyrene Statistics
Table 3 Paraxylene Statistics
Table 4 Benzene Statistics
Table 5 Xylene Statistics
Table 6 Benzene Statistics
Table 7 Paraxylene Statistics
Table 8 Consumption: Diesel vs Gasoline
Table 9 Shale Gas: Total Unproven Technically Recoverable Reserves (TCF)
Table 10 Shale Oil: Total Unproven Technically Recoverable Reserves (BB)
Table 11 Toluene Content By Various Manufacturing Processes
Table 12 Assessment of Alternative Raw Materials Used for Toluene Production
Table 13 Global Toluene Market Size, By Application and Derivative, 2014–2021 (KT)
Table 14 Global Toluene Market Size, By Application and Derivative, 2014–2021 (USD Million)
Table 15 Toluene Market Size, By Region, 2014–2021 (KT)
Table 16 Toluene Market Size, By Region, 2014–2021 (USD Million)
Table 17 Asia-Pacific: Toluene Market Size, By Country, 2014–2021 (KT)
Table 18 Asia-Pacific: Market Size, By Country, 2014–2021 (USD Million)
Table 19 Asia-Pacific: Market Size, By Application and Derivative, 2014–2021 (KT)
Table 20 Asia-Pacific: Market Size, By Application and Derivative, 2014–2021 (USD Million)
Table 21 China: Toluene Market Size, By Application and Derivative, 2014–2021 (KT)
Table 22 China: Market Size, By Application and Derivative, 2014–2021 (USD Million)
Table 23 South Korea: Toluene Market Size, By Application and Derivative, 2014–2021 (KT)
Table 24 South Korea: Market Size, By Application and Derivative, 2014–2021 (USD Million)
Table 25 India: Toluene Market Size, By Application and Derivative, 2014–2021 (KT)
Table 26 India: Market Size, By Application and Derivative, 2014–2021 (USD Million)
Table 27 Japan: Toluene Market Size, By Application and Derivative, 2014–2021 (KT)
Table 28 Japan: Market Size, By Application and Derivative, 2014–2021 (USD Million)
Table 29 Taiwan: Toluene Market Size, By Application and Derivative, 2014–2021 (KT)
Table 30 Taiwan: Market Size, By Application and Derivative, 2014–2021 (USD Million)
Table 31 Singapore: Toluene Market Size, By Application and Derivative, 2014–2021 (KT)
Table 32 Singapore: Market Size, By Application and Derivative, 2014–2021 (USD Million)
Table 33 Malaysia: Toluene Market Size, By Application and Derivative, 2014–2021 (KT)
Table 34 Malaysia: Market Size, By Application and Derivative, 2014–2021 (USD Million)
Table 35 Rest of Asia-Pacific: Toluene Market Size, By Application and Derivative, 2014–2021 (KT)
Table 36 Rest of Asia-Pacific: Market Size, By Application and Derivative, 2014–2021 (USD Million)
Table 37 North America: Toluene Market Size, By Country, 2014–2021 (KT)
Table 38 North America: arket Size, By Country, 2014–2021 (USD Million)
Table 39 North America: Toluene Market Size, By Application and Derivative, 2014–2021 (KT)
Table 40 North America: Market Size, By Application and Derivative, 2014–2021 (USD Million)
Table 41 U.S.: Toluene Market Size, By Application and Derivative, 2014–2021 (KT)
Table 42 U.S.: By Market Size, By Application and Derivative, 2014–2021 (USD Million)
Table 43 Canada: By Market Size, By Application and Derivative, 2014–2021 (KT)
Table 44 Canada: By Market Size, By Application and Derivative, 2014–2021 (USD Million)
Table 45 Mexico: By Market Size, By Application and Derivative, 2014–2021 (KT)
Table 46 Mexico: By Market Size, By Application and Derivative, 2014–2021 (USD Million)
Table 47 Europe: Toluene Market Size, By Country, 2014–2021 (KT)
Table 48 Europe: By Market Size, By Country, 2014–2021 (USD Million)
Table 49 Europe: By Market Size, By Application and Derivative, 2014–2021 (KT)
Table 50 Europe: By Market Size, By Application and Derivative, 2014–2021 (USD Million)
Table 51 Germany: Toluene Market Size, By Application and Derivative, 2014–2021 (KT)
Table 52 Germany: By Market Size, By Application and Derivative, 2014–2021 (USD Million)
Table 53 Russia: Toluene Market Size, By Application and Derivative, 2014–2021 (KT)
Table 54 Russia: By Market Size, By Application and Derivative, 2014–2021 (USD Million)
Table 55 France: By Market Size, By Application and Derivative, 2014–2021 (KT)
Table 56 France: By Market Size, By Application and Derivative, 2014–2021 (USD Million)
Table 57 U.K.: By Market Size, By Application and Derivative, 2014–2021 (KT)
Table 58 U.K.: By Market Size, By Application and Derivative, 2014–2021 (USD Million)
Table 59 Spain: Toluene Market Size, By Application and Derivative, 2014–2021 (KT)
Table 60 Spain: By Market Size, By Application and Derivative, 2014–2021 (USD Million)
Table 61 Rest of Europe: By Market Size, By Application and Derivative, 2014–2021 (KT)
Table 62 Rest of Europe: By Market Size, By Application and Derivative, 2014–2021 (USD Million)
Table 63 Middle East & Africa: Toluene Market Size, By Country, 2014–2021 (KT)
Table 64 Middle East & Africa: By Market Size, By Country, 2014–2021 (USD Million)
Table 65 Middle East & Africa: By Market Size, By Application and Derivative, 2014–2021 (KT)
Table 66 Middle East & Africa: By Market Size, By Application and Derivative, 2014–2021 (USD Million)
Table 67 Saudi Arabia: Toluene Market Size, By Application and Derivative, 2014–2021 (KT)
Table 68 Saudi Arabia: By Market Size, By Application and Derivative, 2014–2021 (USD Million)
Table 69 Iran: By Market Size, By Application and Derivative, 2014–2021 (KT)
Table 70 Iran: By Market Size, By Application and Derivative, 2014–2021 (USD Million)
Table 71 U.A.E.: By Market Size, By Application and Derivative, 2014–2021 (KT)
Table 72 U.A.E.: By Market Size, By Application and Derivative, 2014–2021 (USD Million)
Table 73 South Africa: Toluene Market Size, By Application and Derivative, 2014–2021 (KT)
Table 74 South Africa: By Market Size, By Application and Derivative, 2014–2021 (USD Million)
Table 75 Middle East & Africa: By Market Size, By Application and Derivative, 2014–2021 (KT)
Table 76 Middle East & Africa: By Market Size, By Application and Derivative, 2014–2021 (USD Million)
Table 77 Latin America: Toluene Market Size, By Country, 2014–2021 (KT)
Table 78 Latin America: By Market Size, By Country, 2014–2021 (USD Million)
Table 79 Latin America: By Market Size, By Application and Derivative, 2014–2021 (KT)
Table 80 Latin America: By Market Size, By Application and Derivative, 2014–2021 (USD Million)
Table 81 Brazil: Toluene Market Size, By Application and Derivative, 2014–2021 (KT)
Table 82 Brazil: By Market Size, By Application and Derivative, 2014–2021 (USD Million)
Table 83 Venezuela: Toluene Market Size, By Application and Derivative, 2014–2021 (KT)
Table 84 Venezuela: Market Size, By Application and Derivative, 2014–2021 (USD Million)
Table 85 Colombia: Toluene Market Size, By Application and Derivative, 2014–2021 (KT)
Table 86 Colombia: Market Size, By Application and Derivative, 2014–2021 (USD Million)
Table 87 Argentina: Toluene Market Size, By Application and Derivative, 2014–2021 (KT)
Table 88 Argentina: Market Size, By Application and Derivative, 2014–2021 (USD Million)
Table 89 Rest of Latin America: Toluene Market Size, By Application and Derivative, 2014–2021 (KT)
Table 90 Rest of Latin America: Market Size, By Application and Derivative, 2014–2021 (USD Million)
List of Figures (42 Figures)
Figure 1 Global Toluene Market: Research Design
Figure 2 Market Size Estimation: Bottom-Up Approach
Figure 3 Market Size Estimation: Top-Down Approach
Figure 4 Toluene Market: Data Triangulation
Figure 5 Benzene and Xylene to Dominate the Toluene Market During Forecast Period
Figure 6 TDI Projected to Be the Fastest-Growing Application and Derivative Segment for Toluene Market
Figure 7 North America Projected to Be Fastest-Growing Toluene Market During Forecast Period
Figure 8 Growing End-Use Base of Toluene to Drive the Market
Figure 9 Global Toluene Market: Moderate Growth Expected Between 2016 and 2021 in Terms of Volume
Figure 10 Toluene Market: Benzene and Xylene Accounts for the Largest Market Share
Figure 11 U.S. and Mexico Will Be the Fastest-Growing Market for Toluene
Figure 12 Benzene & Xylene Segment Dominates the Overall Toluene Market
Figure 13 Factors Affecting the Toluene Market
Figure 14 Impact of Drivers, Restraints, and Opportunities on Short-Term, Mid-Term, and Long-Term Basis
Figure 15 Manufacturing Stage Accounts for the Maximum Value Addition in Toluene Market
Figure 16 Capital Intensive Toluene Market Makes Rivalry Within Industry High
Figure 17 Asia-Pacific Market Snapshot
Figure 18 North America: Toluene Market Snapshot
Figure 19 Europe: Toluene Market Snapshot
Figure 20 Middle East & Africa: Toluene Market Snapshot
Figure 21 Latin America: Toluene Market Snapshot
Figure 22 China Petroleum & Chemical Corporation: Company Snapshot
Figure 23 Exxon Mobil Corporation: Company Snapshot
Figure 24 Covestro AG: Company Snapshot
Figure 25 BP PLC: Company Snapshot
Figure 26 SK Innovation Co., Ltd: Company Snapshot
Figure 27 BASF SE : Company Snapshot
Figure 28 Royal Dutch Shell PLC: Company Snapshot
Figure 29 China National Petroleum Corporation: Company Snapshot
Figure 30 Formosa Chemicals & Fibre Corporation: Company Snapshot
Figure 31 CPC Corporation: Company Snapshot
Figure 32 Braskem SA: Company Snapshot
Figure 33 Indian Oil Corporation Limited: Company Snapshot
Figure 34 Lyondellbasell Industries NV: Company Snapshot
Figure 35 Mitsui Chemical, Inc.: Company Snapshot
Figure 36 The DOW Chemical Company: Company Snapshot
Figure 37 Tosoh Corporation: Company Snapshot
Figure 38 Total SA: Company Snapshot
Figure 39 GS Caltex Corporation: Company Snapshot
Figure 40 Chevron Phillips Chemical Company LLC: Company Snapshot
Figure 41 Mitsubishi Chemical Corporation: Company Snapshot
Figure 42 NOVA Chemicals Corporation: Company Snapshot


Growth opportunities and latent adjacency in TolueneĀMarket