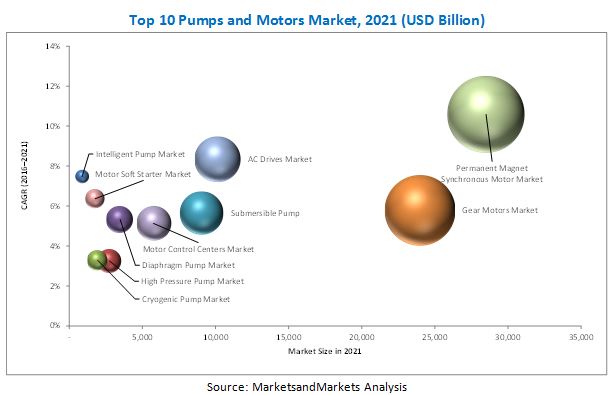
Top 10 Pumps and Motors Market Pumps (Intelligent Pump, High Pressure Pump, Cryogenic Pump, Diaphragm Pump, Submersible Pump), Motors (Gear Motor, Permanent Magnet Synchronous, Motor Control Center, Motor Soft Starter, & AC Drives) - Global Forecast to 2021


[246 Pages Report] The Top 10 pumps and motors market is expected to grow from an estimated USD 71.01 billion in 2016 to USD 100.66 billion by 2021. Factors such as upgradation of old power infrastructure, increased investments in renewable energy, increasing industrialization, and growing urban population are driving the market worldwide.
Objectives of the study
- To show the top line key findings in the global Top 10 pumps and motors market based on region and end-user.
- To estimate the market size, in terms of value, of the Top 10 pumps and motors market
- To provide detailed information regarding major factors influencing market growth (drivers, restraints, opportunities, and industry-specific challenges)
- To forecast the growth of the Top 10 pumps and motors market with respect to end-user and the main regions (Asia-Pacific, Europe, North America, South America and the Middle East & Africa)
- To analyze major stakeholders in the market and provide details regarding the competitive landscape for key market leaders
- To strategically identify and profile global as well as local players in the Top 10 pumps and motors market and comprehensively analyze their market ranking and core competencies
- To analyze competitive developments such as new product launches, mergers & acquisitions, expansions, and supply contracts in the Top 10 pumps and motors market
The years considered for the study are as follows:
- Historical Year: 2014
- Base Year: 2015
- Estimated Year: 2016
- Projected Year: 2021
- Forecast Period: From 2016 to 2021
For company profiles in the report, 2015 has been used as the base year. Wherever recent (2015) data was unavailable, the previous year�s (2014) data has been included.
Research Methodology
This research study involved extensive usage of secondary sources, directories, and databases (such as Hoovers, Bloomberg, Businessweek, and Factiva) to identify and collect information useful for this technical, market-oriented, and commercial study of pumps and motors. The points mentioned below explain the research methodology applied in making this report.
* Core competencies of the companies are captured in terms of their key developments, SWOT analysis, and key strategies adopted by them to sustain their position in the market.
- Study of annual revenue and market developments of major players providing pumps and motors
- Analysis of major applications of and demand for pumps and motors from end-users
- Assessment of future trends and growth of end-users
- Assessment of the pump s and motors market with respect to the types used for different applications
- Study of contracts & developments related to Top 10 pumps and motors by key players across different regions
- Finalization of overall market sizes by triangulating the supply-side data, which includes product developments, supply chain, and annual revenues of companies manufacturing Top 10 pumps and motors across the globe
After arriving at the overall market size, the total market has been split into segments such as end-user and region. The figure given below shows the breakdown of the primaries on the basis of company type, designation, and region, conducted during the research study.
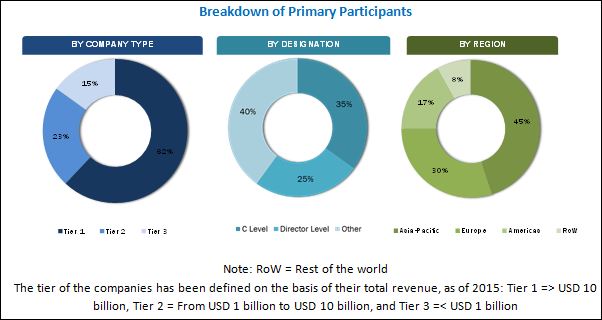
To know about the assumptions considered for the study, download the pdf brochure
Stakeholders
The stakeholders included in this report are as follows:
- AC drives manufacturers, dealers, and suppliers
- Consulting companies in the energy and power sector
- Government and research organizations
- Consulting companies of oil & gas industry
- Oil & Gas associations
- Investment banks
- Manufacturing industry
- Investors/Shareholders
- Environmental research institutes
- Process industries and power & energy associations
- Petroleum companies
- Cryogenic pump manufacturing companies
- Cryogenic gases/liquid merchant producers, suppliers, and dealers
- Cryogenic plant developers and service providers
- LNG dealers
- Oil & gas companies
- Diaphragm pump manufacturers
- Suppliers of raw materials, parts, and components to the diaphragm pump industry
- Manufacturers and equipment-users associations and groups
- Manufacturers of motors and other drive systems for diaphragm pumps
- Cryogenic and cold storage associations
- Power and energy associations
- Water industry forum
- Power distribution utilities
- High pressure pumps manufacturing companies
- Gear motors manufacturing companies
- Suppliers of related raw materials
- Submersible pump manufacturers
- Consulting companies in the E&P sector
- Digital oilfield service providers
- HVAC system providers
- Intelligent motor controller manufacturers, dealers, and suppliers
- Motor control center manufacturers, dealers, and suppliers
- Consulting companies in the energy & power sector
- Soft starter manufacturers
- Permanent magnet synchronous motor manufacturers, dealers, and suppliers
- Electric and efficient motor associations
- Permanent magnet synchronous motor component manufacturers
�The study answers several questions for the stakeholders, primarily which market segments to focus in the next 2�5 years for prioritizing efforts and investments.�
Get online access to the report on the World's First Market Intelligence Cloud
Request Sample Scope of the Report

- Pumps
- Intelligent Pumps
- High pressure pumps
- Cryogenic pumps
- Diaphragm pumps
- Submersible pumps
- Motors
- Gear motors
- Permanent magnet synchronous motors
- Motor control center
- Motor soft starters
- AC drives
- End-User*
- By Region
- Asia-Pacific
- Europe
- North America
- South America
- Middle East and Africa
*End-User varies for each type of pump and motor
Available Customizations
With the given market data, MarketsandMarkets offers customizations as per the client�s specific needs. The following customization options are available for the report:
- Detailed analysis and profiling of additional market players (Upto 5)
The Top 10 pumps and motors market is expected to grow from an estimated USD 71.01 Billion in 2016 to USD 100.66 Billion by 2021. Factors such as upgradation of old power infrastructure, increased investments in renewable energy, increasing industrialization, and growing urban population are driving the market globally.
The report segments the Top 10 pumps and motors market based on end-user and region. The pumps market includes intelligent pumps, high pressure pumps, cryogenic pumps, diaphragm pumps, and submersible pumps. The motors market includes gear motors, motor control centers, motor soft starter, permanent magnet synchronous motors, and AC drives.
The submersible pump segment was the largest market in 2015. Factors such as a positive shift in living standards would lead to demand for improved hygiene and sanitation requirements. This growth in demand for water in terms of both quantity as well as quality as per government municipal regulations will drive the need for submersible pumps. Continued construction and economic development activities (industrial and commercial) across the globe coupled with rising population, increased investments in infrastructure, especially in the water & wastewater and mining & construction sectors would spur growth in the market for submersible pumps.
In this report, the Top 10 pumps and motors market has been analyzed with respect to the following regions, namely, Asia-Pacific, Europe, North America, South America, and Middle East & Africa. In the Asia-Pacific, the market growth for Top 10 pumps and motors can be attributed to factors such as focus on energy efficiency, increasing industrialization, and growing urban population, among others. Factors such as increasing gas-based generation, development in water and wastewater & sanitation sector also aids in the market growth.
The demand for pumps and motors can be directly linked to the growing demand for HVAC control systems. The demand for these products is also driven by growth in renewable power generation and upgradation of old power infrastructure. However, factors such as high initial cost of motors, high maintenance cost, and decrease in greenfield investment could restrain growth. On the other hand, development in power generation facilities and development of digital oilfields represent promising growth opportunities for the market.
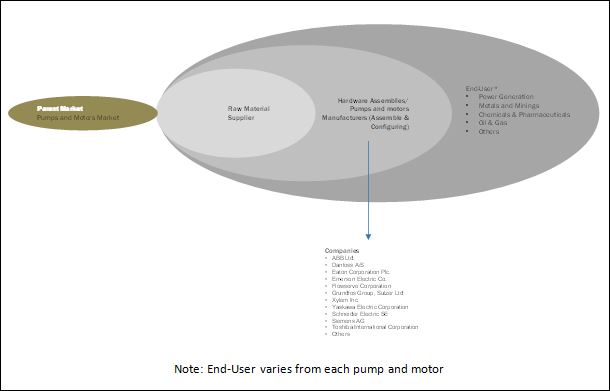
Some of the leading players in the Top 10 pumps and motors market include ABB Ltd. (Switzerland), Danfoss A/S (Denmark), Eaton Corporation Plc. (Ireland), Emerson Electric Co. (U.S.), Flowserve Corporation (U.S.), Grundfos Group (Denmark), Sulzer Ltd (Switzerland), Xylem Inc. (U.S.), Yaskawa Electric Corporation (Japan), Schneider Electric SE (France), Siemens AG (Germany), and Toshiba International Corporation (Japan), among others. New product launches was the most common strategy adopted by the top players in the market, constituting more than fifty percent of the total development share. It was followed by contracts & agreements, expansions and mergers & acquisitions, respectively.
To speak to our analyst for a discussion on the above findings, click Speak to Analyst
Table of Contents
1 Introduction (Page No. - 21)
1.1 Objectives of the Study
1.2 Market Definition
1.2.1 Intelligent Pumps
1.2.2 High Pressure Pumps
1.2.3 Cryogenic Pumps
1.2.4 Diaphragm Pumps
1.2.5 Submersible Pumps
1.2.6 Gear Motors
1.2.7 Motor Control Centers
1.2.8 AC Drives
1.2.9 Motor Soft Starters
1.2.10 Permanent Magnet Synchronous Motors
1.3 Market Scope
1.3.1 Pump: Markets Covered
1.3.2 Motor: Markets Covered
1.3.3 Years Considered for the Study
1.4 Currency
1.5 Limitations
1.6 Stakeholders for Pumps and Motors*
2 Research Methodology (Page No. - 27)
2.1 Introduction
2.1.1 Secondary Data
2.1.1.1 Key Data From Secondary Sources
2.1.2 Primary Data
2.1.2.1 Key Data From Primary Sources
2.1.2.2 Breakdown of Primaries
2.2 Market Size Estimation
2.3 Market Breakdown & Data Triangulation
2.4 Research Assumptions
2.4.1 Assumptions
3 Executive Summary (Page No. - 33)
3.1 Introduction
3.2 Current Scenario
3.3 Future Outlook
3.4 Conclusion
4 Pumps and Motors Market (Page No. - 43)
4.1 Introduction
4.2 Intelligent Pumps
4.2.1 Market Dynamics
4.2.1.1 Drivers
4.2.1.1.1 Focus on Energy Efficiency
4.2.1.1.2 Growth in IIOT & Economic Benefits of Intelligent Systems
4.2.1.2 Restraints
4.2.1.2.1 High Capital Cost
4.2.1.3 Opportunities
4.2.1.3.1 Robust Growth in Hvac Systems
4.2.1.3.2 Development of Digital Oilfields
4.2.1.3.3 Upcoming Smart Cities
4.2.1.4 Challenges
4.2.1.4.1 Downturn in the Mining Industry
4.2.2 Global Intelligent Pump Market
4.2.2.1 Europe
4.2.2.2 North America
4.2.2.3 Asia-Pacific
4.2.2.4 Middle East
4.2.2.5 South America
4.3 High Pressure Pumps
4.3.1 Market Dynamics
4.3.1.1 Drivers
4.3.1.1.1 Investments in Sectors Other Than Oil & Gas in the Middle East
4.3.1.1.2 Growth of Manufacturing Sector in South Asia
4.3.1.2 Restraints
4.3.1.2.1 Slowdown in Oil & Gas Industry
4.3.1.2.2 Slowing Industrial Growth in China
4.3.1.3 Opportunities
4.3.1.3.1 Carbon Capture and Sequestration
4.3.1.3.2 Wastewater Treatment Industry
4.3.1.4 Challenges
4.3.1.4.1 Growing Gray Market
4.3.2 Global High Pressure Pumps Market
4.3.2.1 Europe
4.3.2.2 North America
4.3.2.3 Asia-Pacific
4.3.2.4 Middle East
4.3.2.5 Africa
4.3.2.6 South America
4.4 Cryogenic Pumps
4.4.1 Market Dynamics
4.4.1.1 Drivers
4.4.1.1.1 Increasing Gas-Based Generation
4.4.1.1.2 Rising Demand for Medical Gases
4.4.1.2 Restraints
4.4.1.2.1 Decrease in Global Steel Production
4.4.1.2.2 Decreasing Capital Expenditure in the Semiconductor Manufacturing Industry
4.4.1.3 Opportunities
4.4.1.3.1 Growing Focus Towards Solar Power Generation
4.4.1.3.2 Increasing Infrastructure Spending
4.4.1.4 Challenges
4.4.1.4.1 Technological Advancements in Turbomolecular Pumps
4.4.1.4.2 Downturn in the Oil & Gas Industry
4.4.2 Global Cryogenic Pumps Market
4.4.2.1 Europe
4.4.2.2 North America
4.4.2.3 Asia-Pacific
4.4.2.4 Middle East
4.4.2.5 Africa
4.4.2.6 South America
4.5 Diaphragm Pumps
4.5.1 Market Dynamics
4.5.1.1 Drivers
4.5.1.1.1 Development in Water, Wastewater, & Sanitation Sector
4.5.1.1.2 Demand for Diaphragm Pumps in the Chemical Industry
4.5.1.2 Restraints
4.5.1.2.1 Problems Associated With Pulsation
4.5.1.3 Opportunities
4.5.1.3.1 Growing Pharmaceutical Industry
4.5.1.3.2 Development of Power Generation Facilities
4.5.1.4 Challenges
4.5.1.4.1 Slowdown in the Oil & Gas Industry
4.5.1.4.2 Downturn in the Mining Industry
4.5.2 Global Diaphragm Pumps Market
4.5.2.1 Europe
4.5.2.2 North America
4.5.2.3 Asia-Pacific
4.5.2.4 Middle East & Africa
4.5.2.5 South America
4.6 Submersible Pumps
4.6.1 Market Dynamics
4.6.1.1 Drivers
4.6.1.1.1 Increasing Urbanized Population
4.6.1.1.2 Increasing Industrialization
4.6.1.1.3 Growing Infrastructure Investments
4.6.1.2 Restraints
4.6.1.2.1 Submersible Motor Failure & High Troubleshooting Cost
4.6.1.3 Opportunities
4.6.1.3.1 New Oilfield Discoveries
4.6.1.4 Challenges
4.6.1.4.1 Application of Submersible Pump in the Presence of Excess Air at A Pump Intake is A Challenge
4.6.2 Global Submersible Pump Market
4.6.2.1 Europe
4.6.2.2 North America
4.6.2.3 Asia-Pacific
4.6.2.4 Middle East & Africa
4.6.2.5 South America
4.7 Gear Motors
4.7.1 Market Dynamics
4.7.1.1 Drivers
4.7.1.1.1 Modular & Compact Design
4.7.1.1.2 Mechanical Simplicity
4.7.1.1.3 Growth of the Renewable Energy Sector
4.7.1.2 Restraints
4.7.1.2.1 High Maintenance Cost
4.7.1.2.2 Use of Direct Drives & Variable Speed Drives
4.7.1.3 Opportunities
4.7.1.3.1 Development of Hybrid Technology
4.7.1.4 Challenges
4.7.1.4.1 Gray Market
4.7.1.4.2 High Manufacturing Cost
4.7.2 Global Gear Motors Market
4.7.2.1 Europe
4.7.2.2 North America
4.7.2.3 Asia-Pacific
4.7.2.4 Middle East & Africa
4.7.2.5 South America
4.8 AC Drives
4.8.1 Market Dynamics
4.8.1.1 Drivers
4.8.1.1.1 Increasing Urbanization & Industrialization
4.8.1.1.2 Rising Need for Energy Efficiency
4.8.1.1.3 Regulations on Energy Efficiency
4.8.1.2 Restraints
4.8.1.2.1 Slump in Oil Prices
4.8.1.3 Opportunities
4.8.1.3.1 Huge Opportunity in the Replacement Sector
4.8.1.3.2 Industrial Internet of Things (IIOT)
4.8.1.4 Challenges
4.8.1.4.1 Regional Level Competition From Local Players
4.8.2 Global AC Drives Market
4.8.2.1 Europe
4.8.2.2 North America
4.8.2.3 Asia-Pacific
4.8.2.4 Middle East & Africa
4.8.2.5 South America
4.9 Motor Soft Starter
4.9.1 Market Dynamics
4.9.1.1 Drivers
4.9.1.1.1 Increasing Demand of Industrial Pumps
4.9.1.1.2 Growing Demand of Hvac Control System Market
4.9.1.1.3 Cost Effectiveness & Minimal Space Requirements
4.9.1.2 Restraints
4.9.1.2.1 Functional Superiority of VFD
4.9.1.2.2 Competitive Pricing of VFD in Low Voltage Segment
4.9.1.3 Opportunities
4.9.1.3.1 Applications Employing Large Number of Motors
4.9.1.3.2 Fixed Speed Applications
4.9.1.4 Challenges
4.9.1.4.1 Growing Focus on Renewable Energy
4.9.2 Global Motor Soft Starter Market
4.9.2.1 Europe
4.9.2.2 North America
4.9.2.3 Asia-Pacific
4.9.2.4 Middle East & Africa
4.9.2.5 South America
4.10 Permanent Magnet Synchronous Motors
4.10.1 Market Dynamics
4.10.1.1 Drivers
4.10.1.1.1 Increasing Demand for Energy-Efficient Motors
4.10.1.1.2 Use of Low-Cost Ferrite Permanent Magnets
4.10.1.1.3 Low Power Consumption
4.10.1.1.4 Increased Demand for Pmsm in the Industrial Sector
4.10.1.1.5 Use of Pmsm in the Mining & Metal Industry
4.10.1.2 Restraints
4.10.1.2.1 High Initial Cost of the Motors
4.10.1.2.2 Induction Motor as A Cost-Effective Substitute
4.10.1.3 Opportunities
4.10.1.3.1 Demand for Pmsm in Railway Vehicles
4.10.1.3.2 Depleting Energy Resources
4.10.1.4 Challenges
4.10.1.4.1 Scarcity of Rare Earth Magnets
4.10.2 Global Permanent Magnet Synchronous Motor Market
4.10.2.1 Europe
4.10.2.2 North America
4.10.2.3 Asia-Pacific
4.10.2.4 Middle East & Africa
4.10.2.5 South America
4.11 Motor Control Center
4.11.1 Market Dynamics
4.11.1.1 Drivers
4.11.1.1.1 Growing Demand for Industrial Automation in Developed Regions
4.11.1.1.2 Regulations Promoting Energy Savings Across Major Industries
4.11.1.1.3 Increased Industrial Plant Uptime
4.11.1.2 Restraints
4.11.1.2.1 Decreasing Greenfield Investments
4.11.1.3 Opportunities
4.11.1.3.1 Increasing Urbanization & Industrialization
4.11.1.3.2 Upgradation of Industrial Infrastructure in Developed Countries
4.11.1.4 Challenges
4.11.1.4.1 High Level of Complexity Involved in the Maintenance of Motor Control Centers
4.11.2 Global Motor Control Center Market
4.11.2.1 Europe
4.11.2.2 North America
4.11.2.3 Asia-Pacific
4.11.2.4 Middle East & Africa
4.11.2.5 South America
5 Competitive Landscape (Page No. - 137)
5.1 Overview
5.2 Competitive Situations & Trends
5.3 Market Ranking for Pumps and Motors Market, 2015
5.4 New Product Development
5.5 Contracts and Agreement
5.6 Expansions
5.7 Merger & Acquisition
5.8 Other Developments
6 Company Profile (Page No. - 148)
(Overview, Products & Services, Strategies & Insights, Developments and MnM View)*
6.1 Introduction
6.2 ABB Ltd.
6.3 Danfoss A/S
6.4 Eaton Corporation PLC.
6.5 Emerson Electric Co.
6.6 Flowserve Corporation
6.7 General Electric
6.8 Grundfos Group
6.9 Mitsubishi Electric Corporation
6.10 Rockwell Automation Inc.
6.11 Siemens AG
6.12 Sulzer Ltd.
6.13 Toshiba International Corporation
6.14 WEG SA
6.15 Xylem Inc.
6.16 Yaskawa Electric Corporation
6.17 ITT Corporation
6.18 Colfax Corporation
6.19 Kirloskar Brothers Ltd.
6.20 Regal Beloit Corporation
6.21 KSB Aktiengesellschaft
6.22 Seepex GmbH
6.23 Wilo SE
6.24 Grunwl
6.25 KSB Group
6.26 Ebara Corporation
6.27 Atlas Copco Ab
6.28 Halliburton Company
6.29 The Gorman-Rupp Company
6.30 Tsurumi Manufacturing Co., Ltd.
6.31 ITT Goulds Pumps
6.32 Toyo Denki Industrial Co., Ltd.
6.33 Walrus Pump Co., Ltd.
6.34 Andritz
6.35 GEA Group
6.36 The Weir Group PLC
6.37 Cat Pumps
6.38 Comet S.P.A
6.39 Maximator GmbH
6.40 Teledyne Isco
6.41 Zhejiang Danau Industries Co., Ltd
6.42 Udor S.P.A
6.43 Sumitomo Heavy Industries Ltd.
6.44 Fives S.A.
6.45 Brooks Automation Inc.
6.46 Global Technologies
6.47 Cryoquip Australia
6.48 Cryostar SAS
6.49 Nikkiso Cryo Inc
6.50 Phpk Technologies Inc.
6.51 Ruhrpumpen Inc.
6.52 Technex Limited
6.53 ACD LLC
6.54 Sehwa Tech Inc.
6.55 Pump Solutions Group (PSG)
6.56 Idex Corporation
6.57 Yamada Corporation
6.58 Lewa GmbH
6.59 Verder International B.V.
6.60 Ingersoll-Rand PLC
6.61 Tapflo Ab
6.62 Leak-Proof Pumps (I) Pvt. Ltd.
6.63 Schneider Electric SE
6.64 Fuji Electric Co. Ltd.
6.65 Hitachi Ltd.
6.66 Parker Hannifin Corporation
6.67 Baldor Electric Company
6.68 Sew-Eurodrive GmbH & Co. Kg
6.69 Winergy
6.70 Bonfiglioli Riduttori S.P.A.
6.71 Brevini Power Transmission S.P.A.
6.72 China High Speed Transmission Equipment Group Co. Ltd.
6.73 Elecon Engineering Company Ltd.
6.74 Johnson Electric Holdings Limited
6.75 Sumitomo Heavy Industries Ltd.
6.76 Bauer Gear Motor GmbH
6.77 Watt Drive Antriebstechnik GmbH
6.78 Vidhyut Control India Pvt. Ltd.
6.79 Gemco Controls Ltd.
6.80 Sun-Tech Engineers
6.81 Rolla Ltd.
6.82 Technical Control System Limited
6.83 Littelfuse Inc.
6.84 Crompton Greaves Limited
6.85 Fairford Electronics Ltd.
6.86 Alstom SA
6.87 Meidensha Corporation
6.88 DRS Technologies
6.89 Hansen Corporation
6.90 Zhejiang Zhongyuan Electric Co., Ltd.
*Details on Overview, Products & Services, Strategies & Insights, Developments and MnM View Might Not Be Captured in Case of Unlisted Companies.
7 Appendix (Page No. - 239)
7.1 Key Industry Insights
7.2 Introducing Rt: Real-Time Market Intelligence
7.3 Available Customizations
7.4 Complete Syndicated Reports
7.5 Knowledge Store: Marketsandmarkets� Subscription Portal
7.6 Author Details
List of Tables (85 Tables)
Table 1 Energy-Efficiency Measures By Leading Regions/Countries
Table 2 Intelligent Pump Market Size, By Region, 2014�2021 (USD Million)
Table 3 Europe: Intelligent Pump Market Size, By End-User, 2014�2021 (USD Million)
Table 4 North America: Intelligent Pump Market Size, By End-User, 2014�2021 (USD Million)
Table 5 Asia-Pacific: Intelligent Pump Market Size, By End-User, 2014�2021 (USD Million)
Table 6 Middle East & Africa: Intelligent Pump Market Size, By End-User, 2014�2021 (USD Million)
Table 7 South America: Intelligent Pump Market Size, By End-User, 2014�2021 (USD Million)
Table 8 High Pressure Pump Market Size, By Region, 2014�2021 (USD Million)
Table 9 Europe: High Pressure Pump Market Size, By End-User, 2014�2021 (USD Million)
Table 10 North America: High Pressure Pump Market Size, By End-User, 2014�2021 (USD Million)
Table 11 Asia-Pacific: High Pressure Pump Market Size, By End-User, 2014�2021 (USD Million)
Table 12 Middle East: High Pressure Pump Market Size, By End-User, 2014�2021 (USD Million)
Table 13 Africa: High Pressure Pump Market Size, By End-User, 2014�2021 (USD Million)
Table 14 South America: High Pressure Pump Market Size, By End-User, 2014�2021 (USD Million)
Table 15 Cryogenic Pump Market Size, By Region, 2014�2021 (USD Million)
Table 16 Europe: Cryogenic Pump Market Size, By End-User, 2014�2021 (USD Million)
Table 17 North America: Cryogenic Pump Market Size, By End-User, 2014�2021 (USD Million)
Table 18 Asia-Pacific: Cryogenic Pump Market Size, By End-User, 2014�2021 (USD Million)
Table 19 Middle East: Cryogenic Pump Market Size, By End-User, 2014�2021 (USD Million)
Table 20 Africa: Cryogenic Pump Market Size, By End-User, 2014�2021 (USD Million)
Table 21 South America: Cryogenic Pump Market Size, By End-User, 2014�2021 (USD Million)
Table 22 Development in Water, Wastewater, & Sanitation Sector is A Key Factor Driving the Diaphragm Pumps Market
Table 23 Problems Associated With Pulsation are Restraining the Growth of the Diaphragm Pumps Market
Table 24 Growing Pharmaceutical Industry is an Opportunity for the Diaphragm Pumps Market
Table 25 Downturn in the Oil & Gas and Mining Industries is A Challenge of the Diaphragm Pumps Market
Table 26 Diaphragm Pumps Market Size, By Region, 2014�2021 (USD Million)
Table 27 Europe: Diaphragm Pumps Market Size, By End-User, 2014�2021 (USD Million)
Table 28 North America: Diaphragm Pumps Market Size, By End-User, 2014�2021 (USD Million)
Table 29 Asia-Pacific: Diaphragm Pumps Market Size, By End-User, 2014�2021 (USD Million)
Table 30 Middle East & Africa: Diaphragm Pumps Market Size, By End-User, 2014�2021 (USD Million)
Table 31 South America: Diaphragm Pumps Market Size, By End-User, 2014�2021 (USD Million)
Table 32 Asia-Pacific Urbanization Prospects
Table 33 Increasing Urbanization, Industrialization, & Infrastructure Investments are Propelling the Growth of the Submersible Pumps Market
Table 34 Submersible Motor Failure and High Troubleshooting Cost Restrain Market Growth
Table 35 Application of Submersible Pump in the Presence of Excess Air at A Pump Intake is A Challenge
Table 36 Submersible Pump Market Size, By Region, 2014�2021 (USD Million)
Table 37 Europe: Submersible Pumps Market Size, By End-User, 2014�2021 (USD Million)
Table 38 North America: Submersible Pumps Market Size, By End-User, 2014�2021 (USD Million)
Table 39 Asia-Pacific: Submersible Pumps Market Size, By End-User, 2014�2021 (USD Million)
Table 40 Middle East & Africa: Submersible Pumps Market Size, By End-User 2014�2021 (USD Million)
Table 41 South America: Submersible Pumps Market Size, By End-User, 2014�2021 (USD Million)
Table 42 The Modular & Compact Design of Gear Motors is the Key Factor Driving the Market
Table 43 High Maintenance Cost Could Restrain the Growth of the Gear Motors Market
Table 44 Development of Hybrid Technology is an Opportunity for the Gear Motors Market
Table 45 Gray Market is A Challenge for the Gear Motors Market
Table 46 Gear Motors Market Size, By Region, 2014�2021 (USD Million)
Table 47 Europe: Gear Motors Market Size, By End-User, 2014�2021 (USD Million)
Table 48 North America: Gear Motors Market Size, By End-User, 2014�2021 (USD Million)
Table 49 Asia-Pacific: Gear Motors Market Size, By End-User, 2014�2021 (USD Million)
Table 50 Middle East & Africa: Gear Motors Market Size, By End-User, 2014�2021 (USD Million)
Table 51 South America: Gear Motors Market Size, By End-User, 2014�2021 (USD Million)
Table 52 AC Drives Market Size, By Region, 2014�2021 (USD Million)
Table 53 Europe: AC Drives Market Size, By End-User, 2014�2021 (USD Million)
Table 54 North America: AC Drives Market Size, By End-User, 2014�2021 (USD Million)
Table 55 Asia-Pacific: AC Drives Market Size, By End-User, 2014�2021 (USD Million)
Table 56 Middle East & Africa: AC Drives Market Size, By End-User, 2014�2021 (USD Million)
Table 57 South America: AC Drives Market Size, By End-User, 2014�2021 (USD Million)
Table 58 Motor Soft Starter Market Size, By Region, 2014�2021 (USD Million)
Table 59 Europe: Motor Soft Starter Market Size, By End-User, 2014�2021 (USD Million)
Table 60 North America: Motor Soft Starter Market Size, By End-User, 2014�2021 (USD Million)
Table 61 Asia-Pacific: Motor Soft Starter Market Size, By End-User, 2014�2021 (USD Million)
Table 62 Middle East & Africa: Motor Soft Starter Market Size, By End-User, 2014�2021 (USD Million)
Table 63 South America: Motor Soft Starter Market Size, By End-User, 2014�2021 (USD Million)
Table 64 Permanent Magnet Synchronous Motor Market Size, By Region, 2014�2021 (USD Million)
Table 65 Europe: Permanent Magnet Synchronous Market Size, By End-User, 2014�2021 (USD Million)
Table 66 North America: Permanent Magnet Synchronous Market Size, By End-User, 2014�2021 (USD Million)
Table 67 Asia-Pacific: Permanent Magnet Synchronous Market Size, By End-User, 2014�2021 (USD Million)
Table 68 Middle East & Africa: Permanent Magnet Synchronous Market Size, By End-User, 2014�2021 (USD Million)
Table 69 South America: Permanent Magnet Synchronous Market Size, By End-User, 2014�2021 (USD Million)
Table 70 Motor Control Centers Market Size, 2014�2021 (USD Million)
Table 71 Europe: Motor Control Centers Market Size, By End-User, 2014�2021 (USD Million)
Table 72 Europe: Motor Control Centers Market Size, By Industrial End-User, 2014�2021 (USD Million)
Table 73 North America: Motor Control Centers Market Size, By End-User, 2014�2021 (USD Million)
Table 74 North America: Motor Control Centers Market Size, By Industrial, End-User, 2014�2021 (USD Million)
Table 75 Asia-Pacific: Motor Control Centers Market Size, By End-User, 2014�2021 (USD Million)
Table 76 Asia-Pacific: Motor Control Centers Market Size, By Industrial, End-User, 2014�2021 (USD Million)
Table 77 Middle East & Africa: Motor Control Centers Market Size, By End-User, 2014�2021 (USD Million)
Table 78 Middle East & Africa: Motor Control Centers Market Size, By Industrial End-User, 2014�2021 (USD Million)
Table 79 South America: Motor Control Centers Market Size, By End-User, 2014�2021 (USD Million)
Table 80 South America: Motor Control Centers Market Size, By Industrial End-User, 2014�2021 (USD Million)
Table 81 New Product Development
Table 82 Contracts and Agreements
Table 83 Expansions
Table 84 Mergers & Acquisition
Table 85 Others Developments
List of Figures (68 Figures)
Figure 1 Pumps and Motors Market: Research Design
Figure 2 Breakdown of Primary Interviews: By Company Type, Designation, & Region
Figure 3 Data Triangulation Methodology
Figure 4 Market Size for Pumps and Motors in 2015 (USD Million)
Figure 5 Market Size for Pumps 2015, 2016 & 2021 (USD Million)
Figure 6 Market Size for Motors 2015, 2016 & 2021 (USD Million)
Figure 7 Market Opportunities for Intelligent Pumps Market During the Forecast Period,2016�2021 (USD Million)
Figure 8 Market Opportunities for High Pressure Pumps During the Forecast Period, 2016�2021 (USD Million)
Figure 9 Market Opportunities for Cryogenic Pumps During the Forecast Period, 2016�2021 (USD Million)
Figure 10 Market Opportunities for Diaphragm Pumps During the Forecast Period, 2016�2021 (USD Million)
Figure 11 Market Opportunities for Submersible Pumps During the Forecast Period, 2016�2021 (USD Million)
Figure 12 Market Opportunities for Gear Motors During the Forecast Period, 2016�2021 (USD Billion)
Figure 13 Market Opportunities for Permanent Magnet Synchronous Motor During the Forecast Period, 2016-2021 (USD Million)
Figure 14 Market Opportunities for Motor Control Center During the Forecast Period, 2016�2021 (USD Million)
Figure 15 Market Opportunities for Motor Soft Starter During the Forecast Period, 2016�2021 (USD Million)
Figure 16 Market Opportunities for AC Drives During the Forecast Period, 2016�2021 (USD Million)
Figure 17 Motors Market By End User in USD Million, 2015
Figure 18 Pumps Market By End User in USD Million, 2015
Figure 19 Top Market Developments (2013-2016)
Figure 20 Pumps Market Share By Region, 2015
Figure 21 Motors Market Share By Region, 2015
Figure 22 Focus on Energy Efficiency is the Major Factor Driving the Intelligent Pump Market
Figure 23 Motor Electricity Use By Type of System (U.S.)
Figure 24 Total Cost of Pump Ownership
Figure 25 Total Life Cycle Cost Savings: Conventional System vs Intelligent System
Figure 26 Residential & Commercial Buildings Total Energy End-Use (2015)
Figure 27 Commodity Prices (Copper & Gold) in USD, 2012�2015
Figure 28 Oil & Non-Oil Fiscal Revenue (% of Total Government Revenue), 2015
Figure 29 Average Real GDP Growth in Asia, Change From Previous Year
Figure 30 Capex of Major Oil & Gas Companies
Figure 31 China: Annual Growth Rate of GDP
Figure 32 Emission Targets in Key Countries By 2020
Figure 33 Increasing Gas-Based Generation to Propel the Cryogenic Pump Market
Figure 34 Decreasing Cost of Solar Pv Generation, 1995�2015
Figure 35 Brent Crude Oil Price (USD), January 2013�January 2016
Figure 36 Development in Water, Wastewater, & Sanitation Sector Would Propel the Diaphragm Pumps Market
Figure 37 Commodity Prices (Copper & Gold) in USD, 2012�2015
Figure 38 Market Dynamics of Submersible Pumps
Figure 39 Growth in the Renewable Power Generation Sector to Drive the Gear Motors Market
Figure 40 Market Dynamics of AC Drives
Figure 41 Urbanization Trend in Key Countries
Figure 42 Motor Efficiency Regulations: A Timeline
Figure 43 Decline in Brent Crude Oil Prices Since January 2014
Figure 44 Comparison Between Energy Saving Obtained By Using Dc Drives & AC Drives
Figure 45 Growing Industrial Pumps Market is Driving the Motor Soft Starter Market
Figure 46 Market Dynamics: Permanent Magnet Synchronous Motor Market
Figure 47 Growing Demand for Industrial Automation to Drive the Motor Control Centers Market
Figure 48 Companies Adopted New Product Development as the Key Growth Strategy in the Pumps Market, 2013�2016
Figure 49 Companies Adopted New Product Development as the Key Growth Strategy in the Motors Market, 2013�2016
Figure 50 Market Ranking: Pumps Market (2015)
Figure 51 Market Ranking: Motors Market (2015)
Figure 52 Market Evaluation Framework: Contracts & Agreements, Expansions, and New Product Developments Fueled the Growth of Companies From 2013 to 2016
Figure 53 Regional Mix of the Top Players
Figure 54 ABB Ltd.: Company Snapshot
Figure 55 Danfoss A/S: Company Snapshot
Figure 56 Eaton Corporation PLC.: Company Snapshot
Figure 57 Emerson Electric Co.: Company Snapshot
Figure 58 Flowserve Corporation: Company Snapshot
Figure 59 General Electric: Company Snapshot
Figure 60 Grundfos Group : Company Snapshot
Figure 61 Mitsubishi Electric Corporation: Company Snapshot
Figure 62 Rockwell Automation Inc.: Company Snapshot
Figure 63 Siemens AG: Company Snapshot
Figure 64 Sulzer Ltd. : Company Snapshot
Figure 65 Toshiba International Corporation: Company Snapshot
Figure 66 WEG SA : Company Snapshot
Figure 67 Xylem Inc.: Company Snapshot
Figure 68 Yaskawa Electric Corporation : Company Snapshot


Growth opportunities and latent adjacency in Top 10 Pumps and Motors Market