Transparent Ceramics Market by Type (Monocrystalline Transparent Ceramics, Polycrystalline Transparent Ceramics, Others), Material (Sapphire, Spinel), End-User Industry (Optics & Optoelectronics, Mechanical/Chemical), and Region - Global Forecast to 2022


Transparent Ceramics Market is projected to reach USD 698.1 Million by 2022, at a CAGR of 21.3%.
The objectives of this study are:
- To analyze and forecast the size of the global transparent ceramics markets, in terms of value
- To define, segment, and estimate the global transparent ceramics market by type, material, end-use industry, and region
- To provide detailed information regarding the crucial factors influencing the growth of the market (drivers, restraints, opportunities, and challenges)
- To strategically analyze micromarkets with respect to individual growth trends, future prospects, and contribution to the total market
- To analyze the opportunities in the transparent ceramics market for stakeholders and details of the competitive landscape for market leaders
- To project the size of market segments, in terms of value and volume, with respect to five main regions namely, Asia-Pacific, North America, Europe, South America and Rest of the World
- To track and analyze competitive developments such as new product launches, acquisitions, investments, expansions, partnerships, agreements, joint ventures, collaborations, product approvals, and other developments in the transparent ceramics market
- To strategically profile the key players and comprehensively analyze their market share and core competencies
The years considered for the study are:
- Base Year – 2016
- Estimated Year – 2017
- Projected Year – 2022
- Forecast Period – 2017 to 2022
For company profiles in the report, 2016 has been considered as the base year. In certain cases, wherein information is unavailable for the base year, the years prior to it have been considered.
Research Methodology
The research methodology used to estimate and forecast the global transparent ceramics market began with capturing data on key vendor revenues through secondary sources such as Hoovers, Bloomberg, Chemical Weekly, Factiva, and various other government and private websites. The vendor offerings have also been taken into consideration to determine the market segmentation. After arriving at the overall market size, the total market was split into several segments and subsegments, which were later verified through primary research by conducting extensive interviews with key personnel, such as CEOs, VPs, directors, and executives. Data triangulation and market breakdown procedures were employed to complete the overall market engineering process and arrive at the exact statistics for all segments and subsegments of the market. The breakdown of profiles of primaries is depicted in the figure below.
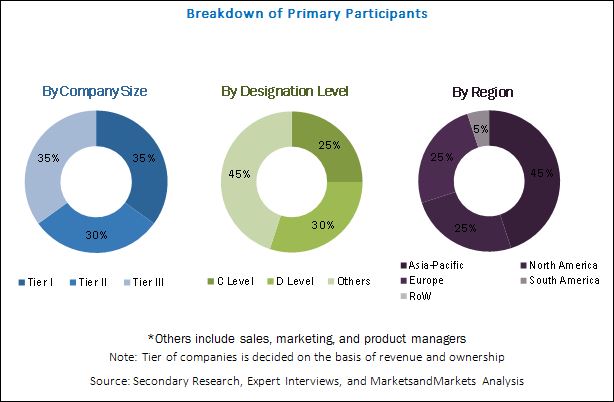
To know about the assumptions considered for the study, download the pdf brochure
The global transparent ceramics market has a diversified ecosystem of upstream players, including raw material suppliers, along with downstream stakeholders, vendors, end users, and government organizations. Companies operating in the global transparent ceramics market include CoorsTek Inc. (U.S.), Surmet Corporation (U.S.), Schott AG (Germany), and II-VI Optical Systems (U.S.), CILAS (France), Brightcrystals Technology Inc. (China), and CeramTec-ETEC GmbH (Germany), among others.
Target Audience
- Transparent ceramics Manufacturers, Traders, Suppliers, and Distributors
- Government and Research Organizations
- End Users
- Companies Operational in Material R&D
- Associations and Industrial Bodies
- Investment Banks
- Consulting Companies/Consultants in Chemical and Material Sectors
- Industry Associations
“This study answers several questions for the stakeholders, primarily the market segments which they need to focus upon during the next two to five years so that they may prioritize their efforts and investments accordingly”.
Scope of the Transparent Ceramics Market Report
This research report categorizes the global transparent ceramics market based on type, application, and region, forecasting revenues as well as analyzing trends in each of the submarkets.
On the basis of Type:
- Monocrystalline transparent ceramics
- Polycrystalline transparent ceramics
- Others(glass-ceramics, glass-crystal, and nanomaterials)
On the basis of Material:
- Sapphire
- Yttrium Aluminum Garnet
- Aluminum Oxynitride
- Spinel
- Others (Yttria & Cubic Zirconia)
On the basis of End-use Industry:
- Optics & Optoelectronics
- Aerospace, Defense & Security
- Mechanical/Chemical
- Sensors & Instrumentation
- Healthcare
- Consumer goods/electronics
- Energy
- Others(Lighting, Scintillator, biomaterials )
On the basis of Region:
- Asia-Pacific
- North America
- Europe
- South America
- Rest of The World
The following customization options are available for the report:
With the given market data, MarketsandMarkets offers customizations as per the company’s specific needs. The following customization options are available for the report:
Product Analysis
- Product Matrix, which gives a detailed comparison of the product portfolio of each company.
Geographic Analysis
- Further breakdown of the Rest of Asia-Pacific, Rest of Middle East & Africa, Rest of Europe, and Rest of South America transparent ceramics markets.
Company Information
- Detailed analysis and profiling of additional market players (up to five companies)
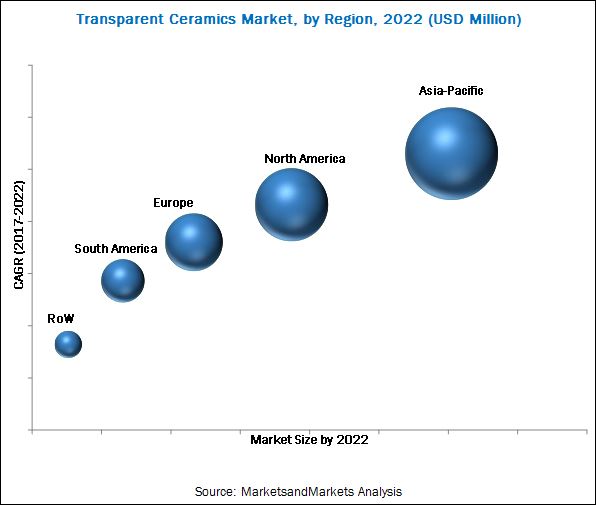
The transparent ceramics market was valued at USD 219.2 Million in 2016 and is projected to reach USD 698.1 Million by 2022, at a CAGR of 21.3% between 2017 and 2022. The growth of the transparent ceramics market is triggered by the increasing used in the defense sector in reconnaissance & sensor windows, night vision systems, windows for laser communications, and so on. These ceramics are also used in electromagnetic (EM) radomes, IR domes, sensor protection, and multi-spectral windows due to their abrasion resistance and excellent thermal stability. Transparent ceramic materials such as sapphire are used in high-speed, infrared-guided missile domes owing to their thermal stability, and mechanical properties
Monocrystalline transparent ceramics is the largest and the fastest growing segment of the transparent ceramics market, in 2016. Monocrystalline transparent ceramics are ideally suitable for applications that require high optical transparency and mechanical strength. Therefore, these are widely used optoelectronics and aerospace, defense & security applications.
Sapphire is the fastest-growing segment, projected to register a CAGR of 24.0% during the forecast period. There is a high potential for sapphire across various industry verticals, such as optoelectronics, energy, aerospace, defense, and security, among others. Sapphire (single crystal aluminum oxide) is primarily used where standard glass and technical ceramics cannot meet the high transparency demand of the specific applications.
Optics & optoelectronics segment dominated the global transparent ceramics market in 2016, due to the increasing use of transparent ceramics, owing to their superior mechanical and optical properties. China is expected to be a major market for the optics & optoelectronics transparent ceramics due to low labor cost and potential high demand for transparent ceramics across various emerging applications.
Asia-Pacific was the largest market of transparent ceramics in 2016, growth of this regional market is driven by the rising demand from electronics and defense industries in major economies such as China and India. Asia-Pacific is also estimated to be the fastest-growing transparent ceramics market. Asia-Pacific accounted for a share of 33.5% of the transparent ceramics market in 2016.
The high cost of certain transparent ceramics will restrain the growth of the transparent ceramics market. Furthermore, the high prices of raw materials increase the cost of these ceramics, and ultimately increase the prices of end products. This has led to end-use industries seeking low-cost substitutes for these materials. These ITOs are applied to screens with physical deposition method to create a thin film that is conductive and transparent. The growing demand in current and emerging markets present new commercialization opportunities for these films in terms of volumes and costs. Thus, manufacturers are trying to develop cheaper alternative to ITOs to make the production of smartphones more economical. Key players operational in the transparent ceramics market include CoorsTek Inc. (U.S.), Surmet Corporation (U.S.), Schott AG (Germany), and II-VI Optical Systems (U.S.), CILAS (France), Brightcrystals Technology Inc. (China), and CeramTec-ETEC GmbH (Germany), among others, have adopted various strategies to increase their market shares. New product launches and acquisitions are some of the key strategies adopted by market players to achieve growth in the transparent ceramics market.
Frequently Asked Questions (FAQ):
How big is the Transparent Ceramics Market?
Transparent Ceramics Market is projected to reach USD 698.1 Million by 2022, at a CAGR of 21.3%.
Who leading market players in Transparent Ceramics Market ?
Key players in the Transparent Ceramics Market include CoorsTek Inc. (U.S.), Surmet Corporation (U.S.), Schott AG (Germany), and II-VI Optical Systems (U.S.), CILAS (France), Brightcrystals Technology Inc. (China), and CeramTec-ETEC GmbH (Germany), among others.
To speak to our analyst for a discussion on the above findings, click Speak to Analyst
Table of Contents
1 Introduction (Page No. - 15)
1.1 Objectives of the Study
1.2 Market Definition
1.3 Scope of the Study
1.3.1 Years Considered for the Study
1.4 Currency
1.5 Stakeholders
2 Research Methodology (Page No. - 18)
2.1 Research Data
2.1.1 Secondary Data
2.1.1.1 Key Data From Secondary Sources
2.1.2 Primary Data
2.1.2.1 Key Data From Primary Sources
2.1.2.2 Key Industry Insights
2.1.2.3 Breakdown of Primary Interviews
2.2 Market Size Estimation
2.2.1 Bottom-Up Approach
2.2.2 Top-Down Approach
2.3 Data Triangulation
2.4 Research Assumptions and Limitations
2.4.1 Assumptions
2.4.2 Limitations
3 Executive Summary (Page No. - 27)
3.1 Transparent Ceramics Market, By End-Use Industry
3.2 Transparent Ceramics Market, By Material
3.3 Transparent Ceramics Market, By Type
4 Premium Insights (Page No. - 32)
4.1 Attractive Opportunities in the Transparent Ceramics Market
4.2 Transparent Ceramics Market: By Material
4.3 Transparent Ceramics Market Share, By End-User Industry and Region
4.4 Transparent Ceramics Market Growth Rate, By Country
4.5 Transparent Ceramics Market: Developed & Developing Nations
4.6 Transparent Ceramics Market, By End-Use Industry
5 Market Overview (Page No. - 38)
5.1 Introduction
5.2 Evolution of Transparent Ceramics
5.3 Market Dynamics
5.3.1 Drivers
5.3.1.1 Substitute to Glass, Metal, and Plastics
5.3.1.2 Increasing Defense Expenditure on Advanced Materials and Technologies
5.3.2 Restraints
5.3.2.1 High Cost of Transparent Ceramics
5.3.3 Opportunities
5.3.3.1 Advancements in Nanotechnology
5.3.3.2 Increased Demand in Niche Applications
5.3.4 Challenges
5.3.4.1 Transparent Ceramics are Non-Recyclable and Non-Repairable
5.4 Porter’s Five Forces Analysis
5.4.1 Threat of New Entrants
5.4.2 Threat of Substitutes
5.4.3 Bargaining Power of Suppliers
5.4.4 Bargaining Power of Buyers
5.4.5 Intensity of Competitive Rivalry
5.5 Industry Outlook
5.5.1 Electronics
6 Transparent Ceramics Market, By Type (Page No. - 47)
6.1 Introduction
6.2 Transparent Ceramics Market, By Type
6.3 Monocrystalline Transparent Ceramics
6.4 Polycrystalline Transparent Ceramics
6.5 Other Transparent Ceramics
7 Transparent Ceramics Market, By Material (Page No. - 54)
7.1 Introduction
7.2 Sapphire
7.3 Yttrium Aluminum Garnet (YAG)
7.4 Aluminum Oxynitride
7.5 Spinel
7.6 Other Materials
8 Transparent Ceramics Market, By End-Use Industry (Page No. - 63)
8.1 Introduction
8.2 Optics & Optoelectronics
8.3 Aerospace, Defense & Security
8.4 Mechanical/Chemical
8.5 Sensors & Instrumentation
8.6 Healthcare
8.7 Consumer Goods/Electronics
8.8 Energy
8.9 Other
9 Regional Analysis (Page No. - 76)
9.1 Introduction
9.2 Asia-Pacific
9.2.1 China
9.2.2 Japan
9.2.3 India
9.2.4 Rest of Asia-Pacific
9.3 North America
9.3.1 U.S.
9.3.2 Canada
9.3.3 Mexico
9.4 Europe
9.4.1 Germany
9.4.2 France
9.4.3 Italy
9.4.4 Rest of Europe
9.5 South America
9.5.1 Brazil
9.5.2 Chile
9.5.3 Rest of South America
9.6 RoW
9.6.1 Middle East
9.6.2 Others
10 Competitive Landscape (Page No. - 117)
10.1 Introduction
10.1.1 Dynamic
10.1.2 Innovators
10.1.3 Vanguards
10.1.4 Emerging
10.2 Dive Chart
10.3 Market Share Analysis
10.4 Competitive Benchmarking
10.4.1 Analysis of Product Portfolio of Major Players in the Transparent Ceramics Market
10.4.2 Business Strategies Adopted By Major Players in the Transparent Ceramics Market
11 Company Profiles (Page No. - 122)
(Overview, Financial*, Products & Services, Strategy, and Developments)
11.1 Murata Manufacturing Co., Ltd.
11.2 CILAS
11.3 Ceranova Corporation
11.4 Brightcrystals Technology Inc.
11.5 Ceramtec-Etec GmbH
11.6 Coorstek, Inc.
11.7 Konoshima Chemicals Co., Ltd.
11.8 Surmet Corporation
11.9 Schott AG
11.10 II-VI Optical Systems
11.11 American Elements
11.12 Other Key Players in the Transparent Ceramics Market
11.12.1 Advanced Ceramic Manufacturing, LLC
11.12.2 Blasch Precision Ceramics Inc.
11.12.3 Ceradyne Inc.
11.12.4 Koito Manufacturing Co., Ltd.
11.12.5 Kyocera Corporation
11.12.6 Mcdanel Advanced Ceramic Technologies LLC
11.12.7 Morgan Advanced Materials PLC
11.12.8 Rauschert Steinbach GmbH
11.12.9 Saint-Gobain Ceramics & Plastics, Inc.
11.12.10 Shanghai Siccas High Technology Corporation
*Details Might Not Be Captured in Case of Unlisted Companies
12 Appendix (Page No. - 154)
12.1 Discussion Guides
12.2 Knowledge Store: Marketsandmarkets Subscription Portal
12.3 Introducing RT: Real-Time Market Intelligence
12.4 Available Customizations
12.5 Related Reports
12.6 Author Details
List of Tables (89 Tables)
Table 1 Transparent Ceramics Market Snapshot
Table 2 Transparent Ceramic Market Size, By Type, 2015–2022 (USD Million)
Table 3 Monocrystalline Transparent Ceramics Market Size, By Region, 2015–2022 (USD Million)
Table 4 Polycrystalline Transparent Ceramic Market Size, By Region, 2015–2022 (USD Million)
Table 5 Other Transparent Ceramic Types Market Size, By Region, 2015–2022 (USD Million)
Table 6 Transparent Ceramics Market Size, By Material, 2016–2022 (USD Million)
Table 7 Sapphire-Based Transparent Ceramic Market, By Region, 2015-2022 (USD Million)
Table 8 Yttrium Aluminum Garnet Based Transparent Ceramics Market, By Region, 2015-2022 (USD Million)
Table 9 Aluminum Oxynitride-Based Transparent Ceramic Market, By Region, 2015-2022 (USD Million)
Table 10 Spinel-Based Transparent Ceramics Market, By Region, 2015-2022 (USD Million)
Table 11 Other Materials-Based Transparent Ceramic Market, By Region, 2015-2022 (USD Million)
Table 12 Transparent Ceramics Market Size, By End-Use Industry, 2015-2022 (USD Million)
Table 13 Transparent Ceramic Market in Optics & Optoelectronics, By Region, 2016–2022 (USD Million)
Table 14 Transparent Ceramics Market Size in Aerospace, Defense & Security, By Region, 2016–2022 (USD Million)
Table 15 Transparent Ceramic Market in Mechanical/Chemical, By Region, 2016–2022 (USD Million)
Table 16 Transparent Ceramics Market in Sensors & Instrumentation, By Region, 2016–2022 (USD Million)
Table 17 Transparent Ceramic Market in Healthcare, By Region, 2016–2022 (USD Million)
Table 18 Transparent Ceramics Market in Consumer Goods/Electronics, By Region, 2016–2022 (USD Million)
Table 19 Transparent Ceramic Market in Energy, By Region, 2016–2022 (USD Million)
Table 20 Transparent Ceramics Market in Other End-Use Industries, By Region, 2016–2022 (USD Million)
Table 21 Transparent Ceramic Market, By Region, 2015–2022 (USD Million)
Table 22 Asia-Pacific Transparent Ceramics Market, By Country, 2015–2022 (USD Million)
Table 23 Asia-Pacific Transparent Ceramic Market, By End-Use Industry, 2015–2022 (USD Million)
Table 24 Asia-Pacific Transparent Ceramic Market, By Material, 2015–2022 (USD Million)
Table 25 Asia-Pacific Transparent Ceramic Market, By Type, 2015–2022 (USD Million)
Table 26 China By Market, By End-Use Industry, 2015–2022 (USD Million)
Table 27 China By Market, By Material, 2015–2022 (USD Million)
Table 28 China By Market, By Type, 2015–2022 (USD Million)
Table 29 Japan By Market, By End-Use Industry, 2015–2022 (USD Million)
Table 30 Japan By Market, By Material, 2015–2022 (USD Million)
Table 31 Japan By Market, By Type, 2015–2022 (USD Million)
Table 32 India By Market, By End-Use Industry, 2015–2022 (USD Million)
Table 33 India By Market, By Material, 2015–2022 (USD Million)
Table 34 India By Market, By Type, 2015–2022 (USD Million)
Table 35 Rest of Asia-Pacific By Market, By End-Use Industry, 2015–2022 (USD Million)
Table 36 Rest of Asia-Pacific By Market, By Material, 2015–2022 (USD Million)
Table 37 Rest of Asia-Pacific By Market, By Type, 2015–2022 (USD Million)
Table 38 North America By Market, By Country, 2015–2022 (USD Million)
Table 39 North America By Market, By End-Use Industry, 2015–2022 (USD Million)
Table 40 North America By Market, By Material, 2015–2022 (USD Million)
Table 41 North America By Market, By Type, 2015–2022 (USD Million)
Table 42 U.S. By Market, By End-Use Industry, 2015–2022 (USD Million)
Table 43 U.S. By Market, By Material, 2015–2022 (USD Million)
Table 44 U.S. By Market, By Type, 2015–2022 (USD Million)
Table 45 Canada By Market, By End-Use Industry, 2015–2022 (USD Million)
Table 46 Canada By Market, By Material, 2015–2022 (USD Million)
Table 47 Canada By Market, By Type, 2015–2022 (USD Million)
Table 48 Mexico By Market, By End-Use Industry, 2015–2022 (USD Million)
Table 49 Mexico By Market, By Material, 2015–2022 (USD Million)
Table 50 Mexico By Market, By Type, 2015–2022 (USD Million)
Table 51 Europe By Market, By Country, 2015–2022 (USD Million)
Table 52 Europe By Market, By End-Use Industry, 2015–2022 (USD Million)
Table 53 Europe By Market, By Material, 2015–2022 (USD Million)
Table 54 Europe By Market, By Type, 2015–2022 (USD Million)
Table 55 Germany Transparent Ceramics Market, By End-Use Industry, 2015–2022 (USD Million)
Table 56 Germany Transparent Ceramic Market, By Material, 2015–2022 (USD Million)
Table 57 Germany Transparent Ceramic Market, By Type, 2015–2022 (USD Million)
Table 58 France By Market, By End-Use Industry, 2015–2022 (USD Million)
Table 59 France By Market, By Material, 2015–2022 (USD Million)
Table 60 France By Market, By Type, 2015–2022 (USD Million)
Table 61 Italy By Market, By End-Use Industry, 2015–2022 (USD Million)
Table 62 Italy By Market, By Material, 2015–2022 (USD Million)
Table 63 Italy By Market, By Type, 2015–2022 (USD Million)
Table 64 Rest of Europe Transparent Ceramics Market, By End-Use Industry, 2015–2022 (USD Million)
Table 65 Rest of Europe Transparent Ceramic Market, By Material, 2015–2022 (USD Million)
Table 66 Rest of Europe Transparent Ceramic Market, By Type, 2015–2022 (USD Million)
Table 67 South America Transparent Ceramic Market, By Country, 2015–2022 (USD Million)
Table 68 South America Transparent Ceramic Market, By End-Use Industry, 2015–2022 (USD Million)
Table 69 South America Transparent Ceramic Market, By Material, 2015–2022 (USD Million)
Table 70 South America Transparent Ceramic Market, By Type, 2015–2022 (USD Million)
Table 71 Brazil By Market, By End-Use Industry, 2015–2022 (USD Million)
Table 72 Brazil By Market, By Material, 2015–2022 (USD Million)
Table 73 Brazil By Market, By Type, 2015–2022 (USD Million)
Table 74 Chile By Market, By End-Use Industry, 2015–2022 (USD Million)
Table 75 Chile By Market, By Material, 2015–2022 (USD Million)
Table 76 Chile By Market, By Type, 2015–2022 (USD Million)
Table 77 Rest of South America By Market, By End-Use Industry, 2015–2022 (USD Million)
Table 78 Rest of South America By Market, By Material, 2015–2022 (USD Million)
Table 79 Rest of South America By Market, By Type, 2015–2022 (USD Million)
Table 80 RoW By Market, By Country, 2015–2022 (USD Million)
Table 81 RoW By Market, By End-Use Industry, 2015–2022 (USD Million)
Table 82 RoW By Market, By Material, 2015–2022 (USD Million)
Table 83 RoW By Market, By Type, 2015–2022 (USD Million)
Table 84 Middle East By Market, By End-Use Industry, 2015–2022 (USD Million)
Table 85 Middle East By Market, By Material, 2015–2022 (USD Million)
Table 86 Middle East By Market, By Type, 2015–2022 (USD Million)
Table 87 Others Transparent Ceramics Market, By End-Use Industry, 2015–2022 (USD Million)
Table 88 Others Transparent Ceramic Market, By Material, 2015–2022 (USD Million)
Table 89 Others Transparent Ceramic Market, By Type, 2015–2022 (USD Million)
List of Figures (50 Figures)
Figure 1 Transparent Ceramics: Market Segmentation
Figure 2 Research Design
Figure 3 Market Size Estimation: Bottom-Up Approach
Figure 4 Market Size Estimation: Top-Down Approach
Figure 5 Transparent Ceramics Market: Data Triangulation
Figure 6 The Optics & Optoelectronics Segment Projected to Be the Fastest-Growing Segment of the Transparent Ceramic Market During the Forecast Period
Figure 7 The Sapphire Segment of the Transparent Ceramics Market is Projected to Witness the Highest Growth During the Forecast Period
Figure 8 The Monocrystalline Transparent Ceramics Segment is Projected to Witness the Highest Growth During the Forecast Period
Figure 9 Asia-Pacific Dominated the Transparent Ceramic Market With the Highest Share in 2016
Figure 10 Increasing Demand From Aerospace, Defense & Security Industry is Driving the Growth of the Transparent Ceramics Market
Figure 11 Sapphire is Projected to Be the Fastest-Growing Transparent Ceramics Material Segment During 2017 to 2022
Figure 12 The Optics & Optoelectronics Segment Accounted for the Largest Share of the Transparent Ceramic Market in 2016
Figure 13 The Market in China Expected to Grow at the Highest CAGR During the Forecast Period
Figure 14 Transparent Ceramics Market to Witness Significant Growth in Emerging Nations Between 2017 and 2022
Figure 15 The Optics & Optoelectronics Segment Led the Transparent Ceramic Market in 2016
Figure 16 Evolution of Transparent Ceramics Market
Figure 17 Drivers, Restraints, Opportunities, and Challenges for the Transparent Ceramic Market
Figure 18 Defense Expenditure of Top 10 Countries in 2015 and 2016
Figure 19 Porter’s Five Forces Analysis
Figure 20 The Monocrystalline Transparent Ceramics Segment is Estimated to Grow at the Highest CAGR During the Forecast Period
Figure 21 Asia-Pacific is Estimated to Be the Fastest-Growing Market for Monocrystalline Transparent Ceramics During the Forecast Period
Figure 22 Asia Pacific is Estimated to Be the Largest Polycrystalline Transparent Ceramics Market During the Forecast Period
Figure 23 Asia-Pacific is Projected to Be the Fastest-Growing Market for Other Transparent Ceramic Types
Figure 24 Transparent Ceramic Market Share, By Material, 2017 (USD Million)
Figure 25 Asia-Pacific is Estimated to Be the Largest Market for Sapphire Material Segment During the Forecast Period
Figure 26 Asia-Pacific is Estimated to Be the Fastest-Growing Yttrium Aluminum Garnet Transparent Ceramics Market During the Forecast Period
Figure 27 Aluminum Oxynitride-Based Transparent Ceramic Market is Projected to Witness High Growth in Asia-Pacific During the Forecast Period
Figure 28 Spinel Based Transparent Ceramics Market to Witness Significant Growth in Asia-Pacific During the Forecast Period
Figure 29 Asia-Pacific is Estimated to Lead the Other Materials-Based Transparent Ceramic Market During the Forecast Period
Figure 30 The Optics & Optoelectronics End-Use Industry Segment is Projected to Grow Rapidly in the Next Five Years
Figure 31 Asia-Pacific is Projected to Be the Fastest-Growing Transparent Ceramics Market for Optics & Optoelectronics During the Forecast Period
Figure 32 Asia-Pacific is Projected to Be the Fastest-Growing Transparent Ceramic Market for Aerospace, Defense & Security During the Forecast Period
Figure 33 North America is Projected to Be the Fastest-Growing Transparent Ceramics Market for Mechanical/Chemical During the Forecast Period
Figure 34 Asia-Pacific is Projected to Be the Fastest-Growing Market for Transparent Ceramics in Sensors & Instrumentation During the Forecast Period
Figure 35 North America is Projected to Be the Fastest-Growing Market for Transparent Ceramics in Healthcare During the Forecast Period
Figure 36 Asia-Pacific is Projected to Be the Fastest-Growing Market for Transparent Ceramics in Consumer Goods/Electronics End-Use Industry During the Forecast Period
Figure 37 Europe is Projected to Be the Fastest-Growing Transparent Ceramic Market for Energy During the Forecast Period
Figure 38 Europe is Projected to Be the Fastest-Growing Market for Transparent Ceramics in Other End-Use Industries During the Forecast Period
Figure 39 Regional Snapshot: China is Emerging as A Lucrative Market for Transparent Ceramics
Figure 40 Asia-Pacific Transparent Ceramics Market Snapshot
Figure 41 North America Transparent Ceramic Market Snapshot
Figure 42 Europe Transparent Ceramics Market Snapshot
Figure 43 South America Transparent Ceramic Market Snapshot
Figure 44 South America Transparent Ceramic Market Snapshot
Figure 45 Coorstek, Inc. is the Leading Player in the Transparent Ceramics Market
Figure 46 Murata Manufacturing Co., Ltd.: Company Snapshot
Figure 47 CILAS: Company Snapshot
Figure 48 Ceramtec-Etec GmbH: Company Snapshot
Figure 49 Konoshima Chemicals Co., Ltd.: Company Snapshot
Figure 50 Schott AG: Company Snapshot


Growth opportunities and latent adjacency in Transparent Ceramics Market
Market size analysis on Transparent Alumina