VCSEL Market

VCSEL Market by Type (Single-mode and Multimode), Material (GaAs, InP, GaN), Wavelength, Application (Sensing, Data Communication, Industrial Heating & Printing, Emerging), Data Rate, Industry and Region - Global Forecast to 2028

Report Code: SE 3835 Feb, 2023, by marketsandmarkets.com

Updated on : April 24, 2023

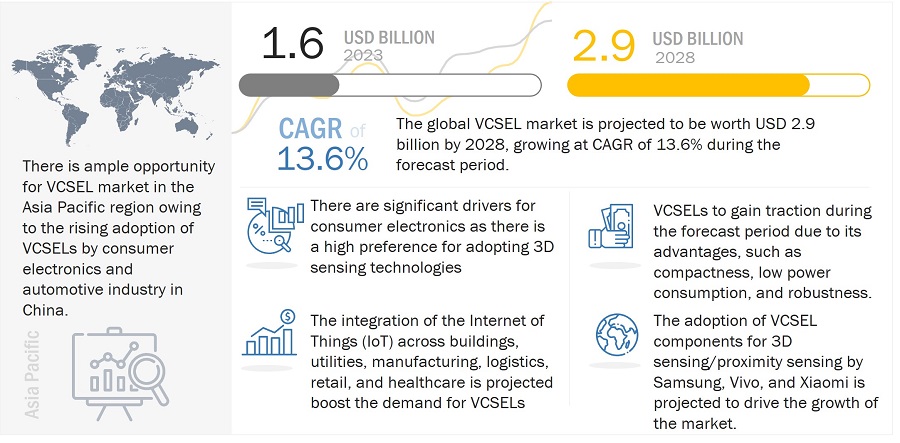
[226 Pages Report] The VCSEL market is estimated to grow from USD 1.6 billion in 2023 to USD 2.9 billion by 2028; it is projected to grow at a CAGR of 13.6% from 2023 to 2028.

The major drivers for this market include increase in applications of VCSELs in data communication and the growing adoption of 3D sensing applications in smartphones. The high adoption of VCSELs by wafer manufacturers, integrators, and testing and inspection companies, use of VCSELs in LiDAR systems of autonomous vehicles, and technological advancements, and increasing interest of OEMs to adopt VCSELs in consumer devices are the key factors that are likely to create growth opportunities for the market players during the forecast period.
VCSEL Market

VCSEL Market Forecast to 2028

To know about the assumptions considered for the study, Request for Free Sample Report

Recession Impact on Vcsel Market

The recession's impact on the VCSEL market has been analyzed in this study. The short-term outlook for semiconductor revenues has worsened in the third quarter of 2023. A rapid deterioration in the global economy and weakening consumer demand will negatively impact the global semiconductor market in 2023. Weakness in consumer-driven markets like telecommunication, networking is driven largely by the decline in disposable income, caused by rising inflation and interest rates. This will negatively impact the production and sales of smartphones, PCs, and other consumer electronics products. If regional or global economic conditions deteriorate, companies’ results of operations, financial position, and cash flows could be materially adversely affected.

VCSEL Market Dynamics

DRIVERS: Growing adoption of 3D sensing applications in smartphones

VCSELs play an important role in 3D sensing applications in smartphones. 3D camera sensing using a flood illuminator, dot projector, and proximity sensor are all based on VCSEL laser components. Cameras that scan and render objects in 3D have now become a standard feature in high-end smartphones. The cameras, when paired with proper software, enable the user to sense light levels, movements, and textures more precisely than previously possible. VCSELs offer several advantages, such as relatively low cost, optical efficiency, low power consumption, wavelength stability, and high modulating rates.

RESTRAINT: Limited data transmission range

The data rates attained are considerably high for optical communication using VCSELs, with the latest devices transmitting at more than 50Gbps. Multimode fiber (MMF) is designed to operate at wavelengths of 850 and 1,300nm, where 850nm is the most common wavelength for VCSELs. However, signal attenuation is high in MMF, and the range of VCSELs is limited to a maximum of ~300 m. Hence, transmitting data using VCSELs over a certain distance can be a challenge due to the weakening of the signal. Attenuation is higher for data communication over longer distances, which results in signal losses, thereby affecting performance. As a result, the VCSELs are not suitable for long-range optical communication.

OPPORTUNITIES: Growing IoT market and data processing across commercial and government sectors

The integration of the Internet of Things (IoT) across buildings, utilities, manufacturing, logistics, retail, and healthcare is also projected to drive the demand for VCSELs. Apart from commercial businesses, governments are also keen to implement this technology across the transportation and defense sector. The implementation of IoT in smart cities is likely to generate a large amount of raw data as a result of a large number of connected devices. Companies such as Facebook (US), Microsoft (US), Google (US), and Apple (US) are building a large number of data processing centers across the globe that are projected to leverage VCSELs. Apart from IoT, the growth in cloud computing and 5G communications is also projected to drive the market for VCSELs in the data processing.

CHALLENGES: Recession impact on smartphone market

Smartphone are among the significant adopters of VCSEL technology, which have witnessed market disruptions and substantial changes in buying patterns. The expected recession would slow down the growth of high-end devices. Reduced demand for smartphones could set back the development of high-end smartphones that incorporate VCSEL technology. The global semiconductor shortage is also expected to discourage large-scale adoption of VCSELs in more affordable smartphones. This shortage is more prevalent in the semiconductor industry as semiconductor foundries reassigned production for smartphones, laptops, and gaming devices to cater to the surge in demand for such devices during the recession.

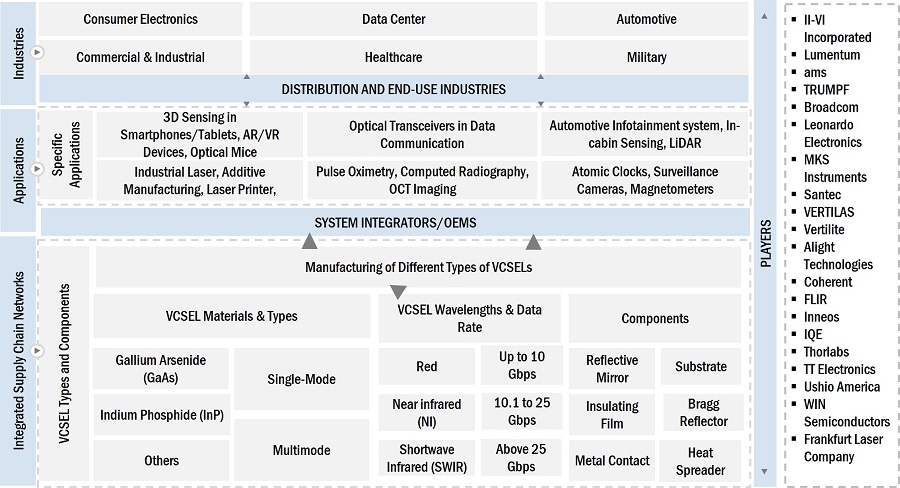
VCSEL Market Ecosystem
VCSEL Market by Ecosystem

SWIR expected to grow at the second fastest VCSEL market during forecasted period

VCSELs in the SWIR band have a wavelength between 1,400nm and 3,000nm. The majority of VCSELs in the SWIR band are made of InP material. In recent times, numerous studies have been conducted to ascertain the use of gallium antimonide (GaSb) for VCSELs used in the SWIR band. These VCSELs are used in gas sensing applications, optical communications, medical, imaging & security applications, and long-range LiDAR. At present, however, VCSELs based on SWIR are limited in their applications. Vertilas (Germany) is one of the few players offering VCSELs in the SWIR band segment

VCSELs based on other materials, such as GaAsP, InAlGaAs, GaInPAs, and GaInP to hold the second largest share in VCSEL market in 2023

The market penetration of 850 nm VCSELs based on GaAs has prompted researchers to explore other materials for the development of VCSELs with wavelengths in the range of 1,300–1,500nm, and also in the orange and red spectrum. Frankfurt Laser Company (Germany) is one of the major providers of GaAsP-based VCSELs. However, these materials have niche industrial applications and are mostly used for research and testing purposes.

Industrial heating and laser printing is expected to be the second largest segment of the VCSEL market during the forecasted period

VCSELs are used in various industrial applications, and industrial heating & processes is one of them. Industrial heating applications include general thermal processing plastics welding/forming, composite manufacturing, drying/curing of coatings, printed electronics, photovoltaics selective metal treatment, and preheating for additive manufacturing in 3D printing. TRUMPF is one of the important players in the industrial VCSEL market. The growth potential is likely to depend on how well the industrial sector responds to these high-power VCSEL arrays, as industrial heating applications are still in the innovation phase for VCSELs, as well as its market is currently emerging.

Commercial and industrial is expected to be the second largest industry of the VCSEL market during the forecasted period.

Developments and modifications in the VCSEL architecture have not only enhanced the efficiency of VCSELs for data centers but also increased the integration of VCSELs in an extensive range of emerging and innovative commercial & industrial applications. VCSELs are used in various industries for applications, such as infrared illumination, sensing, laser printing, and industrial heating. Innovations pertaining to VCSELs would benefit industries that involve different thermal processes. These thermal processes include melting, curing, annealing, and drying all kinds of materials. Infrared illuminators are also used in commercial & industrial applications, such as surveillance, imaging, and object detection.

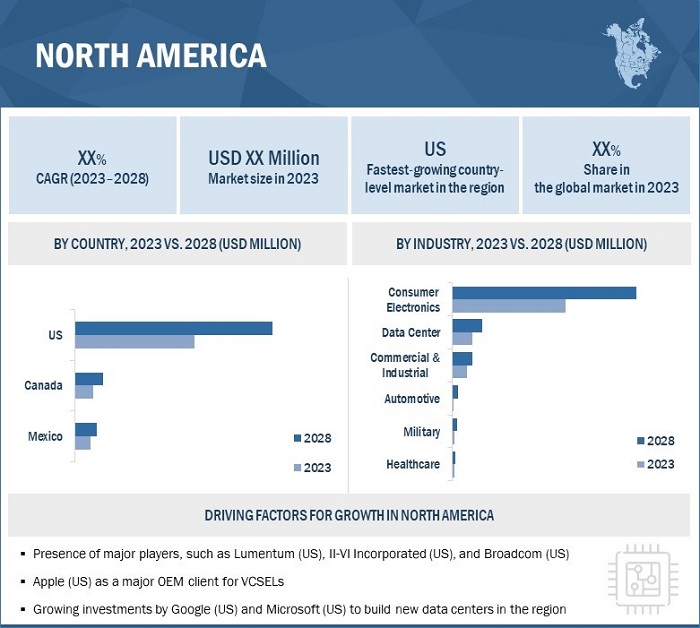
North America is expected to hold the second largest share in VCSEL market during forecasted period

The growth of the VCSEL industry in North America is due to the growing number of technological innovations in field of laser technology for various application areas such as medical, telecommunication, military, and automotive. The increase in R&D activities, particularly in the military and defense industries, has propelled the demand for VCSEL in the region. As of 2021, the annual military expenditure in the US was about 3.6% of the global GDP of the country. This will create lucrative growth opportunities for VCSEL in military applications. Apart from this, increasing application of VCSEL in the healthcare sector is one of the major market drivers.
VCSEL Market by Region

VCSEL Market by Region

To know about the assumptions considered for the study, download the pdf brochure

Key Market Players

The VCSEL companies such as Lumentum Holding Inc. (US), AMS-Osram AG (Austria), Coherent Corporation (US), TRUMPF (Germany), Broadcom (US), Leonardo Electronics (US), MKS Instruments (US), Santec (Japan), VERTILAS (Germany), Vertilite (China), Alight Technologies (Denmark), Inneos (US), IQE (UK), Thorlabs (UK), TT Electronics (UK), Ushio America (US), WIN Semiconductors (Taiwan), and Frankfurt Laser Company (Germany).

Get online access to the report on the World's First Market Intelligence Cloud

  • Easy to Download Historical Data & Forecast Numbers
  • Company Analysis Dashboard for high growth potential opportunities
  • Research Analyst Access for customization & queries
  • Competitor Analysis with Interactive dashboard
  • Latest News, Updates & Trend analysis
Request Sample

Scope of the Report

Report Metric

Details

Market size availability for years

2018–2028

Base year considered

2022

Forecast period

2023–2028

Forecast units

Value (USD Thousand/Million/Billion) and Volume (Million Units)

Segments covered

By Type, Material, Wavelength, Application, Data Rate, and Industry

Geographies covered

Asia Pacific, Europe, North America, and Rest of the World

Companies covered

The major market player includes Lumentum (US), Coherent Corporation (US), ams-OSRAM (Austria), TRUMPF (Germany), Broadcom (US), Leonardo Electronics (US), MKS Instruments (US), Santec (Japan), VERTILAS (Germany), Vertilite (China), Alight Technologies (Denmark), Inneos (US), IQE (UK), Thorlabs (UK), TT Electronics (UK), Ushio America (US), WIN Semiconductors (Taiwan), and Frankfurt Laser Company (Germany) among others

VCSEL Market Highlights

The study categorizes the VCSEL market based on type, material, wavelength, application, data rate, industry, and region at the global level.

Segment

Subsegment

By Type

  • Single mode
  • Multimode

By Material

  • Gallium Arsenide (GaAs)
  • Indium Phosphide (InP)
  • Others

By Wavelength

  • Red
  • Near Infrared (NIR)
  • Shortwave Infrared (SWIR)

By Data Rate

  • Up to 10 Gbps
  • 10.1 to 25 Gbps
  • Above 25 Gbps

By Application

  • Sensing
  • Data Communication
  • Industrial Heating & Laser Printing
  • Emerging & Other applications

By Industry

  • Consumer Electronics
  • Automotive
  • Data Center
  • Commercial & Industrial
  • Healthcare
  • Military

By Region

  • North America
  • Europe
  • Asia Pacific
  • Rest of the World
    • Middle East & Africa
    • South America

Recent Developments

  • May 2022, ams OSRAM launched a high-performance infrared laser flood illuminator for the latest automotive indirect Time-of-Flight (iToF) demonstrator from Melexis company which is a global supplier of microelectronic semiconductor solutions.
  • April 2022, Lumentum launched M Series multi-junction VCSEL arrays for next-generation automotive, industrial LiDAR, and 3D sensing applications. The M51-100 905 nm 70 W multi-junction VCSEL array is a compact, highly reliable, power-dense solution optimized for next-generation LiDAR systems.
  • December 2022, Coherent Corp. partnered with two Korean institutions, the Electronics and Telecommunications Research Institute (ETRI) and the Korea Advanced Institute of Science & Technology (KAIST), to foster collaboration on advanced electronic and photonic devices. It will also strengthen the company’s position in the Korean market.
  • July 2022, II-VI Incorporated acquired Coherent, Inc. to become a global leader in materials, networking, and lasers. Post the acquisition, the combined business will be more distributed across the value chain, from materials to components, subsystems, systems, and service.

Frequently Asked Questions (FAQ):

To speak to our analyst for a discussion on the above findings, click Speak to Analyst

TABLE OF CONTENTS
 
1 INTRODUCTION (Page No. - 27)
    1.1 STUDY OBJECTIVES 
    1.2 MARKET DEFINITION 
           1.2.1 INCLUSIONS AND EXCLUSIONS
    1.3 STUDY SCOPE 
           FIGURE 1 VCSEL MARKET: SEGMENTATION
           1.3.1 YEARS CONSIDERED
    1.4 CURRENCY CONSIDERED 
    1.5 UNITS CONSIDERED 
    1.6 STAKEHOLDERS 
    1.7 LIMITATIONS 
    1.8 SUMMARY OF CHANGES 
 
2 RESEARCH METHODOLOGY (Page No. - 32)
    2.1 RESEARCH DATA 
           FIGURE 2 VCSEL MARKET: RESEARCH DESIGN
           2.1.1 SECONDARY AND PRIMARY RESEARCH
                    2.1.1.1 Key industry insights
           2.1.2 SECONDARY DATA
                    2.1.2.1 List of key secondary sources
                    2.1.2.2 Key data from secondary sources
           2.1.3 PRIMARY DATA
                    2.1.3.1 Breakdown of primaries
                    2.1.3.2 Key data from primary sources
    2.2 MARKET SIZE ESTIMATION 
           2.2.1 BOTTOM-UP APPROACH
                    2.2.1.1 Approach to arrive at market size using bottom-up analysis (demand side)
                               FIGURE 3 MARKET SIZE ESTIMATION METHODOLOGY: BOTTOM-UP APPROACH
                               FIGURE 4 MARKET SIZE ESTIMATION METHODOLOGY: (DEMAND SIDE)— DEMAND FOR VCSELS
           2.2.2 TOP-DOWN APPROACH
                    2.2.2.1 Approach to obtain market size using top-down analysis (supply side)
                               FIGURE 5 MARKET SIZE ESTIMATION METHODOLOGY: TOP-DOWN APPROACH
                               FIGURE 6 MARKET SIZE ESTIMATION METHODOLOGY: (SUPPLY-SIDE)—IDENTIFICATION OF REVENUES GENERATED BY COMPANIES FROM VCSEL MARKET
    2.3 MARKET BREAKDOWN AND DATA TRIANGULATION 
           FIGURE 7 DATA TRIANGULATION
    2.4 RESEARCH ASSUMPTIONS 
           2.4.1 ASSUMPTIONS
    2.5 PARAMETERS CONSIDERED TO ANALYZE IMPACT OF RECESSION 
           2.5.1 RISK ASSESSMENT
 
3 EXECUTIVE SUMMARY (Page No. - 45)
    3.1 RECESSION IMPACT ANALYSIS 
           FIGURE 8 GDP GROWTH PROJECTION TILL 2023 FOR MAJOR ECONOMIES
           FIGURE 9 RECESSION IMPACT ON VCSEL MARKET
           FIGURE 10 MULTIMODE SEGMENT TO CAPTURE HIGHER MARKET SHARE IN 2023
           FIGURE 11 GAAS SEGMENT TO HOLD LARGEST MARKET SHARE DURING FORECAST PERIOD
           FIGURE 12 NIR SEGMENT TO DOMINATE MARKET DURING FORECAST PERIOD
           FIGURE 13 10.1 TO 25 GBPS SEGMENT TO ACCOUNT FOR LARGEST MARKET SHARE DURING FORECAST PERIOD
           FIGURE 14 EMERGING AND OTHER APPLICATIONS SEGMENT TO GROW AT HIGHEST CAGR DURING FORECAST PERIOD
           FIGURE 15 AUTOMOTIVE SEGMENT TO REGISTER HIGHEST CAGR DURING FORECAST PERIOD
           FIGURE 16 VCSEL MARKET IN ASIA PACIFIC TO GROW AT HIGHEST CAGR DURING FORECAST PERIOD
 
4 PREMIUM INSIGHTS (Page No. - 52)
    4.1 ATTRACTIVE OPPORTUNITIES FOR VCSEL MARKET PLAYERS 
           FIGURE 17 ADVANTAGES OF SOLID-STATE TECHNOLOGY, COMPACT DESIGN, AND ROBUSTNESS TO DRIVE VCSEL MARKET
    4.2 VCSEL MARKET, BY TYPE 
           FIGURE 18 MULTIMODE SEGMENT TO LEAD MARKET DURING FORECAST PERIOD
    4.3 VCSEL MARKET, BY MATERIAL 
           FIGURE 19 GAAS SEGMENT TO ACCOUNT FOR LARGEST MARKET SHARE DURING FORECAST PERIOD
    4.4 VCSEL MARKET, BY WAVELENGTH 
           FIGURE 20 NIR SEGMENT TO CAPTURE LARGEST MARKET SHARE DURING 2023–2028
    4.5 VCSEL MARKET, BY DATA RATE 
           FIGURE 21 10.1 TO 25 GBPS SEGMENT TO DOMINATE MARKET DURING 2023–2028
    4.6 VCSEL MARKET, BY APPLICATION 
           FIGURE 22 SENSING APPLICATION TO ACCOUNT FOR LARGEST MARKET SHARE DURING FORECAST PERIOD
    4.7 NORTH AMERICA: VCSEL MARKET, BY INDUSTRY AND COUNTRY 
           FIGURE 23 CONSUMER ELECTRONICS AND US TO BE LARGEST SHAREHOLDERS OF VCSEL MARKET IN NORTH AMERICA IN 2028
    4.8 VCSEL MARKET, BY COUNTRY 
           FIGURE 24 VCSEL MARKET TO RECORD HIGHEST CAGR IN ASIA PACIFIC IN 2028
 
5 MARKET OVERVIEW (Page No. - 56)
    5.1 INTRODUCTION 
    5.2 MARKET DYNAMICS 
           FIGURE 25 IMPACT OF DRIVERS ON VCSEL MARKET
           FIGURE 26 IMPACT OF OPPORTUNITIES ON VCSEL MARKET
           FIGURE 27 IMPACT OF RESTRAINTS AND CHALLENGES ON VCSEL MARKET
           5.2.1 DRIVERS
                    5.2.1.1 Growing adoption of 3D sensing applications in smartphones
                    5.2.1.2 Increasing application of VCSELs in data communication
                    5.2.1.3 Increased market investment for VCSEL manufacturing
           5.2.2 RESTRAINTS
                    5.2.2.1 Limited data transmission range
                    5.2.2.2 Limitations of semiconductor materials hampering performance of VCSELs
           5.2.3 OPPORTUNITIES
                    5.2.3.1 Use of VCSELs in LiDAR systems for automotive applications
                    5.2.3.2 Growing IoT market and data processing across commercial and government sectors
                    5.2.3.3 Growing adoption of VCSELs in consumer electronic devices
           5.2.4 CHALLENGES
                    5.2.4.1 Manufacturing defects in VCSELs
                    5.2.4.2 Recession impact on smartphone market
    5.3 TARIFFS AND REGULATIONS 
           5.3.1 TARIFF RELATED TO VCSELS
    5.4 REGULATIONS 
           5.4.1 GLOBAL
                    5.4.1.1 International Electrotechnical Commission (IEC)
           5.4.2 EUROPE
                    5.4.2.1 Restriction of Hazardous Substances (RoHS)
                    5.4.2.2 European Standards (EN)
           5.4.3 US
                    5.4.3.1 American National Standards Institute (ANSI)
                    5.4.3.2 Food and Drug Administration (FDA)
    5.5 CASE STUDY ANALYSIS 
           5.5.1 AMS-OSRAM PROVIDED VCSEL ARRAY FOR USE IN XIAOMI MI8 EXPLORER EDITION
           5.5.2 OSRAM AND CHRONOPTICS COOPERATED ON DEVELOPMENT OF 3D TOF CAMERA KIT
           5.5.3 AMBARELLA, LUMENTUM, AND ON-SEMICONDUCTOR COLLABORATED ON AI PROCESSING-BASED 3D SENSING FOR NEXT-GEN AIOT DEVICES
           5.5.4 LUMENTUM SHOWCASED PHOTONIC SOLUTIONS AT ECOC 2020
           5.5.5 LEONARDO ELECTRONICS OFFERS LIDAR SYSTEMS LEVERAGING COMPANY VCSELS
           5.5.6 ALIGHT TECHNOLOGIES DEVELOPING 10 GBPS 1,300 NM VCSEL
           5.5.7 INNEOS DEVELOPED VCSELS FOR USE IN SATELLITES
           5.5.8 IQE REACHED KEY MILESTONES WITH IQDN-VCSEL TECHNOLOGY
           5.5.9 WIN SEMICONDUCTORS SUPPLIES VCSELS TO APPLE
    5.6 AVERAGE SELLING PRICE OF VCSELS FOR VARIOUS END PRODUCTS 
           TABLE 1 ASP OF VCSELS USED IN VARIOUS END PRODUCTS
           FIGURE 28 AVERAGE SELLING PRICE FORECAST OF VCSELS, 2020–2026 (USD)
           TABLE 2 AVERAGE SELLING PRICE FORECAST OF VCSELS, 2020–2026 (USD)
    5.7 VALUE CHAIN ANALYSIS 
           FIGURE 29 VALUE CHAIN ANALYSIS OF VCSEL ECOSYSTEM: R&D AND MANUFACTURING PHASES CONTRIBUTE MAXIMUM VALUE
    5.8 ECOSYSTEM/MARKET MAP 
           FIGURE 30 VCSEL MARKET ECOSYSTEM
           5.8.1 MANUFACTURERS
           5.8.2 SUPPLIERS
           5.8.3 DISTRIBUTORS
           5.8.4 OEMS
    5.9 TECHNOLOGY ANALYSIS 
           5.9.1 KEY TECHNOLOGIES
                    5.9.1.1 3D camera
                    5.9.1.2 LiDAR
           5.9.2 ADJACENT TECHNOLOGY
                    5.9.2.1 Edge emitter lasers (EELs)
    5.10 TECHNOLOGY ANALYSIS 
           5.10.1 NEW MATERIALS USED IN MANUFACTURING OF VCSELS
           5.10.2 MINIATURIZATION OF VCSELS
           5.10.3 UNDER-DISPLAY VCSELS
    5.11 PATENT ANALYSIS 
           FIGURE 31 PATENT APPLICATION TRENDS FOR VCSELS, 2016–2020
    5.12 TRADE DATA 
           5.12.1 TRADE DATA FOR HS CODE 854140
                     TABLE 3 IMPORT DATA FOR HS CODE 854140, BY COUNTRY, 2016–2020 (USD BILLION)
                     TABLE 4 EXPORT DATA FOR HS CODE 854140, BY COUNTRY, 2016–2020 (USD BILLION)
    5.13 PORTER’S FIVE FORCES ANALYSIS 
           TABLE 5 VCSEL MARKET: PORTER’S FIVE FORCES ANALYSIS
           5.13.1 INTENSITY OF COMPETITIVE RIVALRY
           5.13.2 BARGAINING POWER OF SUPPLIERS
           5.13.3 BARGAINING POWER OF BUYERS
           5.13.4 THREAT OF SUBSTITUTES
           5.13.5 THREAT OF NEW ENTRANTS
    5.14 VCSEL MARKET: SUPPLY CHAIN 
    5.15 TRENDS AND DISRUPTIONS IMPACTING CUSTOMER BUSINESS 
           FIGURE 32 REVENUE SHIFTS FOR VCSEL MARKET
 
6 VCSEL FABRICATION METHODS (Page No. - 80)
    6.1 INTRODUCTION 
    6.2 SELECTIVE OXIDIZATION 
           6.2.1 LEADS TO PRODUCTION OF STRONG ELECTRICAL AND OPTICAL CONFINEMENT
    6.3 ION IMPLANTATION 
           6.3.1 PROVIDES HIGHLY CONTROLLED APERTURE THAT LEADS TO HIGHER AND MORE STABLE PRODUCTIVITY OF VCSELS
 
7 APPLICATIONS OF VCSEL TECHNOLOGY IN SMARTPHONES (Page No. - 81)
    7.1 INTRODUCTION 
    7.2 DOT PROJECTOR 
           7.2.1 ENABLES FACIAL RECOGNITION FEATURE IN SMARTPHONES
    7.3 TIME-OF-FLIGHT (TOF) 
           7.3.1 TOF MODULES USE VCSELS TO RELEASE INFRARED LIGHT
           7.3.2 PROXIMITY SENSING
    7.4 FLOOD ILLUMINATOR 
           7.4.1 VCSELS USED BY FLOOD ILLUMINATORS TO PROJECT INFRARED LIGHT USED TO ILLUMINATE FACE OF USERS
 
8 VCSEL MARKET, BY TYPE (Page No. - 83)
    8.1 INTRODUCTION 
           FIGURE 33 MULTIMODE SEGMENT TO HOLD LARGER MARKET SHARE DURING FORECAST PERIOD
           TABLE 6 VCSEL MARKET, BY TYPE, 2018–2022 (USD MILLION)
           TABLE 7 VCSEL MARKET, BY TYPE, 2023–2028 (USD MILLION)
    8.2 SINGLE-MODE 
           8.2.1 SINGLE-MODE VCSELS USED FOR LOW-POWER APPLICATIONS
                    TABLE 8 SINGLE-MODE: VCSEL MARKET, BY MATERIAL, 2018–2022 (USD MILLION)
                    TABLE 9 SINGLE-MODE: VCSEL MARKET, BY MATERIAL, 2023–2028 (USD MILLION)
                    TABLE 10 SINGLE-MODE: VCSEL MARKET, BY WAVELENGTH, 2018–2022 (USD MILLION)
                    TABLE 11 SINGLE-MODE: VCSEL MARKET, BY WAVELENGTH, 2023–2028 (USD MILLION)
    8.3 MULTIMODE 
           8.3.1 MULTIMODE VCSELS USED FOR HIGH-POWER APPLICATIONS
                    TABLE 12 MULTIMODE: VCSEL MARKET, BY MATERIAL, 2018–2022 (USD MILLION)
                    TABLE 13 MULTIMODE: VCSEL MARKET, BY MATERIAL, 2023–2028 (USD MILLION)
                    TABLE 14 MULTIMODE: VCSEL MARKET, BY WAVELENGTH, 2018–2022 (USD MILLION)
                    TABLE 15 MULTIMODE: VCSEL MARKET, BY WAVELENGTH, 2023–2028 (USD MILLION)
 
9 VCSEL MARKET, BY WAVELENGTH (Page No. - 88)
    9.1 INTRODUCTION 
           FIGURE 34 NIR SEGMENT TO HOLD LARGEST MARKET SHARE DURING FORECAST PERIOD
           TABLE 16 VCSEL MARKET, BY WAVELENGTH, 2018–2022 (USD MILLION)
           TABLE 17 VCSEL MARKET, BY WAVELENGTH, 2023–2028 (USD MILLION)
    9.2 RED 
           9.2.1 VCSELS IN RED BAND HAVE WAVELENGTHS IN BETWEEN 650 NM AND 750 NM
                    TABLE 18 RED: VCSEL MARKET, BY TYPE, 2018–2022 (USD MILLION)
                    TABLE 19 RED: VCSEL MARKET, BY TYPE, 2023–2028 (USD MILLION)
    9.3 NEAR-INFRARED (NIR) 
           9.3.1 VCSELS IN NIR BAND HAVE WAVELENGTHS BETWEEN 750 NM AND 1,400 NM
                    TABLE 20 NIR: VCSEL MARKET, BY TYPE, 2018–2022 (USD MILLION)
                    TABLE 21 NIR: VCSEL MARKET, BY TYPE, 2023–2028 (USD MILLION)
    9.4 SHORTWAVE INFRARED (SWIR) 
           9.4.1 VCSELS IN SWIR BAND HAVE WAVELENGTHS BETWEEN 1,400 NM AND 3,000 NM
                    TABLE 22 SWIR: VCSEL MARKET, BY TYPE, 2018–2022 (USD MILLION)
                    TABLE 23 SWIR: VCSEL MARKET, BY TYPE, 2023–2028 (USD MILLION)
 
10 VCSEL MARKET, BY MATERIAL (Page No. - 93)
     10.1 INTRODUCTION 
           FIGURE 35 GAAS-BASED VCSEL TO DOMINATE MARKET DURING FORECAST PERIOD
           TABLE 24 VCSEL MARKET, BY MATERIAL, 2018–2022 (USD MILLION)
           TABLE 25 VCSEL MARKET, BY MATERIAL, 2023–2028 (USD MILLION)
     10.2 GALLIUM ARGESIDE (GAAS) 
             10.2.1 GAAS-BASED VCSELS TO REGISTER HIGHEST CAGR DURING FORECAST PERIOD
                        TABLE 26 GAAS: VCSEL MARKET, BY TYPE, 2018–2022 (USD MILLION)
                        TABLE 27 GAAS: VCSEL MARKET, BY TYPE, 2023–2028 (USD MILLION)
     10.3 INDIUM PHOSPHIDE (INP) 
             10.3.1 MORE EXPENSIVE THAN GAAS DUE TO MATERIAL COSTS AND SMALL WAFER SIZE
                        TABLE 28 INP: VCSEL MARKET, BY TYPE, 2018–2022 (USD MILLION)
                        TABLE 29 INP: VCSEL MARKET, BY TYPE, 2023–2028 (USD MILLION)
     10.4 OTHERS 
             10.4.1 VCSELS IN THE SWIR BAND HAVE WAVELENGTH BETWEEN 1,400 NM AND 3,000 NM
                        TABLE 30 OTHERS: VCSEL MARKET, BY TYPE, 2018–2022 (USD MILLION)
                        TABLE 31 OTHERS: VCSEL MARKET, BY TYPE, 2023–2028 (USD MILLION)
 
11 VCSEL MARKET, BY APPLICATION (Page No. - 98)
     11.1 INTRODUCTION 
             FIGURE 36 SENSING SEGMENT TO HOLD LARGEST SHARE OF VCSEL MARKET DURING FORECAST PERIOD
             TABLE 32 VCSEL MARKET, BY APPLICATION, 2018–2022 (USD MILLION)
             TABLE 33 VCSEL MARKET, BY APPLICATION, 2023–2028 (USD MILLION)
     11.2 SENSING 
             11.2.1 3D SENSING
                        11.2.1.1 ToF camera
                                     11.2.1.1.1 Proximity sensing
                                                    11.2.1.1.1.1 Proximity sensing widely used in smartphones
                        11.2.1.2 Structured light illumination
                                     11.2.1.2.1 Increasing adoption of face recognition technologies in smart devices to create lucrative opportunities
                        11.2.1.3 Facial & gesture recognition
                                     11.2.1.3.1 Increase in adoption of biometric technologies in smart devices to drive market
             11.2.2 GAS SENSING
                        11.2.2.1 Single-mode VCSELs used for gas sensing in industrial environments
             11.2.3 OPTICAL MICE
                        11.2.3.1 VCSEL-based optical mouse enables operations on various surfaces
     11.3 DATA COMMUNICATION 
             11.3.1 OPTICAL TRANSCEIVERS & ACTIVE OPTICAL CABLES
                        11.3.1.1 Growing adoption of high data rate optical components in data centers to propel market
     11.4 INDUSTRIAL HEATING & LASER PRINTING 
             11.4.1 ADDITIVE MANUFACTURING
                        11.4.1.1 VCSEL heating reduces thermal gradient in additive manufacturing
             11.4.2 LASER PRINTING
                        11.4.2.1 Laser printing requires low-cost, single-mode VCSELs
     11.5 EMERGING & OTHER APPLICATIONS 
             11.5.1 LIDAR
                        11.5.1.1 Developments in autonomous vehicles to create opportunities for applications of VCSELs in automotive LiDARs
             11.5.2 IN-CABIN SENSING
                        11.5.2.1 Innovations in vehicle infotainment systems to boost demand for VCSELs
             11.5.3 ATOMIC CLOCK & GPS
                        11.5.3.1 VCSELs make for compact and low-cost solutions for use in atomic clocks
             11.5.4 MAGNETOMETER
                        11.5.4.1 Highly accurate detection of magnetic fields made possible with use of VCSEL-based magnetometers
             11.5.5 INFRARED ILLUMINATION FOR SURVEILLANCE
                        11.5.5.1 VCSELs improve performance and visibility in security & surveillance applications
             11.5.6 PULSE OXIMETRY
                        11.5.6.1 VCSELs provide benefits of narrower spectral linewidth emission for pulse oximetry applications
 
12 VCSEL MARKET, BY DATA RATE (Page No. - 107)
     12.1 INTRODUCTION 
             FIGURE 37 ABOVE 25 GBPS SEGMENT TO GROW AT HIGHEST CAGR DURING FORECAST PERIOD
             TABLE 34 VCSEL MARKET FOR DATA COMMUNICATION, BY DATA RATE, 2018–2022 (USD MILLION)
             TABLE 35 VCSEL MARKET FOR DATA COMMUNICATION, BY DATA RATE, 2023–2028 (USD MILLION)
     12.2 UP TO 10 GBPS 
             12.2.1 VCSELS WITH DATA RATES UP TO 10 GBPS USED IN DATA COMMUNICATION APPLICATIONS
                        TABLE 36 VCSELS WITH DATA RATE UP TO 10 GBPS
     12.3 10.1 TO 25 GBPS 
             12.3.1 VCSELS WITH DATA RATE OF 10.1 TO 25 GBPS DOMINATED MARKET IN 2022
                        TABLE 37 VCSELS WITH DATA RATE OF 10.1 TO 25 GBPS
     12.4 ABOVE 25 GBPS 
             12.4.1 VCSELS WITH DATA RATE ABOVE 25 GBPS TO RECORD HIGHEST GROWTH DURING FORECAST PERIOD
                        TABLE 38 VCSELS WITH DATA RATE ABOVE 25 GBPS
 
13 VCSEL MARKET, BY INDUSTRY (Page No. - 113)
     13.1 INTRODUCTION 
             FIGURE 38 CONSUMER ELECTRONICS INDUSTRY TO BE LARGEST SHAREHOLDER OF VCSEL MARKET DURING FORECAST PERIOD
             TABLE 39 VCSEL MARKET, BY INDUSTRY, 2018–2022 (USD MILLION)
             TABLE 40 VCSEL MARKET, BY INDUSTRY, 2023–2028 (USD MILLION)
     13.2 CONSUMER ELECTRONICS 
             13.2.1 CONSUMER ELECTRONICS HELD DOMINANT MARKET SHARE IN 2022
                        TABLE 41 CONSUMER ELECTRONICS: VCSEL MARKET, BY REGION, 2018–2022 (USD MILLION)
                        TABLE 42 CONSUMER ELECTRONICS: VCSEL MARKET, BY REGION, 2023–2028 (USD MILLION)
                        TABLE 43 CONSUMER ELECTRONICS: VCSEL MARKET IN NORTH AMERICA, BY COUNTRY, 2018–2022 (USD MILLION)
                        TABLE 44 CONSUMER ELECTRONICS: VCSEL MARKET IN NORTH AMERICA, BY COUNTRY, 2023–2028 (USD MILLION)
                        TABLE 45 CONSUMER ELECTRONICS: VCSEL MARKET IN EUROPE, BY COUNTRY, 2018–2022 (USD MILLION)
                        TABLE 46 CONSUMER ELECTRONICS: VCSEL MARKET IN EUROPE, BY COUNTRY, 2023–2028 (USD MILLION)
                        TABLE 47 CONSUMER ELECTRONICS: VCSEL MARKET IN ASIA PACIFIC, BY COUNTRY, 2018–2022 (USD MILLION)
                        TABLE 48 CONSUMER ELECTRONICS: VCSEL MARKET IN ASIA PACIFIC, BY COUNTRY, 2023–2028 (USD MILLION)
                        TABLE 49 CONSUMER ELECTRONICS: VCSEL MARKET IN REST OF THE WORLD, BY REGION, 2018–2022 (USD MILLION)
                        TABLE 50 CONSUMER ELECTRONICS: VCSEL MARKET IN REST OF THE WORLD, BY REGION, 2023–2028 (USD MILLION)
     13.3 DATA CENTER 
             13.3.1 INCREASE IN DATA BANDWIDTH IN DATA CENTERS TO DRIVE DEMAND FOR VCSELS
                        TABLE 51 DATA CENTER: VCSEL MARKET, BY REGION, 2018–2022 (USD MILLION)
                        TABLE 52 DATA CENTER: VCSEL MARKET, BY REGION, 2023–2028 (USD MILLION)
                        TABLE 53 DATA CENTER: VCSEL MARKET IN NORTH AMERICA, BY COUNTRY, 2018–2022 (USD MILLION)
                        TABLE 54 DATA CENTER: VCSEL MARKET IN NORTH AMERICA, BY COUNTRY, 2023–2028 (USD MILLION)
                        TABLE 55 DATA CENTER: VCSEL MARKET IN EUROPE, BY COUNTRY, 2018–2022 (USD MILLION)
                        TABLE 56 DATA CENTER: VCSEL MARKET IN EUROPE, BY COUNTRY, 2023–2028 (USD MILLION)
                        TABLE 57 DATA CENTER: VCSEL MARKET IN ASIA PACIFIC, BY COUNTRY, 2018–2022 (USD MILLION)
                        TABLE 58 DATA CENTER: VCSEL MARKET IN ASIA PACIFIC, BY COUNTRY, 2023–2028 (USD MILLION)
                        TABLE 59 DATA CENTER: VCSEL MARKET IN REST OF THE WORLD, BY REGION, 2018–2022 (USD MILLION)
                        TABLE 60 DATA CENTER: VCSEL MARKET IN REST OF THE WORLD, BY REGION, 2023–2028 (USD MILLION)
     13.4 AUTOMOTIVE 
             13.4.1 ADOPTION OF VCSELS IN AUTOMOTIVE LIDAR TO BOOST MARKET IN REST OF THE WORLD
                        TABLE 61 AUTOMOTIVE: VCSEL MARKET, BY REGION, 2018–2022 (USD MILLION)
                        TABLE 62 AUTOMOTIVE: VCSEL MARKET, BY REGION, 2023–2028 (USD MILLION)
                        TABLE 63 AUTOMOTIVE: VCSEL MARKET IN NORTH AMERICA, BY COUNTRY, 2018–2022 (USD THOUSAND)
                        TABLE 64 AUTOMOTIVE: VCSEL MARKET IN NORTH AMERICA, BY COUNTRY, 2023–2028 (USD THOUSAND)
                        TABLE 65 AUTOMOTIVE: VCSEL MARKET IN EUROPE, BY COUNTRY, 2018–2022 (USD THOUSAND)
                        TABLE 66 AUTOMOTIVE: VCSEL MARKET IN EUROPE, BY COUNTRY, 2023–2028 (USD THOUSAND)
                        TABLE 67 AUTOMOTIVE: VCSEL MARKET IN ASIA PACIFIC, BY COUNTRY, 2018–2022 (USD THOUSAND)
                        TABLE 68 AUTOMOTIVE: VCSEL MARKET IN ASIA PACIFIC, BY COUNTRY, 2023–2028 (USD THOUSAND)
                        TABLE 69 AUTOMOTIVE: VCSEL MARKET IN REST OF THE WORLD, BY REGION, 2018–2022 (USD THOUSAND)
                        TABLE 70 AUTOMOTIVE: VCSEL MARKET IN REST OF THE WORLD, BY REGION, 2023–2028 (USD THOUSAND)
     13.5 COMMERCIAL & INDUSTRIAL 
             13.5.1 ADOPTION OF VCSELS ACROSS VARIOUS INDUSTRIAL APPLICATIONS TO FAVOR MARKET
                        TABLE 71 COMMERCIAL & INDUSTRIAL: VCSEL MARKET, BY REGION, 2018–2022 (USD MILLION)
                        TABLE 72 COMMERCIAL & INDUSTRIAL: VCSEL MARKET, BY REGION, 2023–2028 (USD MILLION)
                        TABLE 73 COMMERCIAL & INDUSTRIAL: VCSEL MARKET IN NORTH AMERICA, BY COUNTRY, 2018–2022 (USD MILLION)
                        TABLE 74 COMMERCIAL & INDUSTRIAL: VCSEL MARKET IN NORTH AMERICA, BY COUNTRY, 2023–2028 (USD MILLION)
                        TABLE 75 COMMERCIAL & INDUSTRIAL: VCSEL MARKET IN EUROPE, BY COUNTRY, 2018–2022 (USD MILLION)
                        TABLE 76 COMMERCIAL & INDUSTRIAL: VCSEL MARKET IN EUROPE, BY COUNTRY, 2023–2028 (USD MILLION)
                        TABLE 77 COMMERCIAL & INDUSTRIAL: VCSEL MARKET IN ASIA PACIFIC, BY COUNTRY, 2018–2022 (USD MILLION)
                        TABLE 78 COMMERCIAL & INDUSTRIAL: VCSEL MARKET IN ASIA PACIFIC, BY COUNTRY, 2023–2028 (USD MILLION)
                        TABLE 79 COMMERCIAL & INDUSTRIAL: VCSEL MARKET IN REST OF THE WORLD, BY REGION, 2018–2022 (USD THOUSAND)
                        TABLE 80 COMMERCIAL & INDUSTRIAL: VCSEL MARKET IN REST OF THE WORLD, BY REGION, 2023–2028 (USD THOUSAND)
     13.6 HEALTHCARE 
             13.6.1 VCSELS USED FOR SCANNING AND IMAGING APPLICATIONS IN HEALTHCARE INDUSTRY
                        TABLE 81 HEALTHCARE: VCSEL MARKET, BY REGION, 2018–2022 (USD MILLION)
                        TABLE 82 HEALTHCARE: VCSEL MARKET, BY REGION, 2023–2028 (USD MILLION)
                        TABLE 83 HEALTHCARE: VCSEL MARKET IN NORTH AMERICA, BY COUNTRY, 2018–2022 (USD MILLION)
                        TABLE 84 HEALTHCARE: VCSEL MARKET IN NORTH AMERICA, BY COUNTRY, 2023–2028 (USD MILLION)
                        TABLE 85 HEALTHCARE: VCSEL MARKET IN EUROPE, BY COUNTRY, 2018–2022 (USD MILLION)
                        TABLE 86 HEALTHCARE: VCSEL MARKET IN EUROPE, BY COUNTRY, 2023–2028 (USD MILLION)
                        TABLE 87 HEALTHCARE: VCSEL MARKET IN ASIA PACIFIC, BY COUNTRY, 2018–2022 (USD MILLION)
                        TABLE 88 HEALTHCARE: VCSEL MARKET IN ASIA PACIFIC, BY COUNTRY, 2023–2028 (USD MILLION)
                        TABLE 89 HEALTHCARE: VCSEL MARKET IN REST OF THE WORLD, BY REGION, 2018–2022 (USD THOUSAND)
                        TABLE 90 HEALTHCARE: VCSEL MARKET IN REST OF THE WORLD, BY REGION, 2023–2028 (USD THOUSAND)
     13.7 MILITARY 
             13.7.1 VCSELS USED FOR TACTICAL SURVEILLANCE AND OBSTACLE DETECTION IN MILITARY TASKS
                        TABLE 91 MILITARY: VCSEL MARKET, BY REGION, 2018–2022 (USD MILLION)
                        TABLE 92 MILITARY: VCSEL MARKET, BY REGION, 2023–2028 (USD MILLION)
                        TABLE 93 MILITARY: VCSEL MARKET IN NORTH AMERICA, BY COUNTRY, 2018–2022 (USD MILLION)
                        TABLE 94 MILITARY: VCSEL MARKET IN NORTH AMERICA, BY COUNTRY, 2023–2028 (USD MILLION)
                        TABLE 95 MILITARY: VCSEL MARKET IN EUROPE, BY COUNTRY, 2018–2022 (USD MILLION)
                        TABLE 96 MILITARY: VCSEL MARKET IN EUROPE, BY COUNTRY, 2023–2028 (USD MILLION)
                        TABLE 97 MILITARY: VCSEL MARKET IN ASIA PACIFIC, BY COUNTRY, 2018–2022 (USD MILLION)
                        TABLE 98 MILITARY: VCSEL MARKET IN ASIA PACIFIC, BY COUNTRY, 2023–2028 (USD MILLION)
                        TABLE 99 MILITARY: VCSEL MARKET IN REST OF THE WORLD, BY REGION, 2018–2022 (USD THOUSAND)
                        TABLE 100 MILITARY: VCSEL MARKET IN REST OF THE WORLD, BY REGION, 2023–2028 (USD THOUSAND)
 
14 VCSEL MARKET, BY REGION (Page No. - 138)
     14.1 INTRODUCTION 
             FIGURE 39 VCSEL MARKET IN ASIA PACIFIC TO GROW AT HIGHEST CAGR DURING FORECAST PERIOD
             TABLE 101 VCSEL MARKET, BY REGION, 2018–2022 (USD MILLION)
             TABLE 102 VCSEL MARKET, BY REGION, 2023–2028 (USD MILLION)
     14.2 NORTH AMERICA 
             14.2.1 RECESSION IMPACT ON NORTH AMERICA
                        FIGURE 40 NORTH AMERICA: VCSEL MARKET SNAPSHOT
                        TABLE 103 NORTH AMERICA: VCSEL MARKET, BY COUNTRY, 2018–2022 (USD MILLION)
                        TABLE 104 NORTH AMERICA: VCSEL MARKET, BY COUNTRY, 2023–2028 (USD MILLION)
                        TABLE 105 US: VCSEL MARKET, BY INDUSTRY, 2018–2022 (USD MILLION)
                        TABLE 106 US: VCSEL MARKET, BY INDUSTRY, 2023–2028 (USD MILLION)
                        TABLE 107 CANADA: VCSEL MARKET, BY INDUSTRY, 2018–2022 (USD MILLION)
                        TABLE 108 CANADA: VCSEL MARKET, BY INDUSTRY, 2023–2028 (USD MILLION)
                        TABLE 109 MEXICO: VCSEL MARKET, BY INDUSTRY, 2018–2022 (USD THOUSAND)
                        TABLE 110 MEXICO: VCSEL MARKET, BY INDUSTRY, 2023–2028 (USD THOUSAND)
             14.2.2 US
                        14.2.2.1 US to dominate global VCSEL market during forecast period
             14.2.3 CANADA
                        14.2.3.1 Data communication applications to drive market
             14.2.4 MEXICO
                        14.2.4.1 Automotive industry to provide opportunities for market growth
     14.3 EUROPE 
             14.3.1 RECESSION IMPACT ON EUROPE
                        FIGURE 41 EUROPE: VCSEL MARKET SNAPSHOT
                        TABLE 111 EUROPE: VCSEL MARKET, BY COUNTRY, 2018–2022 (USD MILLION)
                        TABLE 112 EUROPE: VCSEL MARKET, BY COUNTRY, 2023–2028 (USD MILLION)
                        TABLE 113 UK: VCSEL MARKET, BY INDUSTRY, 2018–2022 (USD THOUSAND)
                        TABLE 114 UK: VCSEL MARKET, BY INDUSTRY, 2023–2028 (USD THOUSAND)
                        TABLE 115 GERMANY: VCSEL MARKET, BY INDUSTRY, 2018–2022 (USD MILLION)
                        TABLE 116 GERMANY: VCSEL MARKET, BY INDUSTRY, 2023–2028 (USD MILLION)
                        TABLE 117 FRANCE: VCSEL MARKET, BY INDUSTRY, 2018–2022 (USD THOUSAND)
                        TABLE 118 FRANCE: VCSEL MARKET, BY INDUSTRY, 2023–2028 (USD THOUSAND)
                        TABLE 119 REST OF EUROPE: VCSEL MARKET, BY INDUSTRY, 2018–2022 (USD THOUSAND)
                        TABLE 120 REST OF EUROPE: VCSEL MARKET, BY INDUSTRY, 2023–2028 (USD THOUSAND)
             14.3.2 GERMANY
                        14.3.2.1 Germany to hold largest share of VCSEL market in Europe during forecast period
             14.3.3 UK
                        14.3.3.1 Consumer electronics and communications sectors to drive market in UK
             14.3.4 FRANCE
                        14.3.4.1 Demand from automotive industry to substantiate market growth
             14.3.5 REST OF EUROPE
     14.4 ASIA PACIFIC 
             14.4.1 RECESSION IMPACT ON ASIA PACIFIC
                        FIGURE 42 ASIA PACIFIC: VCSEL MARKET SNAPSHOT
                        TABLE 121 ASIA PACIFIC: VCSEL MARKET, BY COUNTRY, 2018–2022 (USD MILLION)
                        TABLE 122 ASIA PACIFIC: VCSEL MARKET, BY COUNTRY, 2023–2028 (USD MILLION)
                        TABLE 123 CHINA: VCSEL MARKET, BY INDUSTRY, 2018–2022 (USD MILLION)
                        TABLE 124 CHINA: VCSEL MARKET, BY INDUSTRY, 2023–2028 (USD MILLION)
                        TABLE 125 JAPAN: VCSEL MARKET, BY INDUSTRY, 2018–2022 (USD MILLION)
                        TABLE 126 JAPAN: VCSEL MARKET, BY INDUSTRY, 2023–2028 (USD MILLION)
                        TABLE 127 SOUTH KOREA: VCSEL MARKET, BY INDUSTRY, 2018–2022 (USD THOUSAND)
                        TABLE 128 SOUTH KOREA: VCSEL MARKET, BY INDUSTRY, 2023–2028 (USD THOUSAND)
                        TABLE 129 REST OF ASIA PACIFIC: VCSEL MARKET, BY INDUSTRY, 2018–2022 (USD MILLION)
                        TABLE 130 REST OF ASIA PACIFIC: VCSEL MARKET, BY INDUSTRY, 2023–2028 (USD MILLION)
             14.4.2 CHINA
                        14.4.2.1 China to account for largest share of VCSEL market in Asia Pacific during forecast period
             14.4.3 JAPAN
                        14.4.3.1 Demand from consumer electronics and data center verticals to drive VCSEL market
             14.4.4 SOUTH KOREA
                        14.4.4.1 VCSEL market in South Korea dominated by consumer electronics and telecommunications industries
             14.4.5 REST OF ASIA PACIFIC
     14.5 REST OF THE WORLD 
             14.5.1 RECESSION IMPACT ON REST OF THE WORLD
                        TABLE 131 REST OF THE WORLD: VCSEL MARKET, BY REGION, 2018–2022 (USD MILLION)
                        TABLE 132 REST OF THE WORLD: VCSEL MARKET, BY REGION, 2023–2028 (USD MILLION)
                        TABLE 133 SOUTH AMERICA: VCSEL MARKET, BY INDUSTRY, 2018–2022 (USD THOUSAND)
                        TABLE 134 SOUTH AMERICA: VCSEL MARKET, BY INDUSTRY, 2023–2028 (USD THOUSAND)
                        TABLE 135 MIDDLE EAST & AFRICA: VCSEL MARKET, BY INDUSTRY, 2018–2022 (USD THOUSAND)
                        TABLE 136 MIDDLE EAST & AFRICA: VCSEL MARKET, BY INDUSTRY, 2023–2028 (USD THOUSAND)
             14.5.2 SOUTH AMERICA
                        14.5.2.1 South America to hold larger share of VCSEL market in RoW during forecast period
             14.5.3 MIDDLE EAST AND AFRICA
                        14.5.3.1 VCSEL market in Middle East & Africa at nascent stage
 
15 COMPETITIVE LANDSCAPE (Page No. - 160)
     15.1 OVERVIEW 
     15.2 STRATEGIES ADOPTED BY KEY PLAYERS 
             TABLE 137 OVERVIEW OF STRATEGIES DEPLOYED BY VCSEL MANUFACTURERS
             15.2.1 PRODUCT PORTFOLIO
             15.2.2 REGIONAL FOCUS
             15.2.3 MANUFACTURING FOOTPRINT
             15.2.4 ORGANIC/INORGANIC GROWTH STRATEGIES
     15.3 MARKET SHARE ANALYSIS: VCSEL MARKET, 2022 
             TABLE 138 DEGREE OF COMPETITION, 2022
     15.4 FIVE-YEAR COMPANY REVENUE ANALYSIS 
             FIGURE 43 FIVE-YEAR REVENUE ANALYSIS OF TOP FOUR PLAYERS IN VCSEL MARKET
     15.5 COMPANY EVALUATION QUADRANT 
             15.5.1 STARS
             15.5.2 EMERGING LEADERS
             15.5.3 PERVASIVE PLAYERS
             15.5.4 PARTICIPANTS
                        FIGURE 44 VCSEL COMPANY EVALUATION QUADRANT, 2022
             15.5.5 COMPANY FOOTPRINT
                        TABLE 139 OVERALL COMPANY FOOTPRINT
                        TABLE 140 COMPANY PRODUCT TYPE FOOTPRINT
                        TABLE 141 COMPANY INDUSTRY FOOTPRINT
                        TABLE 142 COMPANY REGION FOOTPRINT
     15.6 START-UP/SME EVALUATION MATRIX 
             TABLE 143 LIST OF START-UP/SME COMPANIES IN VCSEL MARKET
             15.6.1 PROGRESSIVE COMPANIES
             15.6.2 RESPONSIVE COMPANIES
             15.6.3 DYNAMIC COMPANIES
             15.6.4 STARTING BLOCKS
                        FIGURE 45 VCSEL MARKET, START-UP/SME EVALUATION MATRIX, 2022
     15.7 COMPETITIVE SCENARIOS AND TRENDS 
             15.7.1 PRODUCT LAUNCHES
                        TABLE 144 PRODUCT LAUNCHES, 2019–2022
             15.7.2 DEALS
                        TABLE 145 DEALS, 2019–2022
 
16 COMPANY PROFILES (Page No. - 178)
     16.1 KEY PLAYERS 
(Business Overview, Products Offered, Recent Developments, MnM View, Right to win, Strategic choices made, Weaknesses and competitive threats)*  
             16.1.1 COHERENT CORP.
                        TABLE 146 COHERENT: BUSINESS OVERVIEW
                        FIGURE 46 COHERENT: COMPANY SNAPSHOT
             16.1.2 LUMENTUM
                        TABLE 147 LUMENTUM: BUSINESS OVERVIEW
                        FIGURE 47 LUMENTUM: COMPANY SNAPSHOT
             16.1.3 AMS-OSRAM
                        TABLE 148 AMS-OSRAM: BUSINESS OVERVIEW
                        FIGURE 48 AMS-OSRAM: COMPANY SNAPSHOT
             16.1.4 TRUMPF
                        TABLE 149 TRUMPF: BUSINESS OVERVIEW
                        FIGURE 49 TRUMPF: COMPANY SNAPSHOT
             16.1.5 BROADCOM
                        TABLE 150 BROADCOM: BUSINESS OVERVIEW
                        FIGURE 50 BROADCOM: COMPANY SNAPSHOT
             16.1.6 MKS INSTRUMENTS
                        TABLE 151 MKS INSTRUMENTS: BUSINESS OVERVIEW
                        FIGURE 51 MKS INSTRUMENTS: COMPANY SNAPSHOT
             16.1.7 SANTEC
                        TABLE 152 SANTEC: BUSINESS OVERVIEW
                        FIGURE 52 SANTEC: COMPANY SNAPSHOT
             16.1.8 LEONARDO ELECTRONICS
                        TABLE 153 LEONARDO ELECTRONICS: BUSINESS OVERVIEW
             16.1.9 VERTILAS
                        TABLE 154 VERTILAS: BUSINESS OVERVIEW
             16.1.10 VERTILITE
                        TABLE 155 VERTILITE: BUSINESS OVERVIEW
     16.2 OTHER KEY PLAYERS 
             16.2.1 ALIGHT TECHNOLOGIES
             16.2.2 TELEDYNE FLIR
             16.2.3 INNEOS
             16.2.4 IQE
             16.2.5 THORLABS
             16.2.6 TT ELECTRONICS
             16.2.7 USHIO AMERICA
             16.2.8 WIN SEMICONDUCTORS
             16.2.9 FRANKFURT LASER COMPANY
             16.2.10 INPHENIX, INC.
*Details on Business Overview, Products Offered, Recent Developments, MnM View, Right to win, Strategic choices made, Weaknesses and competitive threats might not be captured in case of unlisted companies.  
 
17 APPENDIX (Page No. - 219)
     17.1 DISCUSSION GUIDE 
     17.2 KNOWLEDGESTORE: MARKETSANDMARKETS’ SUBSCRIPTION PORTAL 
     17.3 CUSTOMIZATION OPTIONS 
     17.4 RELATED REPORTS 
     17.5 AUTHOR DETAILS 


The study involved four major activities in estimating the current size of the VCSEL market. Exhaustive secondary research has been done to collect information on the market, peer market, and parent market. The next step was to validate these findings, assumptions, and sizing with industry experts across the value chain through primary research. Both top-down and bottom-up approaches have been employed to estimate the complete market size. After that, market breakdown and data triangulation methods have been used to estimate the market size of segments and subsegments. Two sources of information-secondary and primary-have been used to identify and collect information for an extensive technical and commercial study of the VCSEL market.  

Secondary Research

Secondary sources referred for this study include company websites, magazines, industry news, associations (Indian Laser Association, International Laser Class Association, Victorian Laser Association, and International Laser Display Association among others), and databases (Factiva and Bloomberg). These secondary sources include annual reports, press releases, and investor presentations of companies, white papers, certified publications, articles by recognized authors, regulatory bodies, trade directories, trade, and databases. The secondary data has been collected and analyzed to arrive at the overall VCSEL market size, which is further validated by primary research.

Primary Research

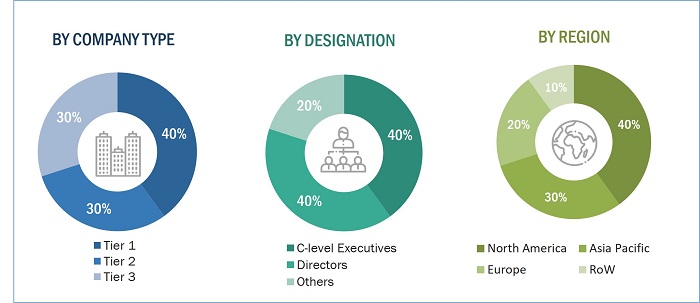
Extensive primary research has been conducted after gaining knowledge about the present scenario of the VCSEL market through secondary research. Several primary interviews have been conducted with market experts from both the demand (adopters of VCSEL used for various VCSEL technology type and its applications) and supply (VCSEL manufacturers, integrators, and distributors) sides across 4 key regions, namely, North America, Europe, Asia Pacific, and Rest of the World. Approximately 25% and 75% of the primary interviews have been conducted with parties from the demand and supply sides, respectively. Primary data has been collected through questionnaires, emails, and telephonic interviews.

After interacting with industry experts, brief sessions were conducted with highly experienced independent consultants to reinforce the findings from our primaries. This, along with the in-house subject matter experts’ opinions, has led us to the findings as described in the remainder of this report.
VCSEL Market Size, and Share

To know about the assumptions considered for the study, download the pdf brochure

Market Size Estimation

In the complete market engineering process, both the top-down and bottom-up approaches, along with several data triangulation methods, have been used to estimate and validate the size of the VCSEL market and other dependent submarkets. The key players in the market have been determined through primary and secondary research. This entire research methodology involves the study of the annual and financial reports of the top market players and extensive interviews with industry experts, such as CEOs, vice presidents, directors, and marketing executives, for both qualitative and quantitative key insights related to the VCSEL market. While estimating and calculating the market sizing of the VCSEL market, recession impact has been considered. All percentage shares, splits, and breakdowns have been determined using secondary sources and verified through primary sources.

  • In the top-down approach, the overall market size has been used to estimate the size of the individual markets (mentioned in the market segmentation) through percentage splits obtained from secondary and primary research.
  • For the calculation of sizes of segments of the VCSEL market, the market size obtained by implementing the bottom-up approach has been used in the top-down approach. This has been later confirmed with primary respondents across different geographies.
  • The bottom-up approach has also been implemented for the data extracted from secondary research to validate the size of various market segments.
  • The market share of each company has been estimated to verify revenue shares used in the bottom-up approach earlier.
  • The sizes of the overall parent and peer markets (Laser Technology market and Edge Emitting Diodes market) and each individual market have been determined and confirmed in this study with the help of a data triangulation procedure and validation of data through primary interviews.

Global VCSEL Market Size: Top-down Approach

VCSEL Market Size, and Top-down  Approach

Data Triangulation

After arriving at the overall market size from the estimation process explained above, the overall market has been split into several segments and subsegments. The market breakdown and data triangulation procedures have been employed, wherever applicable, to complete the overall market engineering process and arrive at the exact statistics for all segments and subsegments. The data has been triangulated by studying various factors and trends from both the demand and supply sides. The market has also been validated using both top-down and bottom-up approaches.

Report Objectives

  • To describe and forecast the VCSEL market, in terms of value and volume, based on type, material, wavelength, application, data rate, and industry.
  • To describe and forecast the market size of the VCSEL market, in terms of value, with regard to four main regions: North America, Europe, Asia Pacific, and the Rest of the World (RoW)
  • To provide detailed information regarding drivers, restraints, opportunities, and challenges influencing the growth of the market
  • To provide a detailed overview of the supply chain of the VCSEL ecosystem
  • To strategically analyze micromarkets1 with respect to individual growth trends, prospects, and contributions to the total market
  • To analyze opportunities in the market for various stakeholders by identifying high-growth segments of the VCSEL market
  • To benchmark players within the market using the proprietary “Competitive Leadership Mapping” framework, which analyzes market players on various parameters within the broad categories of business strategy excellence and strength of product portfolio
  • To strategically profile key players and comprehensively analyze their market position in terms of ranking and core competencies2, along with detailing the competitive landscape of the market
  • To analyze competitive developments, such as acquisitions, product launches and developments, expansions, partnerships, and acquisitions, in the VCSEL market

Available Customizations

MarketsandMarkets offers customizations in the reports according to the client’s specific requirements. The available customization options are as follows:

  • Detailed analysis and profiling of additional market players (up to 5)
Custom Market Research Services

We will customize the research for you, in case the report listed above does not meet with your exact requirements. Our custom research will comprehensively cover the business information you require to help you arrive at strategic and profitable business decisions.

Request Customization

Instant Answers with GPT - Ask Now!

Ask real questions. Get complete answers !
Report Code
SE 3835
Published ON
Feb, 2023
Choose License Type
BUY NOW
  • SHARE
X
Request Customization
Speak to Analyst
Speak to Analyst
OR FACE-TO-FACE MEETING
PERSONALIZE THIS RESEARCH
  • Triangulate with your Own Data
  • Get Data as per your Format and Definition
  • Gain a Deeper Dive on a Specific Application, Geography, Customer or Competitor
  • Any level of Personalization
REQUEST A FREE CUSTOMIZATION
LET US HELP YOU!
  • What are the Known and Unknown Adjacencies Impacting the VCSEL Market
  • What will your New Revenue Sources be?
  • Who will be your Top Customer; what will make them switch?
  • Defend your Market Share or Win Competitors
  • Get a Scorecard for Target Partners
CUSTOMIZED WORKSHOP REQUEST
+1-888-600-6441
  • Call Us
  • +1-888-600-6441 (Corporate office hours)
  • +1-888-600-6441 (US/Can toll free)
  • +44-800-368-9399 (UK office hours)
CONNECT WITH US
ABOUT TRUST ONLINE
©2024 MarketsandMarkets Research Private Ltd. All rights reserved
DMCA.com Protection Status Website Feedback