Waterproofing Chemical Market by Type, End-Use Industry, Application, and Region � Global Forecast to 2030


The waterproofing chemicals market is projected to reach USD 30.88 Billion by 2021, at a CAGR of 12.1%. The report segments the market, by chemistry, into bitumen, PVC, EPDM, TPO, elastomers, by application, into roofing & walls, floors & basements, waste & water management, and, tunnel liners.
The waterproofing chemicals market has also been classified on the basis of system/technology into preformed membranes, coatings & LAMs and integral systems. The market of waterproofing chemicals based on system/technology is further segmented on the basis of the chemistry used for waterproofing system/technology with its market share. The base year considered for the study is 2015, while the forecast period is between 2016 and 2021. The market is driven by the growing building & construction industry, cost effectiveness of waterproofing chemicals, improving economics and quality of construction.
Both top-down and bottom-up approaches have been used to estimate and validate the size of the market and estimate the sizes of the various other dependent submarkets in the overall waterproofing chemical market. The research study involved an extensive use of secondary sources, directories, and databases such as Hoovers, Bloomberg, and, Factiva among other government and private websites, to identify and collect information useful for the technical, market-oriented, and commercial study of the waterproofing chemicals market.
To know about the assumptions considered for the study, download the pdf brochure
Key Players in Waterproofing Chemicals Market
The value-chain for waterproofing chemicals includes manufacturers, such as, The Dow Chemical Company (U.S.), BASF SE (Germany), and, Wacker Chemie AG (Germany), which supply TPO, PVC, and EPDM to waterproofing system/technology providing companies, such as, Carlisle Companies Inc. (U.S.), SIKA AG (U.S.), and W.R Grace & Company (U.S.). The technology/system providers modify and develop the desired waterproofing technology/system for catering to the demand for waterproofing from the end-use industries. These application providers formulate the waterproofing membranes, coatings & LAMs, and, integral systems for meeting the waterproofing requirements from the end-use industries.
Key Target Audience in Waterproofing Chemicals Market
- Manufacturers of waterproofing chemicals
- Technology/system providers of waterproofing chemicals
- Traders, distributors, and waterproofing chemicals suppliers
- Government and regional agencies and research organizations
- Investment research firms
Waterproofing Chemicals Market Report Scope
This research report categorizes the waterproofing chemicals market on the basis of chemistry, system/technology, application, and, region.
On the basis of Chemistry:
- Bitumen
- Elastomers
- PVC
- TPO
- EPDM
On the basis of System/Technology:
- Preformed Membrane
- Coatings & LAMs
- Integral Systems
On the basis of Application:
- Roofing & walls
- Floors & basements
- Waste & water management
- Tunnel liners
- Others
On the basis of Region:
- North America
- Asia-Pacific
- Western Europe
- Central & Eastern Europe
- Latin America
- Middle East & Africa
The market is further analyzed on the basis of key countries in each of these regions.
Available Customizations:
With the given market data, MarketsandMarkets offers customizations according to the specific needs of the companies. The following customization options are available for the report:
Regional Analysis:
- Country-level analysis of the waterproofing chemicals market
Company Information:
- Detailed analysis and profiling of the additional market players
The waterproofing chemicals market is projected to reach USD 30.88 Billion by 2021, at a CAGR of 12.1%. The market is driven by the increase in governmental policies boosting infrastructure growth, improving economics and quality of construction and high demand in developing nations. However, the mature markets of Europe and North America are projected to witness slow growth during the forecast period between 2016 and 2021.
The waterproofing chemicals market has been witnessing many developments over the past few years. They are used for the manufacturing of waterproofing system/technology, which are then further used in various applications, such as, roofing & walls, floor & basements, waste & water management, and tunnel liners. The most common waterproofing chemicals available for the manufacturing of different types of waterproofing systems/technology are bitumen, PVC, TPO, and EPDM.
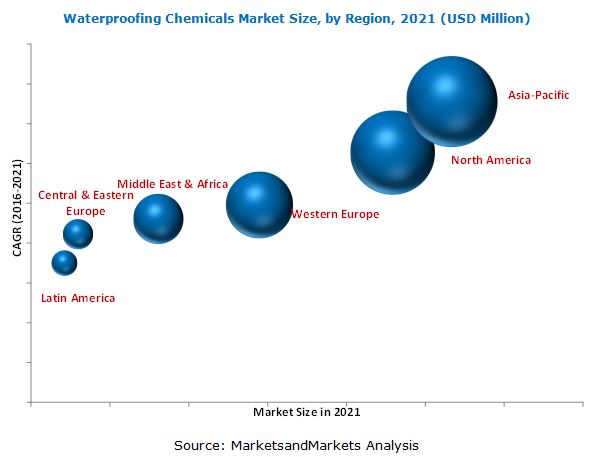
These chemicals are mainly used for the manufacturing of roofing membranes for waterproofing. These roofing membranes are used globally for various applications including solid and liquid waste management, waste & water treatment, mining, and tunnel liners. Asia-Pacific and North America are the key commercial markets for waterproofing chemicals, globally. Asia-Pacific accounted for a major share in the overall waterproofing chemicals market, in terms of volume, due to the growing building & construction industry in the region.
Asia-Pacific, North America, Western Europe, Central & Eastern Europe, Latin America, and Middle East & Africa are considered as the main regions for the waterproofing chemical market in the report. Currently, Asia-Pacific is the largest market of waterproofing chemicals, with the maximum share in the total global market. The waterproofing chemicals market is emerging in various countries such as China, India, Saudi Arabia, and Brazil due to increasing industrial activity. Some of the primary drivers of waterproofing chemicals growth are impressive growth of the construction and water management industry, especially in the developing countries of Asia-Pacific region, followed by the increasing demand in mining applications and the cost-effectiveness of the basic waterproofing chemicals, which is further expected to drive the waterproofing chemicals market, globally.
The waterproofing system/technology manufacturers are affected by price sensitive customers. Most of the waterproofing chemicals are petroleum-based and are vulnerable to fluctuations in the commodity prices. Oil prices have been highly volatile in the recent times. This is a major challenge for the waterproofing chemicals industry to predict the future price of basic raw materials resulting in low investments in waterproofing system related projects.
Key Waterproofing Chemicals Market Industry Players
BASF SE (Germany) has extensive experience in the field of waterproofing chemicals. The company maintains high profitability and revenue as compared to its competitors. This illustrates the overall position of the company in taking investment risks to expand its production capacity as well as market share. It is focusing immensely on research & development for launching new products & services. The company maintains a strong brand image in the waterproofing chemical market, as it provides high-quality products. In 2015, a waterproofing solution was launched that makes concrete structures more durable and resistant to weathering for concrete protection in South Asia. This launch has strengthened the reach of the company in the Asian waterproofing market, resulting in increased revenue in the functional material & solution segment of the company.
Frequently Asked Questions (FAQ):
What is the Waterproofing Chemicals Market growth?
The market size of waterproofing chemicals is estimated to grow from USD 17.43 Billion in 2016 to USD 30.88 Billion, by 2021, at a CAGR of 12.1%.
Who leading market players in Waterproofing Chemicals industry?
The value-chain for waterproofing chemicals includes manufacturers, such as, The Dow Chemical Company (U.S.), BASF SE (Germany), and, Wacker Chemie AG (Germany), which supply TPO, PVC, and EPDM to waterproofing system/technology providing companies, such as, Carlisle Companies Inc. (U.S.), SIKA AG (U.S.), and W.R Grace & Company (U.S.).
How big is the Waterproofing Chemicals Market?
The waterproofing chemicals market is projected to reach USD 30.88 Billion by 2021.
Which segments are covered in Waterproofing Chemicals Market report?
By Chemistry (Bitumen, Elastomers, PVC, TPO, EPDM), System/Technology (Preformed Membranes, Coatings & LAMs, Integral System) & Application (Roofing & Walls, Floors & Basements, Waste & Water Management, Tunnel Liners).
To speak to our analyst for a discussion on the above findings, click Speak to Analyst
Table of Contents
1 Introduction (Page No. - 16)
1.1 Objectives of the Study
1.2 Market Definition
1.3 Market Scope
1.3.1 Markets Covered
1.3.2 Years Considered for the Study
1.4 Limitations
1.5 Stakeholders
2 Research Methodology (Page No. - 19)
2.1 Research Data
2.1.1 Secondary Data
2.1.1.1 Key Data From Secondary Sources
2.1.2 Primary Data
2.1.2.1 Key Data From Primary Sources
2.1.2.2 Key Industry Insights
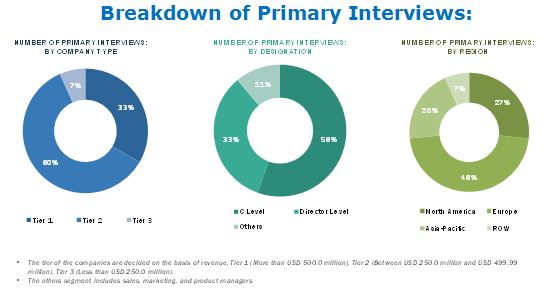
2.1.2.3 Breakdown of Primary Interviews
2.2 Market Size Estimation
2.2.1 Bottom-Up Approach
2.2.2 Top-Down Approach
2.3 Data Triangulation
2.4 Research Assumptions
3 Executive Summary (Page No. - 28)
4 Premium Insights (Page No. - 33)
4.1 Waterproofing Chemicals Market in Asia-Pacific, By Chemistry, and Country
4.2 China Dominated Waterproofing Chemical Market
4.3 Waterproofing Chemicals Market, By Leading Country, 2016-2021 (Kiloton)
4.4 Life Cycle Analysis, By Region
5 Market Overview (Page No. - 38)
5.1 Introduction
5.1.1 Market Segmentation
5.1.2 By Chemistry
5.1.3 By System/Technol0gy
5.1.4 By Application
5.2 Market Dynamics
5.2.1 Drivers
5.2.1.1 Cost Effectiveness of Waterproofing Chemicals
5.2.1.2 High Demand in Developing Nations
5.2.1.3 Improving Economics and Quality of Construction
5.2.2 Restraints
5.2.2.1 Sluggish Growth of Construction Sector in Europe
5.2.3 Opportunities
5.2.3.1 Booming Construction Industry in Developing Regions
5.2.3.2 Increasing Necessity for Water Management Activities in Asia-Pacific
5.2.4 Challenges
5.2.4.1 Fluctuating Waterproofing Chemicals Prices
6 Industry Trends (Page No. - 45)
6.1 Value Chain Analysis
6.2 Porter’s Five Forces Analysis
6.2.1 Threat From New Entrants
6.2.2 Threat of Substitutes
6.2.3 Bargaining Power of Buyers
6.2.4 Bargaining Power of Suppliers
6.2.5 Intensity of Rivalry
6.3 Basic Waterproofing Chemicals
6.3.1 Modified Bitumen
6.3.2 EPDM
6.3.3 PVC
6.3.4 TPO
7 Waterproofing Chemicals, By Chemistry (Page No. - 53)
7.1 Introduction
7.2 Bitumen
7.3 Elastomers
7.4 PVC
7.5 TPO
7.6 EPDM
7.7 Others
8 Waterproofing Chemicals, By System/Technology (Page No. - 67)
8.1 Introduction
8.2 Preformed Membranes
8.3 Coatings & Lams
8.4 Integral Systems
9 Waterproofing Chemicals, By Application (Page No. - 80)
9.1 Introduction
9.2 Roofing & Walls
9.3 Floors & Basements
9.4 Waste & Water Management
9.5 Tunnel Liners
10 Waterproofing Chemicals, By Region (Page No. - 92)
10.1 Introduction
10.2 North America
10.2.1 U.S.
10.2.2 Canada
10.2.3 Mexico
10.3 Western Europe
10.3.1 Germany
10.3.2 France
10.3.3 U.K.
10.3.4 Italy
10.4 Asia-Pacific
10.4.1 China
10.4.2 India
10.4.3 Japan
10.4.4 Australia
10.5 Central & Eastern Europe
10.5.1 Russia
10.5.2 Turkey
10.6 Middle East & Africa
10.6.1 Saudi Arabia
10.7 Latin America
10.7.1 Brazil
11 Competitive Landscape (Page No. - 152)
11.1 Overview
11.2 Competitive Situations and Trends
11.3 Competitive Benchmarking and Landscape
11.3.1 New Product Launches
11.3.2 Expansions
11.3.3 Joint Ventures
11.3.4 Acquisitions
11.3.5 Agreements
11.3.6 Others
12 Company Profiles (Page No. - 161)
12.1 BASF SE
12.1.1 Business Overview
12.1.2 Products Offered
12.1.3 Recent Developments
12.1.4 SWOT Analysis
12.1.5 MnM View
12.2 The DOW Chemical Company
12.2.1 Business Overview
12.2.2 Products Offered
12.2.3 Recent Developments
12.2.4 SWOT Analysis
12.2.5 MnM View
12.3 Mapei S.P.A
12.3.1 Business Overview
12.3.2 Products Offered
12.4 Carlisle Companies Inc.
12.4.1 Business Overview
12.4.2 Products Offered
12.4.3 Recent Developments
12.4.4 SWOT Analysis
12.4.5 MnM View
12.5 Soprema Group
12.5.1 Business Overview
12.5.2 Products Offered
12.5.3 Recent Developments
12.6 Pidilite Industries Limited
12.6.1 Business Overview
12.6.2 Products Offered
12.6.3 Recent Developments
12.6.4 MnM View
12.7 Fosroc International Limited
12.7.1 Business Overview
12.7.2 Products Offered
12.7.3 Recent Developments
12.8 Johns Manville Corporation
12.8.1 Business Overview
12.8.2 Products Offered
12.8.3 Recent Developments
12.9 Drizoro S.A.U.
12.9.1 Business Overview
12.9.2 Products Offered
12.10 Conpro Chemicals Private Limited
12.10.1 Business Overview
12.10.2 Products Offered
12.11 SIKA AG
12.11.1 Business Overview
12.11.2 Products Offered
13 Appendix (Page No. - 192)
13.1 Discussion Guide
13.2 Introducing RT: Real Time Market Intelligence
13.3 Related Reports
List of Tables (129 Tables)
Table 1 Waterproofing Chemicals Market Size, By Region, 2014–2021 (Kiloton)
Table 2 Waterproofing Chemical Market Size, By Region, 2014–2021 (USD Million)
Table 3 Waterproofing Chemicals Market, By Chemistry
Table 4 Waterproofing Chemical Market, By Technology
Table 5 Waterproofing Chemicals Market, By Application
Table 6 Waterproofing Chemical Market Size, By Chemistry, 2014–2021 (Kiloton)
Table 7 Waterproofing Chemicals Market Size, By Chemistry, 2014–2021 (USD Million)
Table 8 Bitumen Market Size, By Region, 2014–2021 (Kiloton)
Table 9 Bitumen Market Size, By Region, 2014–2021 (USD Million)
Table 10 Elastomers Market Size, By Region, 2014–2021 (Kiloton)
Table 11 Elastomers Market Size, By Region, 2014–2021 (USD Million)
Table 12 PVC Market Size, By Region, 2014–2021 (Kiloton)
Table 13 PVC Market Size, By Region, 2014–2021 (USD Million)
Table 14 TPO Market Size, By Region, 2014–2021 (Kiloton)
Table 15 TPO Market Size, By Region, 2014–2021 (USD Million)
Table 16 EPDM Market Size, By Region, 2014–2021 (Kiloton)
Table 17 EPDM Market Size, By Region, 2014–2021 (USD Million)
Table 18 Others Market Size, By Region, 2014–2021 (Kiloton)
Table 19 Others Market Size, By Region, 2014–2021 (USD Million)
Table 20 Waterproofing Chemicals Market Size, By System/Technology, 2014–2021 (Kiloton)
Table 21 Waterproofing Chemical Market Size, By System/Technology, 2014–2021 (USD Million)
Table 22 Preformed Membranes Market Size, By Region, 2014–2021 (Kiloton)
Table 23 Preformed Membranes Market Size, By Region, 2014–2021 (USD Million)
Table 24 Preformed Membranes Market Size, By Type, 2014–2021 (Kiloton)
Table 25 Preformed Membranes Market Size, By Type, 2014–2021 (USD Million)
Table 26 Coatings & Lams Market Size, By Region, 2014–2021 (Kiloton)
Table 27 Coatings & Lams Market Size, By Region, 2014–2021 (USD Million)
Table 28 Coatings & Lams Market Size, By System/Technology, 2014–2021 (Kiloton)
Table 29 Coatings & Lams Market Size, By Type, 2014–2021 (USD Million)
Table 30 Integral Systems Market Size, By Region, 2014–2021 (Kiloton)
Table 31 Integral Systems Market Size, By Region, 2014–2021 (USD Million)
Table 32 Integral Systems Market Size, By Type, 2014–2021 (Kiloton)
Table 33 Integral Systems Market Size, By Type, 2014–2021 (USD Million)
Table 34 Waterproofing Chemicals Market Size, By Application, 2014–2021 (Kiloton)
Table 35 Waterproofing Chemicals Market Size, By Application, 2014–2021 (USD Miillion)
Table 36 Roofing & Walls Market Size, By Region, 2014–2021 (Kiloton)
Table 37 Roofing & Walls Market Size, By Region, 2014–2021 (USD Million)
Table 38 Floors & Basements Market Size, By Region, 2014–2021 (Kiloton)
Table 39 Floors & Basements Market Size, By Region, 2014–2021 (USD Million)
Table 40 Waste & Water Management Market Size, By Region, 2014–2021 (Kiloton)
Table 41 Waste & Water Management Market Size, By Region, 2014–2021 (USD Million)
Table 42 Tunnel Liners Market Size, By Region, 2014–2021 (Kiloton)
Table 43 Tunnel Liners Market Size, By Region, 2014–2021 (USD Million)
Table 44 Waterproofing Chemicals Market Size, By Region, 2014–2021 (Kiloton)
Table 45 Waterproofing Chemical Market Size, By Region, 2014–2021 (USD Million)
Table 46 North America: Waterproofing Chemicals Size, By Country, 2014–2021 (Kiloton)
Table 47 North America: Waterproofing Chemical Market Size, By Country, 2014–2021 (USD Million)
Table 48 North America: Market Size, By Chemistry, 2014–2021 (Kiloton)
Table 49 North America: Market Size, By Chemistry, 2014–2021 (USD Million)
Table 50 North America: Market Size, By System/Technology, 2014–2021 (Kiloton)
Table 51 North America: Market Size, By System/Technology, 2014–2021 (USD Million)
Table 52 North America: emicals Market Size, By Application/End Use Industry 2014–2021 (Kiloton)
Table 53 North America: Market Size, By Application/End Use, 2014–2021 (USD Million)
Table 54 U.S.: Waterproofing Chemicals Market Size, By Application/End Use Industry, 2014–2021 (Kiloton)
Table 55 U.S.: Market Size, By Application/End-Use Industry, 2014–2021 (USD Million)
Table 56 Canada: Waterproofing Chemicals Market Size, By Application/End-Use Industry, 2014–2021 (Kiloton)
Table 57 Canada: Market Size, By Application/End-Use Industry, 2014–2021 (USD Million)
Table 58 Mexico: Waterproofing Chemicals Market Size, By Application/End-Use Industry, 2014–2021 (Kiloton)
Table 59 Mexico: Market Size, By Application/End-Use Industry, 2014–2021 (USD Million)
Table 60 Western Europe: Waterproofing Chemicals Market Size, By Country, 2014–2021 (Kiloton)
Table 61 Western Europe: Market Size, By Country, 2014–2021 (USD Million)
Table 62 Western Europe: Market Size, By Chemistry, 2014–2021 (Kiloton)
Table 63 Western Europe: Market Size, By Chemistry, 2014–2021 (USD Million)
Table 64 Western Europe: Market Size, By System/Technology, 2014–2021 (Kiloton)
Table 65 Western Europe: Market Size, By System/Technology, 2014–2021 (USD Million)
Table 66 Western Europe: Market Size, By Application/End-Use Industry, 2014–2021 (Kiloton)
Table 67 Western Europe: Market Size, By Application/End-Use Industry, 2014–2021 (USD Million)
Table 68 Germany: Waterproofing Chemicals Market Size, By Application/End-Use Industry, 2014–2021 (Kiloton)
Table 69 Germany: Market Size, By Application/End-Use Industry, 2014–2021 (USD Million)
Table 70 France: Waterproofing Chemicals Market Size, By Application/End-Use Industry, 2014–2021 (Kiloton)
Table 71 France: Market Size, By Application/End-Use Industry, 2014–2021 (USD Million)
Table 72 U.K.: Waterproofing Chemicals Market Size, By Application/End-Use Industry, 2014–2021 (Kiloton)
Table 73 U.K.: Market Size, By Application/End-Use Industry, 2014–2021 (USD Million)
Table 74 Italy: Waterproofing Chemicals Market Size, By Application/End-Use Industry, 2014–2021 (Kiloton)
Table 75 Italy: Market Size, By Application/End-Use Industry, 2014–2021 (USD Million)
Table 76 Asia-Pacific: Waterproofing Chemicals Market Size, By Country, 2014–2021 (Kiloton)
Table 77 Asia-Pacific: Market Size, By Country, 2014–2021 (USD Million)
Table 78 Asia-Pacific: Market Size, By Chemistry, 2014–2021 (Kiloton)
Table 79 Asia-Pacific: Market Size, By Chemistry, 2014–2021 (USD Million)
Table 80 Asia-Pacific: Market Size, By System/Technology, 2014–2021 (Kiloton)
Table 81 Asia-Pacific: Market Size, By System/Technology, 2014–2021 (USD Million)
Table 82 Asia-Pacific: Market Size, By Application/End-Use, 2014–2021 (Kiloton)
Table 83 Asia-Pacific: Market Size, By Application/End-Use, 2014–2021 (USD Million)
Table 84 China: Waterproofing Chemicals Market Size, By Application/End-Use Industry, 2014–2021 (Kiloton)
Table 85 China: Market Size, By Application/End-Use Industry, 2014–2021 (USD Million)
Table 86 India: Waterproofing Chemicals Market Size, By Application/End-Use Industry, 2014–2021 (Kiloton)
Table 87 India: Market Size, By Application/End-Use Industry, 2014–2021 (USD Million)
Table 88 Japan: Waterproofing Chemicals Market Size, By Application/End-Use Industry, 2014–2021 (Kiloton)
Table 89 Japan: Market Size, By Application/End-Use Industry, 2014–2021 (USD Million)
Table 90 Australia: Waterproofing Chemicals Market Size, By Application/End-Use Industry, 2014–2021 (Kiloton)
Table 91 Australia: Market Size, By Application/End-Use Industry, 2014–2021 (USD Million)
Table 92 Central & Eastern Europe: Waterproofing Chemicals Market Size, By Country, 2014–2021 (Kiloton)
Table 93 Central & Eastern Europe: Market Size, By Country, 2014–2021 (USD Million)
Table 94 Central & Eastern Europe: Market Size, By Chemistry, 2014–2021 (Kiloton)
Table 95 Central & Eastern Europe: Market Size, By Chemistry, 2014–2021 (USD Million)
Table 96 Central & Eastern Europe: Market Size, By System/Technology, 2014–2021 (Kiloton)
Table 97 Central & Eastern Europe: Market Size, By System/Technology, 2014–2021 (USD Million)
Table 98 Central & Eastern Europe: Market Size, By Application/End-Use Industry, 2014–2021 (Kiloton)
Table 99 Central & Eastern Europe: Market Size, By Application/End-Use Industry, 2014–2021 (USD Million)
Table 100 Russia: Waterproofing Chemicals Market Size, By Application/End-Use Industry, 2014–2021 (Kiloton)
Table 101 Russia: Market Size, By Application/End-Use Industry, 2014–2021 (USD Million)
Table 102 Turkey: Waterproofing Chemicals Market Size, By Application/End-Use Industry, 2014–2021 (Kiloton)
Table 103 Turkey: Market Size, By Application/End-Use Industry, 2014–2021 (USD Million)
Table 104 Middle East & Africa: Waterproofing Chemicals Market Size, By Country, 2014–2021 (Kiloton)
Table 105 Middle East & Africa: Market Size, By Country, 2014–2021 (USD Million)
Table 106 Middle East & Africa: Market Size, By Chemistry, 2014–2021 (Kiloton)
Table 107 Middle East & Africa: Market Size, By Chemistry, 2014–2021 (USD Million)
Table 108 Middle East & Africa: Market Size, By System/Technology, 2014–2021 (Kiloton)
Table 109 Middle East & Africa: Market Size, By System/Technology, 2014–2021 (USD Million)
Table 110 Middle East & Africa: Market Size, By Application/End-Use Industry, 2014–2021 (Kiloton)
Table 111 Middle East & Africa: Market Size, By Application/End-Use Industry, 2014–2021 (USD Million)
Table 112 Saudi Arabia: Waterproofing Chemicals Market Size, By Application/End-Use Industry, 2014–2021 (Kiloton)
Table 113 Saudi Arabia: Market Size, By Application/End-Use Industry, 2014–2021 (USD Million)
Table 114 Latin America: Waterproofing Chemicals Market Size, By Country, 2014–2021 (Kiloton)
Table 115 Latin America: Market Size, By Country, 2014–2021 (USD Million)
Table 116 Latin America: Market Size, By Chemistry, 2014–2021 (Kiloton)
Table 117 Latin America: Market Size, By Chemistry, 2014–2021 (USD Million)
Table 118 Latin America: Market Size, By System/Technology, 2014–2021 (Kiloton)
Table 119 Latin America: Market Size, By System/Technology, 2014–2021 (USD Million)
Table 120 Latin America: Market Size, By Application/End-Use Industry, 2014–2021 (Kiloton)
Table 121 Latin America: Market Size, By Application/End-Use Industry, 2014–2021 (USD Million)
Table 122 Brazil: Waterproofing Chemicals Market Size, By Application/End-Use Industry, 2014–2021 (Kiloton)
Table 123 Brazil: Market Size, By Application/End-Use Industry, 2014–2021 (USD Million)
Table 124 New Product Launches, 2013-2016
Table 125 Expansions, 2013-2016
Table 126 Joint Ventures, 2013-2016
Table 127 Acquisitions, 2013-2016
Table 128 Agreements, 2013-2016
Table 129 Others, 2013-2016
List of Figures (65 Figures)
Figure 1 Waterproofing Chemicals Market: Research Design
Figure 2 Market Size Estimation: Bottom-Up Approach
Figure 3 Market Size Estimation: Top-Down Approach
Figure 4 Data Triangulation
Figure 5 Assumptions of the Research Study
Figure 6 Elastomers Projected to Be the Fastest-Growing By Chemistry Segment of Waterproofing Chemicals, During Forecast Period
Figure 7 Water & Waste Management Application/End-User Industry of Waterproofing Chemical Market to Witness Highest Growth Rate, 2016–2021
Figure 8 Roofing & Walls Application Segment to Continue to Dominate Waterproofing Chemicals Market
Figure 9 Asia-Pacific to Be Fastest-Growing Market of Waterproofing Chemicals Between 2016 and 2021
Figure 10 Attractive Opportunities in Waterproofing Chemical Market, 2016–2021
Figure 11 Asia-Pacific Was Largest Market of Waterproofing Chemicals in Majority of Technology Segments in 2015
Figure 12 Bitumen Accounted for Largest Share in Asia-Pacific in 2015
Figure 13 China Registered Largest Share in Waterproofing Chemical Market in 2015
Figure 14 China to Be Fastest-Growing Market, 2016-2021
Figure 15 Waterproofing Chemicals Market in Asia-Pacific to Witness Highest Growth During Forecast Period
Figure 16 Waterproofing Chemical Market, By Region
Figure 17 Drivers, Restraints, Opportunities, and Challenges for the Waterproofing Chemicals Market
Figure 18 Waterproofing Chemicals: Value Chain Analysis
Figure 19 Porter’s Five Forces Analysis
Figure 20 Bitumen Accounted for the Largest Share in the Waterproofing Chemical Market
Figure 21 Asia-Pacific to Remain the Largest Market for Bitumen Till 2021
Figure 22 North America to Remain the Largest Market for Elastomers Till 2021
Figure 23 Asia-Pacific to Remain the Largest Market for PVC Till 2021
Figure 24 North America to Remain the Largest Market for TPO Till 2021
Figure 25 Asia-Pacific to Remain the Largest Market for EPDM Till 2021
Figure 26 Asia-Pacific to Remain the Largest Market for Others Till 2021
Figure 27 Coatings & Lams System/Technology Segment to Remain Dominant
Figure 28 Asia-Pacific to Remain the Largest Market for Preformed Membranes
Figure 30 Asia-Pacific to Remain the Largest Market for Coatings & Lams
Figure 31 Asia-Pacific to Remain the Largest Market for Integral Systems
Figure 32 Almost Half of the Waterproofing Chemical Market to Be Dominated By Roofing & Walls Application Till 2021
Figure 33 Roofing & Walls to Be Fastest Growing Segment in Asia-Pacific for Waterproofing Chemical Till 2021
Figure 34 China: Largest Market of Waterproofing Chemicals in Roofing & Walls Application Segment in 2015
Figure 35 Asia-Pacific to Be Largest Market of Floor & Basement Application Segment Between 2016 and 2021
Figure 36 China : Largest Market of Waterproofing Chemicals in Floors & Basements Application in 2015
Figure 37 Asia-Pacific to Remain Largest Market of Waterproofing Chemicals in Waste & Water Management Application Till 2021
Figure 38 China: Largest Market of Waterproofing Chemicals in Waste & Water Management Application in 2015
Figure 39 Asia-Pacific to Remain Largest Market for Waterproofing Chemicals in Tunnel Liners Application Till 2021
Figure 40 U.S.: Largest Market of Waterproofing Chemicals in Tunnel Liners Application in 2015
Figure 41 Rapidly Growing Markets are Emerging as Strategic Destinations
Figure 42 Asia-Pacific to Dominate the Waterproofing Chemicals Market
Figure 43 The U.S. Was the Key Market for Top 3 Applications of Waterproofing Chemicals in North America in 2015
Figure 44 U.S. to Remain the Leading Player in the Waterproofing Chemical Market in North America
Figure 45 Share of Top 3 Applications of Waterproofing Chemicals in Western Europe
Figure 46 China: Key Waterproofing Chemicals Market in Asia-Pacific
Figure 47 China to Remain Major Share Holder in the Global Waterproofing Chemical Market
Figure 48 China Was the Major Market for Waterproofing Chemicals in Asia-Pacific
Figure 49 Companies Adopted New Product Launches as the Key Growth Strategy During the Last Four Years
Figure 50 Market Evolution Framework, 2013–2016
Figure 51 New Product Launches: Most Popular Growth Strategy Between 2013 and 2016
Figure 52 BASF SE: Company Snapshot
Figure 53 BASF SE: SWOT Analysis
Figure 54 The DOW Chemical Company: Company Snapshot
Figure 55 The DOW Chemical Company: SWOT Analysis
Figure 56 Mapei S.P.A.: Company Snapshot
Figure 57 Carlisle Companies Inc.: Company Snapshot
Figure 58 Carlisle Companies Inc.: SWOT Analysis
Figure 59 Soprema Group: Company Snapshot
Figure 60 Pidilite Industries: Company Snapshot
Figure 61 Fosroc International Limited: Company Snapshot
Figure 62 Johns Manville Corporation: Company Snapshot
Figure 63 Drizoro S.A.U.: Company Snapshot
Figure 64 Conpro Chemicals Private Limited.: Company Snapshot
Figure 65 SIKA AG: Company Snapshot


Growth opportunities and latent adjacency in Waterproofing Chemical Market