Wireless Sensor Networks Market by Offering (Hardware, Software, Services), Sensor Type, Connectivity Type, End-user Industry (Building Automation, Wearable Devices, Healthcare, Automotive & Transportation, Industrial), and Region - Global Forecast to 2023


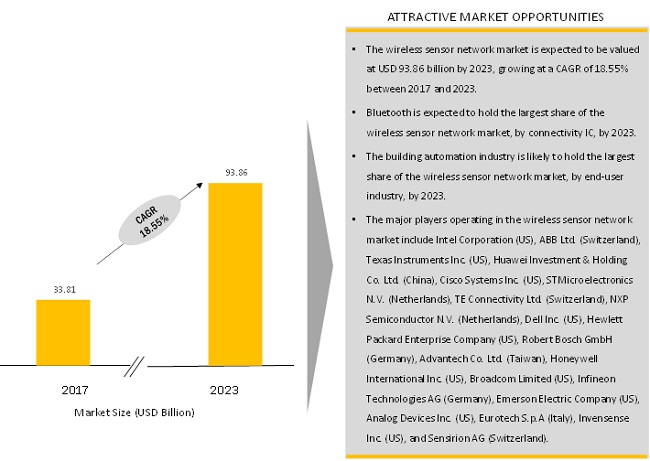
The wireless sensor networks market was valued at USD 29.06 billion in 2016 and is expected to reach USD 93.86 billion by 2023, at a CAGR of 18.55% during the forecast period. Wireless sensor networks are expected to transform the way communication takes place in the physical world. Organizations need real-time visibility and intelligence for their organizational and operational data to reach this new level of efficiency, accuracy, and cost-savings.
Software to grow at highest CAGR during the forecast period
The software components of WSNs include platforms and solutions that are vital for applications such as data collection or remote monitoring. Software solutions are designed to meet the interoperability challenges that arise due to varied heterogeneous devices, and to manage a large volume of data and their security and privacy. Factors such as increasing number of connected devices and rising need for remote monitoring have led to the growing adoption of software solutions.
Image sensors is expected to grow at highest CAGR during the forecast period
The adoption of image sensors is growing rapidly for building automation, automotive, retail, and other applications. Security and access control systems have become an integral part of the safety and security of the buildings and their occupants and video surveillance is crucial in improving the security level in buildings such as homes, offices and retail leading to higher adoption of image sensors in video surveillance systems.
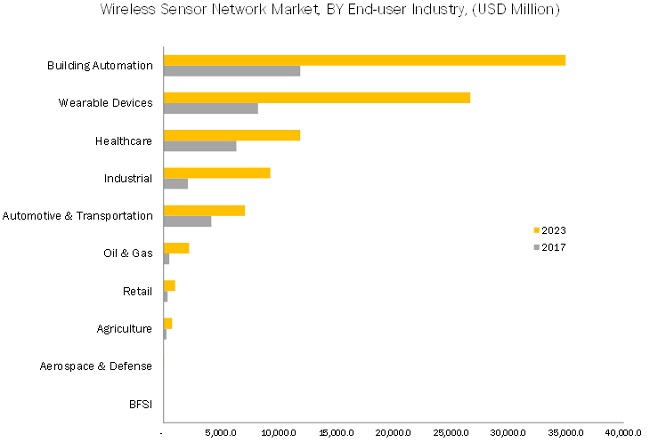
Wireless sensor networks market for Building automation to hold the largest share of the market during forecast period
The need for increased level of security, activity monitoring, and access control has led to the rise in the demand for WSNs. The high adoption of building automation systems to increase energy efficiency to save energy and costs is also contributing to the growth of the WSN market for building automation.
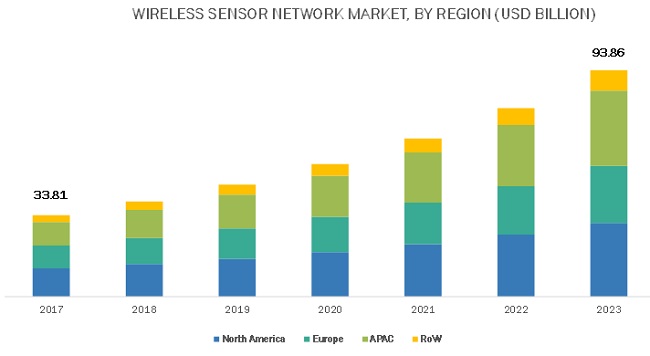
APAC expected to grow at highest CAGR during the forecast period
The market for wireless sensor network in APAC is expected to grow at a higher rate compared with the market in other regions as majority of the global population is concentrated in APAC. Owing to this, the number of new M2M connections per year, the demand for smart consumer devices, and the need for industrial revolution is higher in this region. IoT applications seem to have more opportunities to improve the standard of living and revolutionize the industrial sector in APAC due to the large population in some of the developing economies such as China, India, and Thailand in APAC, along with issues related to healthcare and energy management.
Market Dynamics
Drivers: Increasing demand for remote monitoring
Wireless sensor network (WSN) is revolutionizing industrial monitoring and diagnostics wherein sensor networks have monitoring points with low-power and low-cost WSNs. These networks comprise battery-operated motes that have the ability to quickly form a network, in which sensors communicate with each other wirelessly. Wireless sensor networks can be used for consumer-grade applications such as home automation, PC peripherals, and remote controls.
Restraints: Privacy and security concerns
With the growing connectivity technology, the rate of data intrusions is also increasing rapidly. As devices and connections continue to grow exponentially, data would become more crucial. The network platforms are newly developed and are not robust with security compliances. This acts as a major restraint for the development of the wireless sensor networks market because the security of enterprise data is important while developing analytics solutions for various vertical-specific applications.
Opportunities: Growth in the adoption of WSN across SMBs
Several small-medium businesses (SMBs) as well as large players are keen to employ the benefits of wireless sensor network solutions to increase scalability and efficiency of their business processes. SMBs have witnessed various benefits of WSN such as reduced operation costs, greater agility and scalability, increased revenue, and improved performance. This would lead to the rise in the adoption of WSN across SMBs.
Challenges: Limited power source
The nodes in wireless sensor networks have to manage power from small batteries as they lack fixed infrastructure. As frequent manual replacement of the batteries of thousands of sensors, actuators, and other connected devices within a wireless sensor network is not feasible, the main hurdle is the power management of devices using wireless technologies such as Wi-Fi.
Get online access to the report on the World's First Market Intelligence Cloud
- Easy to Download Historical Data & Forecast Numbers
- Company Analysis Dashboard for high growth potential opportunities
- Research Analyst Access for customization & queries
- Competitor Analysis with Interactive dashboard
- Latest News, Updates & Trend analysis
Request Sample Scope of the Report
:
Get online access to the report on the World's First Market Intelligence Cloud
- Easy to Download Historical Data & Forecast Numbers
- Company Analysis Dashboard for high growth potential opportunities
- Research Analyst Access for customization & queries
- Competitor Analysis with Interactive dashboard
- Latest News, Updates & Trend analysis

|
Report Metric |
Details |
|
Market size available for years |
2015�2023 |
|
Base year |
2016 |
|
Forecast period |
2017�2023 |
|
Units |
Value in USD & volume in million units |
|
Segments covered |
Offering, Sensor type, Connectivity type, End-User industry |
|
Geographic regions covered |
North America, APAC, Europe, and RoW |
|
Companies covered |
Intel Corporation (US), ABB Ltd. (Switzerland), Texas Instruments Inc. (US), Huawei Investment & Holding Co., Ltd. (China), Cisco Systems Inc. (US), STMicroelectronics N.V. (Netherlands), TE Connectivity Ltd. (Switzerland), NXP Semiconductor N.V. (Netherlands), Dell Inc. (US), Hewlett Packard Enterprise Company (US), Robert Bosch GmbH (Germany), Advantech Co., Ltd. (Taiwan), Honeywell International Inc. (US), Broadcom Limited (US), Infineon Technologies AG (Germany), Emerson Electric Company (US), Analog Devices Inc. (US), Eurotech S.p.A (Italy), Invensense Inc. (US), and Sensirion AG (Switzerland), SmartThings Inc. (US), Episensor Ltd. (Ireland), Notion (US), Helium Systems Inc. (US), and Beep Inc. (US). |
This report categorizes wireless sensor network market based on offering, sensor type, connectivity type, end-user industry, and region.
Wireless Sensor Networks Market Segmentation:
Wireless Sensor Networks Market, by Offering:
- Hardware
- Software
- Services
Wireless Sensor Networks Market, by Sensor Type:
- Ambient Light Sensors
- Motion & Position Sensors
- Temperature Sensors
- Heart Rate Sensors
- Pressure Sensors
- IMUs (6-Axis, 9-Axis)
- Accelerometers (3-Axis)
- Blood Glucose Sensors
- Image Sensors
- Humidity Sensors
- Carbon Monoxide Sensors
- Blood Oxygen Sensors
- Flow Sensors
- Level Sensors
- Chemical Sensors
- ECG Sensors
- Others (MRR, Ultrasonic Sensors, Vehicle Detection Sensors, Pedestrain Presence Sensors, Speed Sensors, Soil Moisture Sensors)
Wireless Sensor Networks Market, by Connectivity Type:
- Wi-Fi
- Bluetooth
- Bluetooth/WLAN
- Cellular Network
- GPS/GNSS Module
- Bluetooth Smart/BLE
- ZigBee
- NFC
- WHART
- ISA100
- ANT+
Wireless Sensor Networks Market, by End-User Industry:
- Building Automation
- Wearable Devices
- Healthcare
- Industrial
- Automotive & Transportation
- Oil and Gas
- Retail
- Agriculture
- Aerospace & Defense
- BFSI
Wireless Sensor Networks Market, by Region:
- North America
- Europe
- APAC
- RoW
Key Market Players
The major players in the wireless sensor network market include Intel Corporation (US), ABB Ltd. (Switzerland), Texas Instruments Inc. (US), Huawei Investment & Holding Co., Ltd. (China), Cisco Systems Inc. (US), STMicroelectronics N.V. (Netherlands), TE Connectivity Ltd. (Switzerland), NXP Semiconductor N.V. (Netherlands), Dell Inc. (US), Hewlett Packard Enterprise Company (US), Robert Bosch GmbH (Germany), Advantech Co., Ltd. (Taiwan), Honeywell International Inc. (US), Broadcom Limited (US), Infineon Technologies AG (Germany), Emerson Electric Company (US), Analog Devices Inc. (US), Eurotech S.p.A (Italy), Invensense Inc. (US), and Sensirion AG (Switzerland).
Major Market Developments
- In November 2019, STMicroelectronics announced STM32WB50 Value Line wireless microcontrollers to serve cost-sensitive connected devices that need to support Bluetooth� 5.0, ZigBee� 3.0, or OpenThread.
- In October 2019, NXP Semiconductors N.V. announced a new series of Layerscape Access processors, designed for 5G Access Edge applications which target a variety of deployment scenarios compliant with O-RAN Alliance specifications, including Central Units/Distributed Units (CU/DU), Radio Units (RUs), along with Integrated Small Cells and Customer Premises Equipment (CPE) systems.
- In February 2019, Nordic Semiconductor�s recently launched nRF9160 System-in-Package (SiP) LTE-M/NB-IoT cellular IoT (CIoT) module is among the first products to be awarded PSA Certified Level 1 certification under a new IoT security initiative spearheaded by Arm.
Key Questions Answered
- Which are new application areas which the wireless sensor network providers are exploring?
- Who are the key players in the market and how intense is the competition?
- Where will all these developments in the wireless sensor network market take the industry in the mid to long term?
To speak to our analyst for a discussion on the above findings, click Speak to Analyst
Table of Contents
1 Introduction
1.1 Objectives of the Study
1.2 Market Definition
1.3 Study Scope
1.3.1 Markets Covered
1.3.2 Years Considered for This Study
1.4 Currency
1.5 Limitations
1.6 Stakeholders
2 Research Methodology
2.1 Research Data
2.1.1 Secondary Data
2.1.1.1 Key Data From Secondary Sources
2.1.2 Primary Data
2.1.2.1 Key Data From Primary Sources
2.1.2.2 Key Industry Insights
2.1.2.3 Breakdown of Primaries
2.2 Market Size Estimation
2.2.1 Bottom-Up Approach
2.2.2 Top-Down Approach
2.3 Market Breakdown & Data Triangulation
2.4 Research Assumptions
3 Executive Summary
4 Premium Insights
4.1 Attractive Market Opportunities in the Wireless Sensor Network Market
4.2 Market, By Connectivity Type, 2016 vs 2023 (Million Units)
4.3 Market, By End-User Industry
4.4 Market, By Sensor and By Region
4.5 Market, By Region
5 Market Overview
5.1 Introduction
5.2 Market Dynamics
5.2.1 Drivers
5.2.1.1 Increasing Demand for Remote Monitoring
5.2.1.2 Growing Market for Smart Devices and Wearable Devices
5.2.2 Restraints
5.2.2.1 Privacy and Security Concerns
5.2.2.2 Difficulty in Standardization of Wireless Sensor Network
5.2.3 Opportunities
5.2.3.1 Growth in the Adoption of Wsn Across SMBS
5.2.3.2 Growing Adoption of Smart Technologies and Distributed Applications
5.2.3.3 Predictive Maintenance
5.2.4 Challenges
5.2.4.1 Limited Power Source
5.3 Value Chain Analysis
5.3.1 Core Industry Segments
5.3.1.1 Research and Development
5.3.1.2 Component Manufacturers
5.3.1.3 System Integrators
5.3.1.4 Distribution, Marketing, and Sales
5.3.1.5 End-User Industries
6 Wireless Sensor Network Market, By Offering
6.1 Introduction
6.2 Hardware
6.2.1 Processors
6.2.1.1 Microcontrollers
6.2.1.2 Microprocessors
6.2.1.3 Digital Signal Processors
6.2.1.4 Application Processors
6.2.2 Connectivity ICs
6.2.3 Sensors
6.2.4 Memories
6.2.4.1 On-Chip Memories
6.2.4.2 Off-Chip Memories
6.3 Software
6.3.1 Platforms
6.3.1.1 Device Management
6.3.1.2 Application Management
6.3.1.3 Network Management
6.3.2 Software Solutions
6.3.2.1 Real-Time Streaming Analytics
6.3.2.2 Security Solutions
6.3.2.3 Data Management
6.3.2.4 Remote Monitoring Systems
6.3.2.5 Network Bandwidth Management
6.4 Services
6.4.1 Deployment & Integration
6.4.2 Support & Maintenance
7 Wireless Sensor Network Market, By Sensor Type
7.1 Introduction
7.2 Ambient Light Sensors
7.3 Motion and Position Sensors
7.4 Temperature Sensors
7.5 Heart Rate Sensors
7.6 Pressure Sensors
7.7 Inertial Measurement Units (IMU)
7.8 Accelerometers
7.9 Blood Glucose Sensors
7.10 Image Sensors
7.11 Humidity Sensors
7.12 Carbon Monoxide Sensors
7.13 Blood Oxygen Sensors
7.14 Flow Sensors
7.15 Level Sensors
7.16 Chemical Sensors
7.17 Electrocardiogram (ECG) Sensors
7.18 Others
8 WSN Market, By Connectivity Type
8.1 Introduction
8.2 ANT+
8.3 Bluetooth
8.4 Bluetooth Smart/Bluetooth Low Energy (BLE)
8.5 Zigbee
8.6 Wireless Fidelity (Wi-Fi)
8.7 Near-Field Communication (NFC)
8.8 Cellular Network
8.9 Wireless Highway Addressable Remote Transducer (Whart)
8.10 Global Navigation Satellite System (GNSS) Module
8.11 ISA100
8.12 Bluetooth/ WLAN
9 WSN Market, By End-User Industry
9.1 Introduction
9.2 Building Automation
9.2.1 Lighting Control Systems
9.2.2 Hvac Control Systems
9.2.3 Security & Access Systems
9.2.4 Fire Protection Systems
9.2.5 Smart Meters
9.3 Wearable Devices
9.3.1 Activity Monitors
9.3.2 Smartwatches
9.3.3 Smart Glasses
9.3.4 Body Worn Cameras
9.4 Healthcare
9.4.1 Portable Medical Devices
9.4.2 Diagnostic & Therapy Device
9.4.3 Wearable Devices
9.5 Automotive & Transportation
9.6 Industrial
9.7 Oil & Gas
9.8 Retail
9.9 Agriculture
9.10 Aerospace & Defense
9.11 Banking, Financial Services, and Insurance (BFSI)
10 Geographic Analysis
10.1 Introduction
10.2 North America
10.2.1 US
10.2.2 Canada
10.2.3 Mexico
10.3 Europe
10.3.1 Germany
10.3.2 UK
10.3.3 France
10.3.4 Rest of Europe
10.4 APAC
10.4.1 China
10.4.2 Japan
10.4.3 South Korea
10.4.4 India
10.4.5 Rest of APAC
10.5 RoW
10.5.1 Middle East & Africa
10.5.2 South America
11 Competitive Landscape
11.1 Overview
11.2 Key Players in the Wireless Sensor Network Market
11.3 WSN Market (Global) Competitive Leadership Mapping, 2016
11.3.1 Visionary Leaders
11.3.2 Dynamic Differentiators
11.3.3 Innovators
11.3.4 Emerging Companies
11.4 Business Strategies Adopted By Major Players in the Market (For All 25 Companies)
11.5 Product Offerings By Major Players in the Wireless Sensor Networks Market (For All 25 Companies)
12 Company Profiles
12.1 Introduction
12.2 Intel Corporation
12.2.1 Business Overview
12.2.2 Products and Solutions
12.2.3 Recent Developments
12.3 Huawei Investment & Holding Co., LTD.
12.3.1 Business Overview
12.3.2 Products and Solutions
12.3.3 Recent Developments
12.4 Dell Incorporation
12.4.1 Business Overview
12.4.2 Products and Solutions
12.4.3 Recent Developments
12.5 Texas Instruments Inc.
12.5.1 Business Overview
12.5.2 Products and Solutions
12.5.3 Recent Developments
12.6 Cisco Systems Inc.
12.6.1 Business Overview
12.6.2 Products and Solutions
12.6.3 Recent Developments
12.7 Hewlett Packard Enterprise Co.
12.7.1 Business Overview
12.7.2 Products and Solutions
12.7.3 Recent Developments
12.8 NXP Semiconductors N.V.
12.8.1 Business Overview
12.8.2 Products and Solutions
12.8.3 Recent Developments
12.9 Stmicroelectronics N.V.
12.9.1 Business Overview
12.9.2 Products and Solutions
12.9.3 Recent Developments
12.10 Te Connectivity LTD.
12.10.1 Business Overview
12.10.2 Products and Solutions
12.10.3 Recent Developments
12.11 Advantech Co., LTD.
12.11.1 Business Overview
12.11.2 Products and Solutions
12.11.3 Recent Developments
12.12 ABB LTD.
12.12.1 Business Overview
12.12.2 Products and Solutions
12.12.3 Recent Developments
12.13 Honeywell International Inc.
12.13.1 Business Overview
12.13.2 Products and Solutions
12.13.3 Recent Developments
12.14 Broadcom Limited
12.14.1 Business Overview
12.14.2 Products and Solutions
12.14.3 Recent Developments
12.15 Srobert Bosch GmbH
12.15.1 Business Overview
12.15.2 Products and Solutions
12.15.3 Recent Developments
12.16 Eurotech S.P.A
12.16.1 Business Overview
12.16.2 Products and Solutions
12.16.3 Recent Developments
12.17 Invensense, Inc.
12.17.1 Business Overview
12.17.2 Products and Solutions
12.17.3 Recent Developments
12.18 Infineon Technologies AG
12.18.1 Business Overview
12.18.2 Products and Solutions
12.18.3 Recent Developments
12.19 Analog Devices, Inc.
12.19.1 Business Overview
12.19.2 Products and Solutions
12.19.3 Recent Developments
12.20 Emerson Electric Company
12.20.1 Business Overview
12.20.2 Products and Solutions
12.20.3 Recent Developments
12.21 Sensirion AG
12.21.1 Business Overview
12.21.2 Products and Solutions
12.21.3 Recent Developments
12.22 Nordic Semiconductor
12.22.1 Business Overview
12.22.2 Products and Solutions
12.22.3 Recent Developments
12.23 Sanechips Technology (Zte Microelectronics)
12.23.1 Business Overview
12.23.2 Products and Solutions
12.23.3 Recent Developments
12.24 Mediatek
12.24.1 Business Overview
12. 24.2 Products and Solutions
12. 24.3 Recent Developments
12.25 Commsolid
12.25.1 Business Overview
12. 25.2 Products and Solutions
12. 25.3 Recent Developments
12.26 Riot Micro
12.26.1 Business Overview
12. 26.2 Products and Solutions
12. 26.3 Recent Developments
12.27 U-Blox
12.27.1 Business Overview
12. 27.2 Products and Solutions
12. 27.3 Recent Developments
12.28 Memsic Inc.
12. 28.1 Business Overview
12. 28.2 Products and Solutions
12. 28.3 Recent Developments
12.29 Sensys Networks
12.29.1 Business Overview
12. 29.2 Products and Solutions
12. 29.3 Recent Developments
12.30 Libelium
12.30.1 Business Overview
12.30.2 Products and Solutions
12.30.3 Recent Developments
12.31 Samsara Networks Inc.
12.31.1 Business Overview
12.31.2 Products and Solutions
12.31.3 Recent Developments
12.32 Start-Up Ecosystem
12.22.1 Episensor LTD.
12.22.2 Notion
12.22.3 Helium Systems Inc.
12.22.4 Beep Inc.
12.22.5 Smartthings, Inc.
12.22.6 Iotium
12.22.7 Element Analytics
12.22.8 Smartthings, Inc.
12.22.9 Opensignal
12.22.10 Actility
*Details on Business Overview, Products Offered & Services Strategies, Key Insights, Recent Developments, MnM View Might Not Be Captured in Case of Unlisted Companies.
13 Appendix
13.1 Insights From Industry Experts
13.2 Discussion Guide
13.3 Knowledge Store: Marketsandmarkets� Subscription Portal
13.4 Introducing RT: Real-Time Market Intelligence
13.5 Available Customization
13.6 Related Reports
13.7 Author Details
List of Tables (107 Tables)
Table 1 Wireless Sensor Networks Market, By Offering, 2015�2023 (USD Million)
Table 2 Market, By Hardware, 2015�2023 (USD Million)
Table 3 Market, By Hardware, 2015�2023 (Million Units)
Table 4 Market for Processors, By Type, 2015�2023 (USD Million)
Table 5 Market for Processors, By Type, 2015�2023 (Million Units)
Table 6 Market for Processors, By End-User Industry, 2015�2023 (Thousand Units)
Table 7 Market for Memories, By Type, 2015�2023 (USD Million)
Table 8 Market for Memories, By Type, 2015�2023 (Million Units)
Table 9 Market for Memories, By End-User Industry, 2015�2023 (Thousand Units)
Table 10 Market for Software, By Type, 2015�2023 (USD Million)
Table 11 Market for Platforms, By Type, 2015�2023 (USD Million)
Table 12 Market for Software Solutions, By Type, 2015�2023 (USD Million)
Table 13 Market for Services, By Type, 2015�2023 (USD Million)
Table 14 Market, By Sensor Type, 2015�2023 (Million Units)
Table 15 Market, By Sensor Type, 2015�2023 (USD Million)
Table 16 Market for Sensor Type, By End-User Industry, 2015�2023 (Thousand Units)
Table 17 Market for Sensor Type, By End-User Industry, 2015�2023 (USD Thousand)
Table 18 Market, By Connectivity Type, 2015�2023 (Million Units)
Table 19 Market, By Connectivity IC, 2015�2023 (USD Million)
Table 20 Market for Connectivity Type, By End-User Industry, 2015�2023 (Thousand Units)
Table 21 Market for Connectivity Type, By End-User Industry, 2015�2023 (USD Thousand)
Table 22 Market, By End-User Industry, 2015�2023 (USD Million)
Table 23 Market for Gateways, By End-User Industry, 2015�2023 (Thousand Units)
Table 24 Market for Building Automation Industry, By Hardware, 2015�2023 (Million Units)
Table 25 Market for Building Automation, By Connectivity Type, 2015�2023 (Million Units)
Table 26 Market for Building Automation, By Sensor Type, 2015�2023 (Million Units)
Table 27 Market for Hardware for Building Automation, By Region, 2015�2023 (USD Million)
Table 28 Wireless Sensor Networks Market for Hardware for Building Automation in North America, By Country, 2015�2023 (USD Million)
Table 29 Market for Hardware for Building Automation in Europe, By Country, 2015�2023 (USD Million)
Table 30 Market for Hardware for Building Automation in APAC, By Country, 2015�2023 (USD Million)
Table 31 Market for Hardware for Building Automation in RoW, By Region, 2015�2023 (USD Million)
Table 32 Market for Wearable Devices, By Hardware, 2015�2023 (Million Units)
Table 33 Market for Wearable Devices, By Sensor Type, 2015�2023 (Million Units)
Table 34 Market for Wearables Devices, By Connectivity Type, 2015�2023 (Million Units)
Table 35 Market for Hardware for Wearable Devices, By Region, 2015�2023 (USD Million)
Table 36 Market for Hardware for Wearable Devices in North America, By Country, 2015�2023 (USD Million)
Table 37 Market for Hardware for Wearable Devices in Europe, By Country, 2015�2023 (USD Million)
Table 38 Market for Hardware for Wearable Devices in APAC, By Country, 2015�2023 (USD Million)
Table 39 Market for Hardware for Wearable Devices in RoW, By Region, 2015�2023 (USD Million)
Table 40 Market for Healthcare, By Hardware, 2015�2023 (Million Units)
Table 41 Market for Healthcare, By Connectivity Type, 2015�2023 (Thousand Units)
Table 42 Market for Healthcare, By Sensor Type, 2015�2023 (Million Units)
Table 43 Market for Hardware for Healthcare, By Region, 2015�2023 (USD Million)
Table 44 Market for Hardware for Healthcare in North America, By Country, 2015�2023 (USD Million)
Table 45 Market for Hardware for Healthcare in Europe, By Country, 2015�2023 (USD Million)
Table 46 Market for Hardware for Healthcare in APAC, By Country, 2015�2023 (USD Million)
Table 47 Market for Hardware for Healthcare in RoW, By Region, 2015�2023 (USD Million)
Table 48 Market for Automotive & Transportation, By Hardware, 2015�2023 (Million Units)
Table 49 Market for Automotive & Transportation, By Connectivity Type, 2015�2023 (Million Units)
Table 50 Market for Automotive & Transportation, By Sensor Type, 2015�2023 (Million Units)
Table 51 Market for Hardware for Automotive & Transportation, By Region, 2015�2023 (USD Million)
Table 52 Market for Hardware for Automotive & Transportation in North America, By Country, 2015�2023 (USD Million)
Table 53 Market for Hardware for Automotive & Transportation in Europe, By Country, 2015�2023 (USD Million)
Table 54 Market for Hardware for Automotive & Transportation in APAC, By Country, 2015�2023 (USD Million)
Table 55 Market for Hardware for Automotive & Transportation in RoW, By Region, 2015�2023 (USD Million)
Table 56 Market for Industrial, By Hardware, 2015�2023 (Million Units)
Table 57 Market for Industrial, By Connectivity Type, 2015�2023 (Million Units)
Table 58 Market for Industrial, By Sensor Type, 2015�2023 (Million Units)
Table 59 Market for Hardware for Industrial, By Region, 2015�2023 (USD Million)
Table 60 Market for Hardware for Industrial in North America, By Country, 2015�2023 (USD Million)
Table 61 Market for Hardware for Industrial in Europe, By Country, 2015�2023 (USD Million)
Table 62 Market for Hardware for Industrial in APAC, By Country, 2015�2023 (USD Million)
Table 63 Market for Hardware for Industrial in RoW, By Region, 2015�2023 (USD Million)
Table 64 Market for Oil & Gas, By Hardware, 2015�2023 (Million Units)
Table 65 Market for Oil & Gas, By Connectivity Type, 2015�2023 (Million Units)
Table 66 Market for Oil & Gas, By Sensor Type, 2015�2023 (Thousand Units)
Table 67 Market for Hardware for Oil & Gas, By Region, 2015�2023 (USD Million)
Table 68 Market for Hardware for Oil & Gas in North America, By Country, 2015�2023 (USD Million)
Table 69 Market for Hardware for Oil & Gas in Europe, By Country, 2015�2023 (USD Million)
Table 70 Market for Hardware for Oil & Gas in APAC, By Country, 2015�2023 (USD Million)
Table 71 Market for Hardware for Oil & Gas in RoW, By Region, 2015�2023 (USD Million)
Table 72 Market for Retail, By Hardware, 2015�2023 (Million Units)
Table 73 Market for Retail, By Sensor Type, 2015�2023 (Thousand Units)
Table 74 Market for Hardware for Retail, By Region, 2015�2023 (USD Million)
Table 75 Market for Hardware for Retail in North America, By Country, 2015�2023 (USD Million)
Table 76 Wireless Sensor Networks Market for Hardware for Retail in Europe, By Country, 2015�2023 (USD Million)
Table 77 Market for Hardware for Retail in APAC, By Country, 2015�2023 (USD Million)
Table 78 Market for Hardware for Retail in RoW, By Region, 2015�2023 (USD Million)
Table 79 Market for Agriculture, By Hardware, 2015�2023 (Million Units)
Table 80 Market for Agriculture, By Connectivity Type, 2015�2023 (Million Units)
Table 81 Market for Agriculture, By Sensor Type, 2015�2023 (Thousand Units)
Table 82 Market for Hardware for Agriculture, By Region, 2015�2023 (USD Million)
Table 83 Market for Hardware for Agriculture in North America, By Country, 2015�2023 (USD Million)
Table 84 Market for Hardware for Agriculture in Europe, By Country, 2015�2023 (USD Million)
Table 85 Market for Hardware for Agriculture in APAC, By Country, 2015�2023 (USD Million)
Table 86 Market for Hardware for Agriculture in RoW, By Region, 2015�2023 (USD Million)
Table 87 Market for Aerospace & Defense, By Hardware, 2015�2023 (Thousand Units)
Table 88 Market for Aerospace & Defense, By Connectivity Type, 2015�2023 (Thousand Units)
Table 89 Market for Aerospace & Defense, By Sensor Type, 2015�2023 (Thousand Units)
Table 90 Market for Hardware for Aerospace & Defense, By Region, 2015�2023 (USD Thousand)
Table 91 Market for Hardware for Aerospace & Defense in North America, By Country, 2015�2023 (USD Thousand)
Table 92 Market for Hardware for Aerospace & Defense in Europe, By Country, 2015�2023 (USD Thousand)
Table 93 Market for Hardware for Aerospace & Defense in APAC, By Country, 2015�2023 (USD Thousand)
Table 94 Market for Hardware for Aerospace & Defense in RoW, By Region, 2015�2023 (USD Thousand)
Table 95 Market for BFSI, By Hardware, 2015�2023 (Thousand Units)
Table 96 Market for Hardware for BFSI, By Region, 2015�2023 (USD Thousand)
Table 97 Market for Hardware for BFSI in North America, By Country, 2015�2023 (USD Thousand)
Table 98 Market for Hardware for BFSI in Europe, By Country, 2015�2023 (USD Thousand)
Table 99 Market for Hardware for BFSI in APAC, By Country, 2015�2023 (USD Thousand)
Table 100 Market for Hardware for BFSI in RoW, By Region, 2015�2023 (USD Thousand)
Table 101 Market, By Region, 2015�2023 (USD Million)
Table 102 Market in North America, By Country, 2015�2023 (USD Million)
Table 103 Market in Europe, By Country/Region, 2015�2023 (USD Million)
Table 104 Market in APAC, By Country/Region, 2015�2023 (USD Million)
Table 105 Market in RoW, By Region, 2015�2023 (USD Million)
Table 106 Texas Instruments Inc. Led the Wireless Sensor Network Market for Nodes in 2016
Table 107 Intel Corporation Led the Market for Gateways in 2016
List of Figures (66 Figures)
Figure 1 Wireless Sensor Networks Market: Research Design
Figure 2 Process Flow of Market Size Estimation
Figure 3 Market Size Estimation Methodology: Bottom-Up Approach
Figure 4 Market Size Estimation Methodology: Top-Down Approach
Figure 5 Market Breakdown and Data Triangulation
Figure 6 Market, By Offering, 2016 � 2023
Figure 7 Market, By Sensors, 2016 vs 2023
Figure 8 Top 5 End-User Industry in Market 2016 vs 2023
Figure 9 Market, By Region, 2016
Figure 10 Market Expected to Grow at A Steady Rate Between 2017 and 2023
Figure 11 Bluetooth Connectivity IC Holds the Largest Market in 2016
Figure 12 Building Automation Expected to Hold Largest Share During the Forecast Period
Figure 13 Blood Glucose Sensor Held the Largest Share of the Market in 2016
Figure 14 US Held the Largest Share of the Market in 2016
Figure 15 Increasing Demand for Remote Monitoring and Advancements in Wireless Connectivity Technologies to Propel the Growth of the Market
Figure 16 Global Wearable Technology Market, in Terms of Volume, 2014�2022 (Million Units)
Figure 17 Value Chain Analysis: Wireless Sensor Network Market
Figure 18 Market, By Offering
Figure 19 Software to Hold the Largest Size of the Market in 2017
Figure 20 Sensors to Hold the Largest Size of the Market, in Terms of Volume, During the Forecast Period
Figure 21 Building Automation to Hold the Largest Size of the Market for Processors During the Forecast Period
Figure 22 Solutions to Dominate the Market for Software Between 2017 and 2023
Figure 23 Data Management to Hold the Largest Size of the Market for Software Solutions in 2017
Figure 24 Market for Deployment & Integration Services to Grow at Faster Rate Between 2017 and 2023
Figure 25 Wireless Sensor Network, By Sensor Type
Figure 26 Ambient Light Sensors to Hold the Largest Size of the Market By 2023
Figure 27 Building Automation Industry to Hold the Largest Size of the Market, in Terms of Volume, By 2023
Figure 28 Wireless Sensor Network, By Connectivity Type
Figure 29 Bluetooth to Hold the Largest Size of the Market in 2017
Figure 30 Building Automation Industry to Hold the Largest Size of the Market for Connectivity Type By 2023
Figure 31 Market, By End-User Industry
Figure 32 Building Automation to Hold the Largest Share of the Market By 2023
Figure 33 Wi-Fi to Hold the Largest Share of the Market for Building Automation, in Terms of Volume, in 2017
Figure 34 Market for Memories for Wearable Devices to Grow at the Highest CAGR During the Forecast Period
Figure 35 Market for Connectivity ICs for Healthcare Industry to Grow at the Highest Rate During the Forecast Period
Figure 36 Market for Sensors for Automotive & Transportation to Grow at the Highest Rate During the Forecast Period
Figure 37 Temperature Sensors to Hold the Largest Size, in Terms of Volume, of the Market for Sensors for Industrial Sector By 2023
Figure 38 North America to Be the Largest Market for Wireless Sensor Network for Oil & Gas By 2023
Figure 39 Motion & Position Sensors to Hold the Largest Size, in Terms of Volume, of the Market for Sensors for Retail By 2023
Figure 40 Soil Moisture Sensors to Hold the Largest Size, in Terms of Volume, of the Market for Sensors for Agriculture in 2017
Figure 41 IMU to Hold the Largest Size, in Terms of Volume, of the Market for Sensors Aerospace & Defense By 2023
Figure 42 Market, By Region
Figure 43 Market in China to Grow at the Highest CAGR Between 2017 and 2023
Figure 44 US Held the Largest Share of the Market in North America in 2016
Figure 45 Germany Held the Largest Share of the Market in Europe in 2016
Figure 46 Market in China Expected to Grow at A High CAGR Between 2017 and 2023
Figure 47 Companies Adopted Partnerships, Agreements, Expansions, & Collaborations as Key Growth Strategies Between 2014 and 2017
Figure 48 Geographic Revenue Mix of Major Companies
Figure 49 Intel Corporation: Company Snapshot
Figure 50 Huawei Investment & Holding Co., LTD.: Company Snapshot
Figure 51 Texas Instruments Inc.: Company Snapshot
Figure 52 Cisco Systems, Inc.: Company Snapshot
Figure 53 Hewlett Packard Enterprise Co.: Company Snapshot
Figure 54 NXP Semiconductors N.V.: Company Snapshot
Figure 55 Stmicroelectronics N.V.: Company Snapshot
Figure 56 TE Connectivity LTD.: Company Snapshot
Figure 57 Advantech Co., LTD.: Company Snapshot
Figure 58 ABB LTD.: Company Snapshot
Figure 59 Honeywell International Inc.: Company Snapshot
Figure 60 Broadcom Limited: Company Snapshot
Figure 61 Robert Bosch GmbH: Company Snapshot
Figure 62 Eurotech S.P.A: Company Snapshot
Figure 63 Invensense, Inc.: Company Snapshot
Figure 64 Infineon Technologies AG: Company Snapshot
Figure 65 Analog Devices, Inc.: Company Snapshot
Figure 66 Emerson Electric Company: Company Snapshot


Growth opportunities and latent adjacency in Wireless Sensor Networks Market