X-Band Radar Market by Application (Defense, Government, and Commercial), Type (Mobile, and Sea-based X-band Radar), Array (Active Electronically Scanned Array (AESA), Passive Electronically Scanned Array (PESA), and Region - Global Forecast to 2021


The X-band radar market is projected to grow from USD 4.58 Billion in 2016 to USD 5.61 Billion by 2021, at a CAGR of 4.1% during the period. This report covers the forecast of the market and its dynamics over the next five years, while also recognizing market application gaps, recent developments in the market, and high potential countries. The X-band radar market has been analyzed primarily on the basis of application (including defense, government, and commercial) through the period from 2016 to 2021, considering 2015 as the base year.
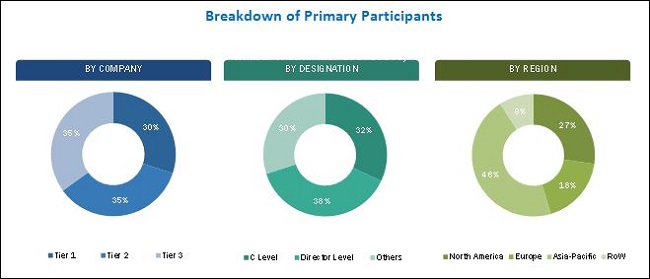
The research methodology that has been used to estimate and forecast the market begins with capturing data about the key X-band radar through secondary sources such as the U.S. Department of Defense (DoD), Defence Research & Development Organisation (DRDO) (India), the U.S. Air Force website, company websites, corporate filings such as annual reports, investor presentations, and paid databases. Different types of X-band radars offered have also been taken into consideration to determine the market segmentation. The bottom-up procedure has been employed to arrive at the overall size of the market from the revenue of the key players in the market. After arriving at the overall market size, the total market has been split into several segments and subsegments, which have then been verified through primary research by conducting extensive interviews with key experts such as chief executive officers, vice presidents, directors, and executives of leading companies in the market. These data triangulation and market breakdown procedures have been employed to complete the overall market engineering process and arrive at the exact statistics for all the segments and subsegments of the market. The breakdown of the profiles of primaries has been depicted in the figure given below:
To know about the assumptions considered for the study, download the pdf brochure
The ecosystem of the X-band radar market comprises manufacturers, distributors, and end users. The key end users of the market are the defense sector, government, and commercial sector. The designers and manufacturers of X-band radar are Japan Radio Company Limited (Japan), Terma A/s (Denmark), Northrop Grumman Corporation (U.S.), Raytheon Company (U.S.), Saab AB (Sweden), Furuno Electric Co. Ltd. (Japan), Israel Aerospace Industries (Israel), ThalesRaytheonSystems (France), Selex ES S.p.A (Italy), Kelvin Hughes Limited (U.K.), Reutech Radar Systems (South Africa), etc.
�Study answers several questions for stakeholders, primarily, which segments to focus on over the next five years for prioritizing efforts and investments.�
Target Audience
- Original Equipment Manufacturers (OEMs)
- Regulatory Bodies
- Component Suppliers
- Military
- Technology Providers
- Distributors
Get online access to the report on the World's First Market Intelligence Cloud
Request Sample Scope of the Report

This research report categorizes the global market into the following segments and subsegments:
- X-band Radar Market, By Application
- Defense Application � Land-based, Airborne, and Naval
- Government Application - Border Security, Homeland Security
- Commercial Application - Perimeter Security, Facility Surveillance, Airspace Surveillance, Weather Detection
- X-band radar Market, By Type
- Mobile X-band Radar
- Sea-Based X-band Radar
- X-band Radar Market, By Array
- Active Electronically Scanned Array (AESA)
- Passive Electronically Scanned Array (PESA)
- X-band Radar Market, By Region
- North America
- Europe
- Asia-Pacific
- Middle East
- Rest of the World
Customizations available for the report
With the given market data, MarketsandMarkets offers customizations as per specific needs of a company. The following customization options are available for the report:
- Country-level Analysis
- Comprehensive market projections for countries categorized under Rest of Europe, Rest of Asia-Pacific, Rest of Middle East, and Rest of the World
- Company Information
- Detailed analysis and profiling of additional market players (Up to 5)
The global X-band radar market is projected to grow from USD 4.58 Billion in 2016 to USD 5.61 Billion by 2021, at a CAGR of 4.1% during the forecast period. Factors such as increasing crime in the form of territorial conflicts, emergence of electronic and network centric warfare, replacement of legacy systems resulting in the automaton of radar systems, and increasing use of the X-band radar in defense are expected to drive the growth of the global market during the forecast period, 2016 to 2021.
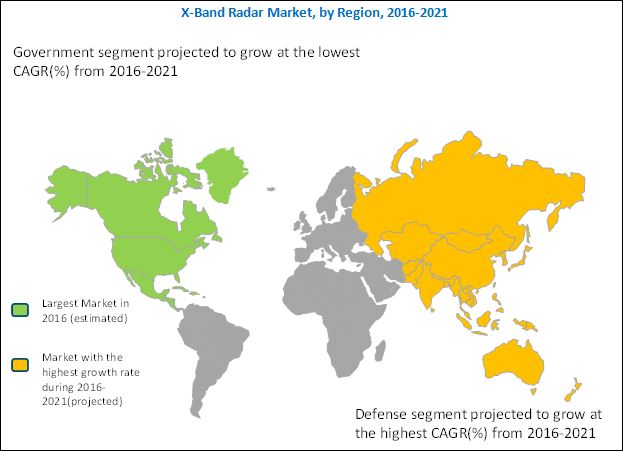
On the basis of application, the global X-band radar market has been segmented into defense, government and commercial. The defense segment is projected to grow at the highest CAGR during the forecast period. The increasing demand for the X-band radar can be attributed to several factors such as the deployment of the X-band radar in naval as well as in civil, military, and government institutions for weather monitoring, air traffic control, maritime vessel traffic control, defense tracking, and speed detection of vehicles for law enforcement and so on.
Procurement of the X-band radar by the defense sectors of countries has increased considerably over the past few years, mainly driven by the increasing number of wars against terrorist outfits, globally, especially in the Middle East and Asia-Pacific regions. There is also an increasing demand for the technologically advanced X-band radars, such as the Polarimetric radar, Long Range Discrimination Radar (LRDR), electronically scanned array radar, and solid state transmitters.
The global X-band radar market by type is dominated by the mobile X-band radar segment, which is used for a wide range of applications, such as, to study the dynamics of extraordinary cyclones and cloud microphysics, urban rainfall, and sea breezes, among others. The mobile X-band radar segment is expected to grow at the highest rate in the near future. The demand for mobile X-band radars has been increasing across the globe, owing to increased usage in air traffic control, early weather warning, perimeter surveillance, and airborne surveillance. The demand for portable or mobile X-band radars in the North American region is growing at a rapid pace. This is due to the development of various new programs by the U.S. to devise an enormous defense system. The Raytheon Company (U.S.) has also developed the sea-based X-band radar for the naval surveillance application.
The Asia-Pacific region is expected to exhibit the highest growth in the X-band radar market during the forecast period. The key drivers of the market in the Asia-Pacific region include the need to counter the rising terrorist activities and the various military equipment modernization programs, which propel the major defense manufacturers of the region to develop better techno-efficient X-band radars.
Huge costs incurred in system development could inhibit the growth of the global X-band radar market in the near future. As radar systems are used for highly sophisticated defense systems, any incident of system failure is unacceptable. The radar system�s performance has to be highly accurate and reliable, and this is ensured by developing attributes such as durability, a wider detection range, and energy efficiency among others.
The key players operating in the global market are Japan Radio Company Ltd. (Japan), Terma A/S (Denmark), Northrop Grumman Corporation (U.S.), The Raytheon Company (U.S.), and Saab AB (Sweden), among others. New product launches and contracts are the major growth strategies adopted by the top market players to strengthen their positions in the global X-band radar market, while also enhancing their product offerings.
To speak to our analyst for a discussion on the above findings, click Speak to Analyst
Table of Contents
1 Introduction (Page No. - 15)
1.1 Objectives of the Study
1.2 Markets Definition
1.3 Study Scope
1.3.1 Markets Covered
1.3.2 Geographic Scope
1.3.3 Years Considered for the Study
1.4 Currency & Pricing
1.5 Distribution Channel Participants
1.6 Limitations
1.7 Stakeholders
2 Research Methodology (Page No. - 19)
2.1 Research Data
2.1.1 Secondary Data
2.1.1.1 Key Data From Secondary Sources
2.1.2 Primary Data
2.1.2.1 Key Data From Primary Sources
2.1.2.2 Breakdown of Primaries
2.1.3 Key Industry Insights
2.2 Factor Analysis
2.2.1 Introduction
2.2.2 Demand-Side Indicators
2.2.2.1 Increase in Seaborne Trade
2.2.2.2 Air-Space Violation Incidents Driving High Range X-Band Radar Market
2.2.2.3 Border Surveillance
2.2.3 Supply-Side Analysis
2.2.3.1 Increased R&D Activities
2.2.3.2 Technological Advancements
2.3 Market Size Estimation
2.3.1 Bottom-Up Approach
2.3.2 Top-Down Approach
2.4 Market Breakdown & Data Triangulation
2.5 Research Assumptions
3 Executive Summary (Page No. - 32)
4 Premium Insights (Page No. - 36)
4.1 Attractive Opportunities in the X-Band Radar Market, 2016-2021
4.2 X-Band Radar Market, By Technology
4.3 Asia-Pacific X-Band Radar Market
4.4 X-Band Radar Market, By Region
5 Market Overview (Page No. - 39)
5.1 Introduction
5.2 Market Segmentation
5.2.1 By Application
5.2.2 By Type
5.2.3 By Array
5.2.4 By Region
5.3 Market Dynamics
5.3.1 Drivers
5.3.1.1 Emergence of Electronic and Network Centric Warfare
5.3.1.2 Replacement of Legacy Systems Resulting in Automaton of Radar
5.3.1.3 Territorial Conflicts and Geopolitical Instabilities in the Middle East and Asia-Pacific
5.3.1.4 Increased Use of Sea-Based X-Band Radar
5.3.2 Restraint
5.3.2.1 High Development Cost
5.3.3 Opportunities
5.3.3.1 Increased Development of Dual-Band Radars
5.3.3.2 Miniaturization and Automation of Radars for Uavs and Unmanned Combat Vehicles
5.3.3.3 Growing Deployment of Ballistic Missiles, and Air and Missile Defense Systems
5.3.3.4 Increased Application of Space-Based Radars
5.3.4 Challenges
5.3.4.1 Stringent Government Regulations for Obtaining Certification for Defense as Well as Commercial Applications
5.3.4.2 Electromagnetic Jamming of Radars and Noise Interruption During Satellite Communication
6 Industry Trends (Page No. - 50)
6.1 Introduction
6.2 Mapping of X-Band Radar Products
6.3 Industry Insights
6.4 Technological Trends
6.4.1 Solid State Transmitters
6.4.2 Advanced Materials
6.4.3 Synthetic Aperture X-Band Radar
6.4.4 Compact and Lightweight Radars
6.4.5 Electronically Scanned Array Radars
6.4.6 Long Range Discrimination Radar (LRDR)
6.4.7 Polarimetric Radars
6.5 Patent Listing
6.6 Key Trend Analysis in X-Band Radar Market
7 X-Band Radar Market, By Application (Page No. - 58)
7.1 Introduction
7.2 Defense
7.3 Government
7.4 Commercial
8 X-Band Radar Market, By Type (Page No. - 64)
8.1 Introduction
8.2 Mobile X-Band Radar
8.3 Sea-Based X-Band Radar (SBX)
9 X-Band Radar Market, By Array (Page No. - 69)
9.1 Introduction
9.2 Active Electronically Scanned Array (AESA)
9.3 Passive Electronically Scanned Array (PESA)
10 X-Band Radar Market, By Region (Page No. - 73)
10.1 Introduction
10.2 North America
10.2.1 By Application
10.2.1.1 By Defense Application
10.2.1.2 By Government Application
10.2.1.3 By Commercial Application
10.2.2 By Type
10.2.3 By Array
10.2.4 By Country
10.2.4.1 U.S.
10.2.4.1.1 By Application
10.2.4.1.2 By Type
10.2.4.1.3 By Array
10.2.4.2 Canada
10.2.4.2.1 By Application
10.2.4.2.2 By Type
10.2.4.2.3 By Array
10.3 Europe
10.3.1 By Application
10.3.1.1 By Defense Application
10.3.1.2 By Government Application
10.3.1.3 By Commercial Application
10.3.2 By Type
10.3.3 By Array
10.3.4 By Country
10.3.4.1 Russia
10.3.4.1.1 By Application
10.3.4.1.2 By Type
10.3.4.1.3 By Array
10.3.4.2 France
10.3.4.2.1 By Application
10.3.4.2.2 By Type
10.3.4.2.3 By Array
10.3.4.3 U.K.
10.3.4.3.1 By Application
10.3.4.3.2 By Type
10.3.4.3.3 By Array
10.4 Asia-Pacific
10.4.1 By Application
10.4.1.1 By Defense Application
10.4.1.2 By Government Application
10.4.1.3 By Commercial Application
10.4.2 By Type
10.4.3 By Array
10.4.4 By Country
10.4.4.1 China
10.4.4.1.1 By Application
10.4.4.1.2 By Type
10.4.4.1.3 By Array
10.4.4.2 India
10.4.4.2.1 By Application
10.4.4.2.2 By Type
10.4.4.2.3 By Array
10.4.4.3 Japan
10.4.4.3.1 By Application
10.4.4.3.2 By Type
10.4.4.3.3 By Array
10.4.4.4 Australia
10.4.4.4.1 By Application
10.4.4.4.2 By Type
10.4.4.4.3 By Array
10.5 Middle East
10.5.1 By Application
10.5.1.1 By Defense Application
10.5.1.2 By Government Application
10.5.1.3 By Commercial Application
10.5.2 By Type
10.5.3 By Array
10.5.4 By Country
10.5.4.1 Israel
10.5.4.1.1 By Application
10.5.4.1.2 By Type
10.5.4.1.3 By Array
10.5.4.2 Saudi Arabia
10.5.4.2.1 By Application
10.5.4.2.2 By Type
10.5.4.2.3 By Array
10.6 R0w
10.6.1 By Application
10.6.1.1 By Defense Application
10.6.1.2 By Government Application
10.6.1.3 By Commercial Application
10.6.2 By Type
10.6.3 By Array
10.6.4 By Country
10.6.4.1 Brazil
10.6.4.1.1 By Application
10.6.4.1.2 By Type
10.6.4.1.3 By Array
11 Competitive Landscape (Page No. - 116)
11.1 Introduction
11.2 Brand Analysis
11.3 Product Mapping
11.4 Rank Analysis
11.4.1 Contracts
11.4.2 New Product Launches
11.4.3 Agreements and Partnerships
12 Company Profiles (Page No. - 126)
12.1 Introduction
12.2 Japan Radio Company Limited
12.3 Terma A/S
12.4 Northrop Grumman Corporation
12.5 The Raytheon Company
12.6 Saab AB
12.7 Furuno Electric Company Ltd.
12.8 Israel Aerospace Industries
12.9 Thales Raytheon Systems Company LLC
12.10 Selex Es S.P.A
12.11 Kelvin Hughes Limited
12.12 Reutech Radar Systems (PTY) Ltd.
13 Appendix (Page No. - 156)
13.1 Discussion Guide
13.2 Introducing Rt: Real Time Market Intelligence
13.3 Knowledge Store: Marketsandmarkets Subscription Portal
13.4 Available Customization
13.4.1 Country-Level Analysis
13.4.2 Additional Company Profiles (Upto Five)
13.5 Related Reports
List of Tables (91 Tables)
Table 1 High Risk Incidents Involving Russia and Nato in 2014
Table 2 Market Drivers: Regional Analysis
Table 3 Conflicts and Deaths Due to Missile Attacks Across the Globe Between 2008 and 2014
Table 4 Military Expenditure of Developed Economies as Percentage of Gdp, 2005-2014
Table 5 X-Band Radars Used in Military Planes:
Table 6 X-Band Radar Industry Size, By Application, 2015-2021 (USD Million)
Table 7 X-Band Radar Industry in Defense Application, By Platform, 2015-2021 (USD Million)
Table 8 X-Band Radar Industry in Government Application, By Application Type , 2015-2021 (USD Million)
Table 9 X-Band Radar Industry in Commercial Application, By Application Type, 2015-2021 (USD Million)
Table 10 X-Band Radar Industry Size, By Type, 2015-2021 (USD Million)
Table 11 Mobile X-Band Radar Industry Size, By Region, 2015-2021 (USD Million)
Table 12 Sea-Based X-Band Radar Industry Size, By Region, 2015-2021 (USD Million)
Table 13 X-Band Radar Industry Size, By Array, 2015-2021 (USD Million)
Table 14 AESA X-Band Radar IndustrySize, By Region, 2015-2021 (USD Million)
Table 15 PESA X-Band Radar Industry Size, By Region, 2015-2021 (USD Million)
Table 16 X-Band Radar Industry Size, By Region, 2015�2021 (USD Million)
Table 17 North America: Missiles Upgradation Programs With AESA Radar, 2015
Table 18 North America: X-Band Radar Industry Size, By Application, 2015-2021 (USD Million)
Table 19 North America: X-Band Radar Industry in Defense Application, By Platform, 2015-2021 (USD Million)
Table 20 North America: X-Band Radar Industry in Government Application, By Application Type, 2015-2021 (USD Million)
Table 21 North America: X-Band Radar Industry in Commercial Application, By Application Type, 2015-2021 (USD Million)
Table 22 North America: X-Band Radar Industry Size, By Type, 2015-2021 (USD Million)
Table 23 North America: X-Band Radar Industry Size, By Array, 2015-2021 (USD Million)
Table 24 North America: X-Band Radar Industry, By Country, 2015-2021 (USD Million)
Table 25 U.S.: X-Band Radar Industry Size, By Application, 2015-2021 (USD Million)
Table 26 U.S.: X-Band Radar Industry Size, By Type, 2015-2021 (USD Million)
Table 27 U.S.: X-Band Radar Industry Size, By Array, 2015-2021 (USD Million)
Table 28 Canada: Market Size, By Application, 2015-2021 (USD Million)
Table 29 Canada: Market Size, By Type, 2015-2021 (USD Million)
Table 30 Canada: Market Size, By Array, 2015-2021 (USD Million)
Table 31 Europe: Market Size, By Application, 2015-2021 (USD Million)
Table 32 Europe: Market in Defense Application, By Platform, 2015-2021 (USD Million)
Table 33 Europe: Market in Government Application, By Application Type, 2015-2021 (USD Million)
Table 34 Europe: Market in Commercial Application, By Application Type, 2015-2021 (USD Million)
Table 35 Europe: Market Size, By Type, 2015-2021 (USD Million)
Table 36 Europe: Market Size, By Array, 2015-2021 (USD Million)
Table 37 Europe: Market, By Country, 2015-2021 (USD Million)
Table 38 Russia: Market Size, By Application, 2015-2021 (USD Million)
Table 39 Russia: Market Size, By Type, 2015-2021 (USD Million)
Table 40 Russia: Market Size, By Array, 2015-2021 (USD Million)
Table 41 France: Market Size, By Application, 2015-2021 (USD Million)
Table 42 France: Market Size, By Type, 2015-2021 (USD Million)
Table 43 France: Market Size, By Array, 2015-2021 (USD Million)
Table 44 U.K.: Market Size, By Application, 2015-2021 (USD Million)
Table 45 U.K.: Market Size, By Type, 2015-2021 (USD Million)
Table 46 U.K.: X-Band Radar Market Size, By Array, 2015-2021 (USD Million)
Table 47 Asia-Pacific: Market Size, By Application, 2015-2021 (USD Million)
Table 48 Asia-Pacific: Market Size in Defense Application, By Platform, 2015-2021 (USD Million)
Table 49 Asia-Pacific: Market Size in Government Application, By Application Type, 2015-2021 (USD Million)
Table 50 Asia-Pacific: Market Size in Commercial Application, By Application Type, 2015-2021 (USD Million)
Table 51 Asia-Pacific: Market Size, By Type, 2015-2021 (USD Million)
Table 52 Asia-Pacific: Market Size, By Array, 2015-2021 (USD Million)
Table 53 Asia-Pacific: Market Size, By Country, 2015-2021 (USD Million)
Table 54 China: Market Size, By Application, 2015-2021 (USD Million)
Table 55 China: Market Size, By Type, 2015-2021 (USD Million)
Table 56 China: Market Size, By Array, 2015-2021 (USD Million)
Table 57 India: Market Size, By Application, 2015-2021 (USD Million)
Table 58 India: Market Size, By Type, 2015-2021 (USD Million)
Table 59 India: Market Size, By Array, 2015-2021 (USD Million)
Table 60 Japan: Market Size, By Application, 2015-2021 (USD Million)
Table 61 Japan: Market Size, By Type, 2015-2021 (USD Million)
Table 62 Japan: XMarket Size, By Array, 2015-2021 (USD Million)
Table 63 Australia: Market Size, By Application, 2015-2021 (USD Million)
Table 64 Australia: Market Size, By Type, 2015-2021 (USD Million)
Table 65 Australia: Market Size, By Array, 2015-2021 (USD Million)
Table 66 Middle East: Market Size, By Application, 2015-2021 (USD Million)
Table 67 Middle East: Market in Defense Application, By Platform, 2015-2021 (USD Million)
Table 68 Middle East: Market in Government Application, By Application Type, 2015-2021 (USD Million)
Table 69 Middle East: Market in Commercial Application, By Application Type, 2015-2021 (USD Million)
Table 70 Middle East: Market Size, By Type, 2015-2021 (USD Million)
Table 71 Middle East: Market Size, By Array, 2015-2021 (USD Million)
Table 72 Middle East: Market Size, By Country, 2015-2021 (USD Million)
Table 73 Israel: Market Size, By Application, 2015-2021 (USD Million)
Table 74 Israel: Market Size, By Type, 2015-2021 (USD Million)
Table 75 Israel: Market Size, By Array, 2015-2021 (USD Million)
Table 76 Saudi Arabia: Market Size, By Application, 2015-2021 (USD Million)
Table 77 Saudi Arabia: Market Size, By Type, 2015-2021 (USD Million)
Table 78 Saudi Arabia: Market Size, By Array, 2015-2021 (USD Million)
Table 79 RoW: Market Size, By Application, 2015-2021 (USD Million)
Table 80 RoW: Market in Defense Application, By Platform, 2015-2021 (USD Million)
Table 81 RoW: Market in Government Application, By Application Type, 2015-2021 (USD Million)
Table 82 RoW: Market in Commercial Application, By Application Type, 2015-2021 (USD Million)
Table 83 RoW: Market Size, By Type, 2015-2021 (USD Million)
Table 84 RoW: Market Size, By Array, 2015-2021 (USD Million)
Table 85 RoW: Market, By Country, 2015-2021 (USD Million)
Table 86 Brazil: Market Size, By Application, 2015-2021 (USD Million)
Table 87 Brazil: Market Size, By Type, 2015-2021 (USD Million)
Table 88 Brazil: Market Size, By Array, 2015-2021 (USD Million)
Table 89 Contracts, November 2013�August 2016
Table 90 New Product Launches, October 2013�September 2016
Table 91 Agreements & Partnerships, August 2013�September 2015
List of Figures (62 Figures)
Figure 1 X-Band Radar Market Segmentation
Figure 2 X-Band Radar Market: Study Years
Figure 3 Reseach Process Flow
Figure 4 Research Design:X Band Radar
Figure 5 Breakdown of Primary Interviews: By Company Type, Designation, and Region
Figure 6 International Seaborne Trade, 2015
Figure 7 Market Size Estimation Methodology: Bottom-Up Approach
Figure 8 Market Size Estimation Methodology: Top-Down Approach
Figure 9 Data Triangulation
Figure 10 North America Accounted for the Largest Share of Market in 2015
Figure 11 Defense Application Segment to Grow at the Highest CAGR During the Forecast Period
Figure 12 Weather Detection Segment to Dominate the Market in Commercial Application in 2016
Figure 13 Long Term Contracts, New Product Launches are Key Growth Strategies of Major Players in the Market Between 2013 and 2016
Figure 14 Attractive Opportunities of AESA Radar in the Market, 2016-2021
Figure 15 Mobile X-Band Radar Segment to Grow at the Highest CAGR During the Forecast Period
Figure 16 AESA Subsegment Market to Grow at the Highest CAGR During the Forecast Period
Figure 17 Defense Segment to Account for the Largest Share of the Asia Pacific Market in 2016
Figure 18 North America to Account for the Largest Share of the Market in 2015
Figure 19 Asia-Pacific AESA Market Projected to Grow at the Highest CAGR During the Forecast Period
Figure 20 Market: By Application
Figure 21 Market: By Type
Figure 22 Market: By Array
Figure 23 Market: By Region
Figure 24 Factors Impacting the Market
Figure 25 Network Centric Warfare Systems, By Region, 2016 & 2021 (USD Million)
Figure 26 Military Expenditure of Brics Countries Between 2010 and 2014
Figure 27 Decline in Military Expenditure of Developed Economies
Figure 28 Technological Advancement in Market
Figure 29 The Defense Application Segment of the Market Projected to Grow at the Highest CAGR During the Forecast Period
Figure 30 The Airborne Platform Segment of the Market in Defense Application Projected to Grow at the Highest CAGR During the Forecast Period
Figure 31 The Border Security Segment of the Market in Defense Application Projected to Grow at the Highest CAGR Between 2016 and 2021
Figure 32 The Weather Detection Segment of the Market in Commercial Application Projected to Grow at the Highest CAGR Between 2016 and 2021
Figure 33 The Mobile X-Band Radar Market Projected to Grow at the Highest CAGR Between 2016 and 2021
Figure 34 The Asia-Pacific Mobile Market Projected to Grow at the Highest CAGR During the Forecast Period
Figure 35 The Asia-Pacific Sea-Based Market Projected to Grow at the Highest CAGR Between 2016 and 2021
Figure 36 The AESA Market Projected to Grow at the Highest CAGR Between 2016 and 2021
Figure 37 The Asia-Pacific AESA Radar Market Projected to Grow at the Highest CAGR During the Forecast Period
Figure 38 Geographic Snapshot: Asia-Pacific Projected to Grow at the Highest CAGR During the Forecast Period in the Market
Figure 39 North America: X-Band Radar Market Snapshot
Figure 40 Europe: X-Band Radar Market Snapshot
Figure 41 Asia-Pacific: X-Band Radar Market Snapshot
Figure 42 Middle East: X-Band Radar Market Snapshot
Figure 43 RoW: X-Band Radar Market Snapshot
Figure 44 Companies Adopted New Product Launch as Key Growth Strategy From January 2013 to September 2016
Figure 45 Brand Analysis of Top Players in the Market
Figure 46 Product Mapping of Top Players in the Market
Figure 47 Rank Analysis of Top Players in the Market Based on Contracts and Product
Figure 48 New Product Launch and Contracts Were the Key Growth Strategies
Figure 49 Geographical Revenue Mix of Top Five Market Players, 2015
Figure 50 Financials of the Major Players in the Market
Figure 51 Japan Radio Company Limited.: Company Snapshot
Figure 52 Japan Radio Company Ltd.: SWOT Analysis
Figure 53 Terma A/S: Company Snapshot
Figure 54 Northrop Grumman Corporation: Company Snapshot
Figure 55 The Raytheon Company: Company Snapshot
Figure 56 Raytheon Company: SWOT Analysis
Figure 57 Saab AB: Company Snapshot
Figure 58 Saab AB: SWOT Analysis
Figure 59 Furuno Electric Company Ltd.: Company Snapshot
Figure 60 Furuno Electric Company Ltd.: SWOT Analysis
Figure 61 Israel Aerospace Industries Ltd.: Company Snapshot
Figure 62 Segmentation


Growth opportunities and latent adjacency in X-Band Radar Market