Plate and Tube Heat Exchanger Market

Plate and Tube Heat Exchanger Market by Material Type (Stainless Steel, Titanium Alloy, Copper, Aluminum, Nickel Alloys), End-use Industry (Chemical, Petrochemical & Oil, Gas, HVAC & Refrigeration, Power Generation), & Region - Global Forecast to 2028

Report Code: CH 8939 Feb, 2024, by marketsandmarkets.com

The plate and tube heat exchanger market is projected to reach USD 884 million by 2028, at a CAGR of 6.5% from USD 645 million in 2023. Plate and tube heat exchangers represent a cutting-edge solution revolutionizing heat transfer mechanisms across industries. These advanced systems integrate diverse heat exchange techniques or materials within a singular unit, optimizing efficiency and adaptability in various industrial applications. Their versatility allows tailored solutions to specific industry demands, offering superior performance in critical sectors such as power generation, chemical processing, HVAC, and more. With a focus on enhanced efficiency and reduced environmental impact, these innovative heat exchangers pave the way for heightened operational efficiency, cost-effectiveness, and sustainability within diverse industrial operations.

Attractive Opportunities in the Plate and Tube Heat Exchanger Market
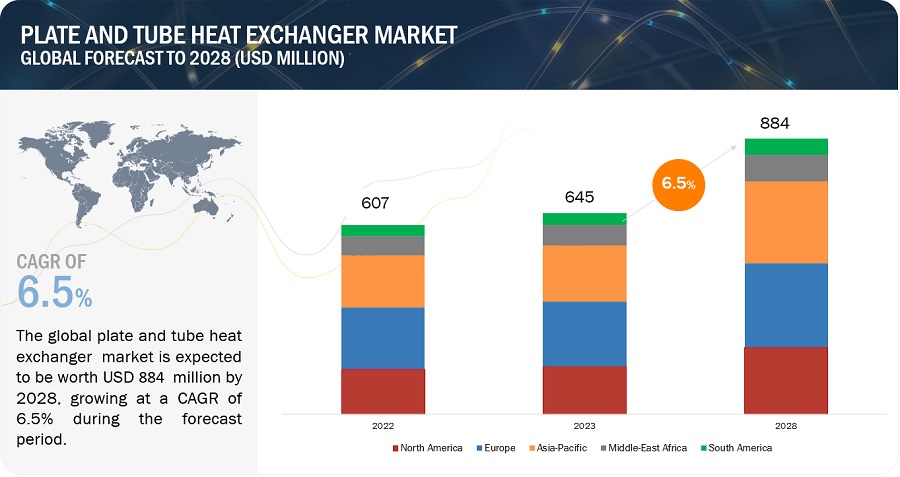
Plate and Tube Heat  Exchanger Market

To know about the assumptions considered for the study, Request for Free Sample Report
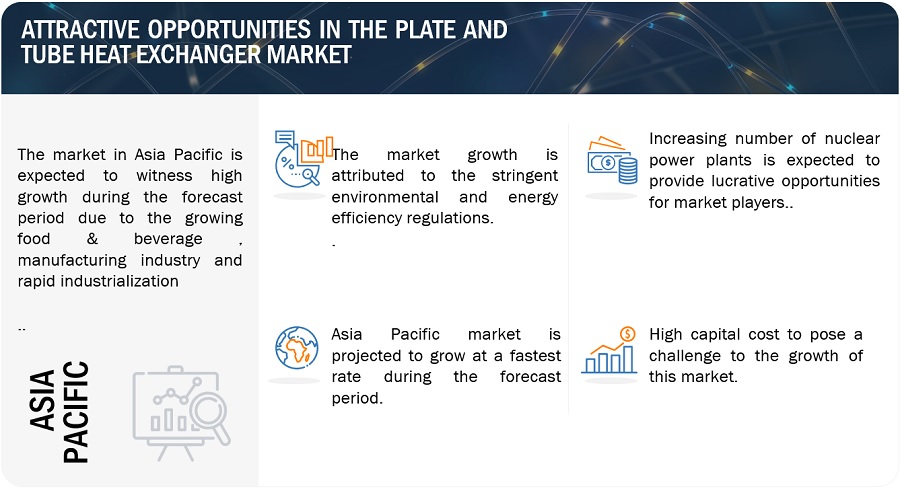
Plate and Tube Heat  Exchanger Market

Plate and Tube Heat Exchanger Market Dynamics

Driver: Stringent environmental and energy efficiency regulations

The regulatory and sustainability mandates have increased the demand for energy efficiency. After the Kyoto Protocol that commits state parties to reduce greenhouse gases emissions, the pressure on the manufacturing industries to reduce both energy use and the associated CO2 emissions has increased. Plate and tube heat exchangers are far more environmentally friendly than other heating or cooling equipment and these do not use non-renewable fossil fuels such as coal or natural gas for heat transfer. Governments and regulatory bodies, especially in North America and Europe, are focused on deploying heat exchangers to reduce CO2 emissions and provide an energy-efficient solution. Moreover, sustainability along with energy efficiency is gaining more importance among end consumers. An efficient heat recovery process reduces energy consumption and helps in significant cost savings.

North America and Europe regions have stringent regulations towards energy efficiency. For instance, European Union’s directive 2010/75/EU regulation, which is based on the pollutant emissions from air, water & land, generation of waste, use of raw materials, and energy efficiency, states that industries worldwide should use the best technologies to prevent the CO2 emission so that it does not impact the human health as well as the environment. According to the US Department of Energy (DOE), 50% of the energy is utilized for operating residential and commercial infrastructure, and most of the energy is used by HVACR systems and appliances in the US. Energy Policy and Conservation Act of 1975 (EPCA), and DOE’s Appliance and Equipment Standards Program and Energy Efficiency Directive 2012/27/EU are some of the major energy efficiency and emission regulations and programs. These regulations are driving the demand for efficient HVACR equipment, including the plate and tube heat exchanger systems.

Restraint: Traditional design preferences

In various industries, the prevailing inclination towards conventional heat exchanger designs reflects a confidence born out of established practices and reliability. Companies have long relied on specific types of heat exchangers, like shell and tube or plate heat exchangers, due to their proven track record in delivering consistent performance. This deep-rooted familiarity often translates into a cautious approach when contemplating the adoption of innovative plate and tube heat exchanger technologies. Industries, especially those with critical processes, tend to be risk-averse, viewing any potential disruption caused by transitioning to hybrid designs as a perceived risk affecting operational efficiency. Furthermore, substantial investments in existing infrastructure, encompassing equipment, training, and maintenance protocols aligned with conventional heat exchangers, reinforce the preference for traditional designs. The potential need for significant alterations and added investments in infrastructure to accommodate plate and tube heat exchangers further solidifies this inclination. Moreover, apprehensions regarding the reliability and performance of newer hybrid designs, particularly in demanding operational settings, contribute to the reluctance in embracing these technologies. Overcoming these entrenched preferences necessitates a comprehensive showcase of the undeniable benefits offered by plate and tube heat exchangers, encompassing superior efficiency, cost-effectiveness, and adaptability. Concurrently, addressing concerns about reliability, performance, and compatibility with existing infrastructure is crucial.

Opportunity: Increasing number of nuclear power plants.

A plate and tube heat exchanger is an essential component of a nuclear reactor. According to the International Atomic Energy Agency (IAEA), the global tally of operational nuclear reactors stood at 443, with an additional 50 reactors under construction as of 2021, indicative of the ongoing expansion in nuclear power generation. Plate and tube heat exchangers assume a pivotal role in this landscape, serving as integral components in facilitating the transfer of heat from the primary reactor coolant loop to secondary systems, crucial for steam generation and subsequent electricity production. Their capability to enhance heat transfer efficiency, while being adaptable to varying temperatures and pressures, aligns perfectly with the demanding operational requirements of nuclear facilities. As the global nuclear power market size continues to project robust growth, estimated to surpass USD 205 billion by 2028, the industry's inclination toward innovative and advanced heat transfer technologies, including plate and tube heat exchangers, remains evident.

Moreover, with a heightened focus on environmental sustainability and the need to reduce carbon emissions, the efficiency and reliability offered by plate and tube heat exchangers contribute significantly to the overall performance optimization of nuclear plants.

Challenge: High capital cost

Entering and operating in the plate and tube heat exchanger market demands substantial capital investment due to the need for advanced manufacturing setups. Manufacturers must allocate significant funds towards research and development to create innovative, customer-centric products that align with specific application needs. These specific requirements across various industries add to the capital needs. Manufacturers are obliged to cater to diverse consumer demands while maintaining cost-effectiveness in production and operations. Additionally, addressing consumers' varied needs escalates the necessary capital for plate and tube heat exchanger production. Crucial factors like material grade, heat transfer efficiency, refrigerant capacity, as well as volume and durability, significantly impact manufacturing costs. Established companies channel a considerable portion of their earnings into R&D endeavors. Nevertheless, the presence of local manufacturers offering cheaper products intensifies market competition and poses credibility challenges for larger industry players.

Plate and Tube Heat Exchanger Market: Ecosystem
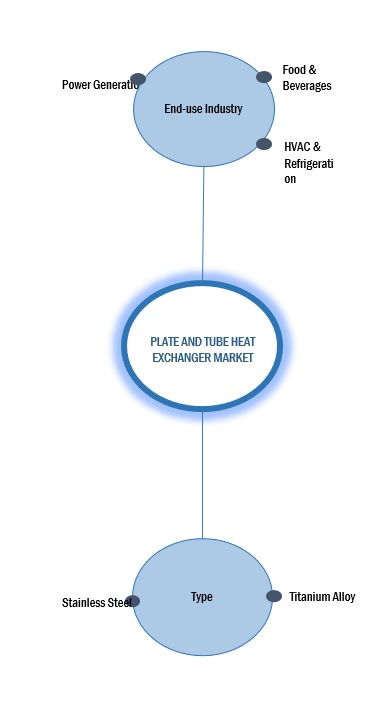
Plate and Tube Heat  Exchanger Market Ecosystem

Source: Secondary Research, Interviews with Experts, and MarketsandMarkets Analysis

"Chemical Segment type was the largest segment for plate and tube heat exchanger market in 2022, in terms of value."

The chemical industry stands as a significant end-user sector for plate and tube heat exchangers, leveraging these systems for diverse applications. In chemical manufacturing processes, heat exchangers play a pivotal role in controlling temperatures during reactions, distillation, and condensation, ensuring efficiency and safety. The versatility of plate and tube heat exchangers allows them to handle varying chemical compositions and extreme operating conditions, making them instrumental in maintaining precise temperatures critical for specific chemical reactions. These heat exchangers aid in energy recovery, optimize process efficiency, and facilitate the cooling or heating of various chemical compounds or mixtures. With stringent quality standards and the need for reliable heat transfer systems in chemical processes, plate and tube heat exchangers offer a crucial solution, ensuring enhanced productivity and safety within the chemical industry.

"Asia Pacific was the fastest growing market for plate and tube heat exchanger in 2022, in terms of value."

Asia Pacific was the fastest growing market for global plate and tube heat exchanger market, in terms of value, in 2022. the region's robust industrial growth across sectors such as manufacturing, chemicals, power generation, and HVAC systems creates substantial demand for efficient heat exchange solutions. Moreover, the rising emphasis on energy efficiency and stringent environmental regulations in countries like China, India, Japan, and South Korea drives the adoption of advanced heat exchanger technologies. China is the largest market in Asia Pacific. India is projected to witness the highest growth during the forecast period .
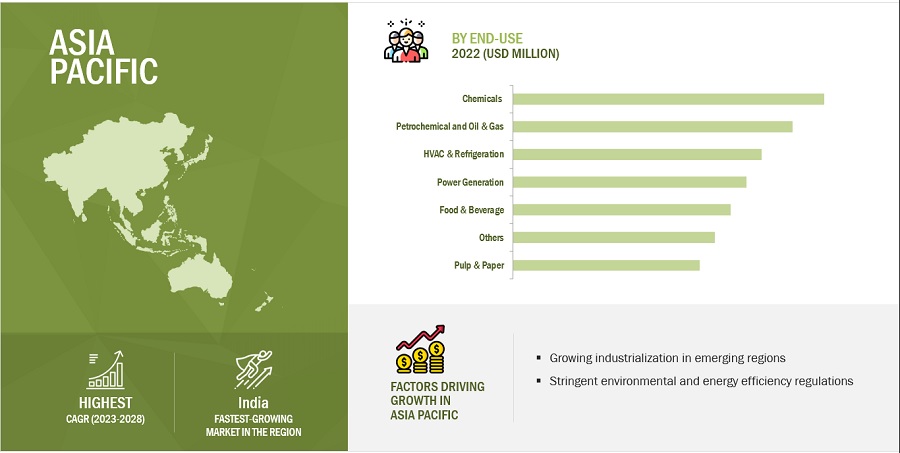
Plate and Tube Heat  Exchanger Market by Region

To know about the assumptions considered for the study, download the pdf brochure

Key Market Players

The key players in this market Alfa Laval (Sweden), Kelvion Holding GmbH (Germany), API Heat Transfer (US), HRS Heat Exchanger (UK), SPX Flow (US), Danfoss (Denmark), HFM Plate Heat Exchanger (China), Xylem (US), Wabtec Corporation (US), Thermex (UK). Continuous developments in the market—including new partnerships, mergers & acquisitions, agreements, and expansions—are expected to help the market grow. Leading manufacturers of plate and tube heat exchanger have opted for investment & expansion to sustain their market position.

Get online access to the report on the World's First Market Intelligence Cloud

  • Easy to Download Historical Data & Forecast Numbers
  • Company Analysis Dashboard for high growth potential opportunities
  • Research Analyst Access for customization & queries
  • Competitor Analysis with Interactive dashboard
  • Latest News, Updates & Trend analysis
Request Sample

Scope of the Report

Report Metric

Details

Years considered for the study

2019-2028

Base Year

2022

Forecast period

2023–2028

Units considered

Volume (Units); Value (USD Billion)

Segments

Material Type, End-use industry, and Region

Regions

Asia Pacific, North America, Europe, Middle East & Africa, and South America

Companies

Alfa Laval (Sweden), Kelvion Holding GmbH (Germany), API Heat Transfer (US), HRS Heat Exchanger (UK), SPX Flow (US), Danfoss (Denmark), HFM Plate Heat Exchanger (China), Xylem (US), Wabtec Corporation (US), Thermex (UK)

This report categorizes the global plate and tube heat exchanger market based on material type, End-use industry, and region.

Based on material type, the plate and tube heat exchanger market has been segmented as follows:
  • Stainless steel
  • Titanium alloy
  • Copper
  • Aluminum
  • Nickel Alloys
  • Others
Based on end-use industry, the plate and tube heat exchanger market has been segmented as follows:
  • Chemicals
  • Petrochemicals & Oil & Gas
  • HAVC & refrigeration
  • Food & beverage
  • Power generation
  • Pulp & paper
Based on region, the plate and tube heat exchanger market has been segmented as follows:
  • Asia Pacific
  • Europe
  • North America
  • Middle East & Africa
  • South America

Recent Developments

  • In September 2023, to meet the increased demand from various end-use industries, the kelvion expanded its production capacities in Sarstedt.  The facility can now produce an additional 150,000 heat exchangers per year.
  • In May 2022, Alfa Laval announced a joint venture with SSAB group (Global Swedish Steel Company) to produce the first heat exchanger made using fossil-free steel. The aim of this collaboration is to have the first unit made with hydrogen-reduced steel in 2023. This partnership will help Alfa Laval AB’s journey to becoming carbon neutral by 2030.
  • In July 2021, Exchanger Industries, a Canadian market leader and manufacturer of heat exchanger products, acquired HRS Heat exchangers Limited. This acquisition helps EIL accelerate its expansion in power generation, storage, and biofuel applications.

Frequently Asked Questions (FAQ):

To speak to our analyst for a discussion on the above findings, click Speak to Analyst

TABLE OF CONTENTS
 
1 INTRODUCTION (Page No. - 29)
    1.1 STUDY OBJECTIVES 
    1.2 MARKET DEFINITION 
           1.2.1 INCLUSIONS AND EXCLUSIONS
    1.3 STUDY SCOPE 
          FIGURE 1 PLATE AND TUBE HEAT EXCHANGER MARKET SEGMENTATION
    1.4 REGIONS COVERED 
    1.5 YEARS CONSIDERED 
    1.6 CURRENCY CONSIDERED 
    1.7 UNITS CONSIDERED 
    1.8 STAKEHOLDERS 
    1.9 SUMMARY OF CHANGES 
 
2 RESEARCH METHODOLOGY (Page No. - 33)
    2.1 RESEARCH DATA 
          FIGURE 2 PLATE AND TUBE HEAT EXCHANGER MARKET: RESEARCH DESIGN
           2.1.1 SECONDARY DATA
                    2.1.1.1 Key data from secondary sources
           2.1.2 PRIMARY DATA
                    2.1.2.1 Key data from primary sources
                    2.1.2.2 Primary interviews – demand and supply sides
                    2.1.2.3 Key industry insights
                    2.1.2.4 Breakdown of primary interviews
    2.2 MARKET SIZE ESTIMATION 
           2.2.1 BOTTOM-UP APPROACH
                    FIGURE 3 PLATE AND TUBE HEAT EXCHANGER MARKET: BOTTOM-UP APPROACH
           2.2.2 TOP-DOWN APPROACH
                    FIGURE 4 PLATE AND TUBE HEAT EXCHANGER MARKET: TOP-DOWN APPROACH
    2.3 DATA TRIANGULATION 
          FIGURE 5 PLATE AND TUBE HEAT EXCHANGER MARKET: DATA TRIANGULATION
    2.4 FACTOR ANALYSIS 
    2.5 ASSUMPTIONS 
    2.6 LIMITATIONS AND MARKET RISKS 
    2.7 ASSESSMENT OF ECONOMIC RECESSION 
 
3 EXECUTIVE SUMMARY (Page No. - 41)
    FIGURE 6 STAINLESS STEEL SEGMENT TO LEAD MARKET DURING FORECAST PERIOD
    FIGURE 7 CHEMICALS SECTOR TO LEAD MARKET DURING FORECAST PERIOD
    FIGURE 8 EUROPE ACCOUNTED FOR LARGEST MARKET SHARE IN 2022
 
4 PREMIUM INSIGHTS (Page No. - 44)
    4.1 ATTRACTIVE OPPORTUNITIES FOR PLAYERS IN PLATE AND TUBE HEAT EXCHANGER MARKET 
          FIGURE 9 HIGH GROWTH POTENTIAL IN ASIA PACIFIC
    4.2 ASIA PACIFIC: PLATE AND TUBE HEAT EXCHANGER MARKET,  BY END-USE INDUSTRY AND COUNTRY 
          FIGURE 10 CHEMICAL SEGMENT AND CHINA ACCOUNTED FOR LARGEST MARKET SIZE
    4.3 PLATE AND TUBE HEAT EXCHANGER MARKET, BY MATERIAL TYPE 
          FIGURE 11 STAINLESS STEEL TO BE LARGEST MATERIAL TYPE DURING FORECAST PERIOD
    4.4 PLATE AND TUBE HEAT EXCHANGER MARKET, BY END-USE INDUSTRY 
          FIGURE 12 CHEMICALS TO BE LARGEST END-USE INDUSTRY DURING FORECAST PERIOD
    4.5 PLATE AND TUBE HEAT EXCHANGER MARKET, BY KEY COUNTRY 
          FIGURE 13 INDIA TO RECORD HIGHEST CAGR DURING FORECAST PERIOD
 
5 MARKET OVERVIEW (Page No. - 47)
    5.1 INTRODUCTION 
    5.2 MARKET DYNAMICS 
          FIGURE 14 DRIVERS, RESTRAINTS, OPPORTUNITIES, AND CHALLENGES IN PLATE AND TUBE HEAT EXCHANGER MARKET
           5.2.1 DRIVERS
                    5.2.1.1 Growing industrialization in emerging regions
                    5.2.1.2 Stringent environmental and energy efficiency regulations
                    5.2.1.3 Rising demand for HVACR equipment
           5.2.2 RESTRAINTS
                    5.2.2.1 Volatility in raw material prices
                    5.2.2.2 Traditional design preferences
           5.2.3 OPPORTUNITIES
                    5.2.3.1 Increasing number of nuclear power plants
                    5.2.3.2 Growing aftermarket
           5.2.4 CHALLENGES
                    5.2.4.1 High capital cost
    5.3 VALUE CHAIN ANALYSIS 
          FIGURE 15 VALUE CHAIN ANALYSIS
           5.3.1 RAW MATERIAL SUPPLIERS
           5.3.2 MANUFACTURERS
           5.3.3 DISTRIBUTORS
           5.3.4 END USERS
    5.4 PORTER’S FIVE FORCES ANALYSIS 
          FIGURE 16 PLATE AND TUBE HEAT EXCHANGER MARKET: PORTER’S FIVE FORCES ANALYSIS
           5.4.1 THREAT OF NEW ENTRANTS
           5.4.2 THREAT OF SUBSTITUTES
           5.4.3 BARGAINING POWER OF SUPPLIERS
           5.4.4 BARGAINING POWER OF BUYERS
           5.4.5 INTENSITY OF COMPETITIVE RIVALRY
                    TABLE 1 PLATE AND TUBE HEAT EXCHANGER MARKET: PORTER’S FIVE FORCES ANALYSIS
    5.5 PATENT ANALYSIS 
           5.5.1 METHODOLOGY
           5.5.2 DOCUMENT TYPES
                    FIGURE 17 PATENT GRANT SHARE, 2013–2022
           5.5.3 PUBLICATION TRENDS IN LAST 10 YEARS
           5.5.4 INSIGHTS
           5.5.5 JURISDICTION ANALYSIS
           5.5.6 TOP 10 APPLICANTS
                    TABLE 2 TOP 10 PATENT OWNERS IN LAST 10 YEARS
    5.6 PRICING ANALYSIS 
           5.6.1 AVERAGE SELLING PRICE TREND, BY REGION
                    FIGURE 18 AVERAGE SELLING PRICE, BY REGION (USD/UNIT)
           5.6.2 AVERAGE SELLING PRICE TREND OF KEY PLAYERS, BY END-USE INDUSTRY
                    FIGURE 19 AVERAGE SELLING PRICE, BY MARKET PLAYER (USD/UNIT)
                    TABLE 3 AVERAGE SELLING PRICE OF KEY PLAYERS FOR TOP 3 APPLICATIONS (USD/UNIT)
                    FIGURE 20 AVERAGE SELLING PRICE, BY MATERIAL TYPE (USD/UNIT)
    5.7 ECOSYSTEM/MARKET MAP 
          FIGURE 21 PLATE AND TUBE HEAT EXCHANGER ECOSYSTEM
          TABLE 4 PLATE AND TUBE HEAT EXCHANGER: ECOSYSTEM
    5.8 TECHNOLOGY ANALYSIS 
           5.8.1 SMART HEAT EXCHANGER
           5.8.2 INTEGRATION OF NANOTECHNOLOGY IN HEAT EXCHANGER
    5.9 TRADE ANALYSIS 
           5.9.1 IMPORT SCENARIO OF HEAT EXCHANGER MARKET (EXCL. THOSE USED WITH BOILERS)
                    FIGURE 22 IMPORT OF HEAT EXCHANGER, BY KEY COUNTRY, 2020–2022
           5.9.2 EXPORT SCENARIO OF HEAT EXCHANGER MARKET (EXCL. THOSE USED WITH BOILERS)
                    FIGURE 23 EXPORT OF HEAT EXCHANGER, BY KEY COUNTRY, 2020–2022
    5.10 MACROECONOMIC INDICATORS 
           5.10.1 POWER GENERATION
                     TABLE 5 POWER GENERATION, BY COUNTRY (TWH)
           5.10.2 AIR CONDITIONING (AC) DEMAND
                     TABLE 6 AC DEMAND, 2021 (THOUSAND UNIT)
    5.11 TARIFF & REGULATORY LANDSCAPE 
           5.11.1 REGULATIONS
                    5.11.1.1 North America
                    5.11.1.2 Europe
                    5.11.1.3 Asia Pacific
           5.11.2 STANDARDS
                    5.11.2.1 IS 4503
                    5.11.2.2 PD 5500:2021
                    5.11.2.3 EN 13445
                    5.11.2.4 CODAP
           5.11.3 REGULATORY BODIES, GOVERNMENT AGENCIES, AND OTHER ORGANIZATIONS
                     TABLE 7 REGULATORY BODIES, GOVERNMENT AGENCIES, AND OTHER ORGANIZATIONS
    5.12 TRENDS/DISRUPTIONS IMPACTING CUSTOMER’S BUSINESS 
           FIGURE 24 TRENDS/DISRUPTIONS IMPACTING CUSTOMER’S BUSINESS IN PLATE AND TUBE HEAT EXCHANGER MARKET
    5.13 KEY CONFERENCES & EVENTS IN 2023–2024 
           TABLE 8 PLATE AND TUBE HEAT EXCHANGER MARKET: KEY CONFERENCES & EVENTS, 2023–2024
    5.14 KEY STAKEHOLDERS & BUYING CRITERIA 
           FIGURE 25 INFLUENCE OF STAKEHOLDERS ON BUYING PROCESS FOR TOP 3 END-USE INDUSTRIES
           5.14.1 KEY STAKEHOLDERS IN BUYING PROCESS
                     TABLE 9 INFLUENCE OF INSTITUTIONAL BUYERS ON BUYING PROCESS FOR TOP 3 APPLICATIONS
           5.14.2 BUYING CRITERIA
                    5.14.2.1 Quality
                    5.14.2.2 Service
                                 FIGURE 26 SUPPLIER SELECTION CRITERION
                                 TABLE 10 KEY BUYING CRITERIA FOR TOP 3 END-USE INDUSTRIES
    5.15 CASE STUDY ANALYSIS 
           5.15.1 OIL REFINERY
 
6 PLATE AND TUBE HEAT EXCHANGER MARKET, BY END-USE INDUSTRY (Page No. - 73)
    6.1 INTRODUCTION 
          FIGURE 27 CHEMICALS SEGMENT TO LEAD HEAT EXCHANGER MARKET BETWEEN  2023 AND 2028
          TABLE 11 PLATE AND TUBE HEAT EXCHANGER MARKET, BY END-USE INDUSTRY, 2019–2022 (UNIT)
          TABLE 12 PLATE AND TUBE HEAT EXCHANGER MARKET, BY END-USE INDUSTRY, 2023–2028 (UNIT)
          TABLE 13 PLATE AND TUBE HEAT EXCHANGER MARKET, BY END-USE INDUSTRY,  2019–2022 (USD MILLION)
          TABLE 14 PLATE AND TUBE HEAT EXCHANGER MARKET, BY END-USE INDUSTRY,  2023–2028 (USD MILLION)
    6.2 CHEMICALS 
           6.2.1 INCREASING APPLICATIONS IN PHARMACEUTICALS, MANUFACTURING, AND AGRICULTURE SECTORS TO DRIVE MARKET
    6.3 PETROCHEMICALS AND OIL & GAS 
           6.3.1 ADAPTABLE DESIGNS AND ADVANCED HEAT TRANSFER MECHANISMS TO DRIVE MARKET
    6.4 HVAC & REFRIGERATION 
           6.4.1 EFFICIENT COOLING AND HEATING PROPERTIES TO DRIVE MARKET
    6.5 FOOD & BEVERAGES 
           6.5.1 PRODUCT QUALITY, SAFETY, AND OPERATIONAL EFFICIENCY TO DRIVE MARKET
    6.6 POWER GENERATION 
           6.6.1 THERMAL EFFICIENCY AND ENERGY PRODUCTION TO DRIVE MARKET
    6.7 PULP & PAPER 
           6.7.1 ENERGY CONSUMPTION AND MAINTENANCE OF THERMAL CONDITIONS TO DRIVE MARKET
    6.8 OTHER END-USE INDUSTRIES 
 
7 PLATE AND TUBE HEAT EXCHANGER MARKET, BY MATERIAL TYPE (Page No. - 79)
    7.1 INTRODUCTION 
          FIGURE 28 STAINLESS STEEL TO LEAD HEAT EXCHANGER MARKET BETWEEN  2023 AND 2028
          TABLE 15 PLATE AND TUBE HEAT EXCHANGER MARKET, BY MATERIAL TYPE, 2019–2022 (UNIT)
          TABLE 16 PLATE AND TUBE HEAT EXCHANGER MARKET, BY MATERIAL TYPE, 2023–2028 (UNIT)
          TABLE 17 PLATE AND TUBE HEAT EXCHANGER MARKET, BY MATERIAL TYPE,  2019–2022 (USD MILLION)
          TABLE 18 PLATE AND TUBE HEAT EXCHANGER MARKET, BY MATERIAL TYPE,  2023–2028 (USD MILLION)
    7.2 STAINLESS STEEL 
    7.3 TITANIUM ALLOYS 
    7.4 COPPER 
    7.5 ALUMINUM 
    7.6 NICKEL ALLOYS 
    7.7 OTHER MATERIAL TYPES 
 
8 PLATE AND TUBE HEAT EXCHANGER MARKET, BY REGION (Page No. - 84)
    8.1 INTRODUCTION 
          FIGURE 29 INDIA TO REGISTER HIGHEST GROWTH DURING FORECAST PERIOD
          TABLE 19 PLATE AND TUBE HEAT EXCHANGER MARKET, BY REGION, 2019–2022 (UNIT)
          TABLE 20 PLATE AND TUBE HEAT EXCHANGER MARKET, BY REGION, 2023–2028 (UNIT)
          TABLE 21 PLATE AND TUBE HEAT EXCHANGER MARKET, BY REGION, 2019–2022 (USD MILLION)
          TABLE 22 PLATE AND TUBE HEAT EXCHANGER MARKET, BY REGION, 2023–2028 (USD MILLION)
    8.2 ASIA PACIFIC 
          FIGURE 30 ASIA PACIFIC: PLATE AND TUBE HEAT EXCHANGER MARKET SNAPSHOT
          TABLE 23 ASIA PACIFIC: PLATE AND TUBE HEAT EXCHANGER MARKET, BY COUNTRY,  2019–2022 (UNIT)
          TABLE 24 ASIA PACIFIC: PLATE AND TUBE HEAT EXCHANGER MARKET, BY COUNTRY,  2023–2028 (UNIT)
          TABLE 25 ASIA PACIFIC: PLATE AND TUBE HEAT EXCHANGER MARKET, BY COUNTRY,  2019–2022 (USD MILLION)
          TABLE 26 ASIA PACIFIC: PLATE AND TUBE HEAT EXCHANGER MARKET, BY COUNTRY,  2023–2028 (USD MILLION)
          TABLE 27 ASIA PACIFIC: PLATE AND TUBE HEAT EXCHANGER MARKET, BY END-USE INDUSTRY,  2019–2022 (UNIT)
          TABLE 28 ASIA PACIFIC: PLATE AND TUBE HEAT EXCHANGER MARKET, BY END-USE INDUSTRY,  2023–2028 (UNIT)
          TABLE 29 ASIA PACIFIC: PLATE AND TUBE HEAT EXCHANGER MARKET, BY END-USE INDUSTRY,  2019–2022 (USD MILLION)
          TABLE 30 ASIA PACIFIC: PLATE AND TUBE HEAT EXCHANGER MARKET, BY END-USE INDUSTRY,  2023–2028 (USD MILLION)
           8.2.1 RECESSION IMPACT
           8.2.2 CHINA
                    8.2.2.1 Rapid urbanization and infrastructural development to drive market
                                TABLE 31 CHINA: PLATE AND TUBE HEAT EXCHANGER MARKET, BY END-USE INDUSTRY,  2019–2022 (UNIT)
                                TABLE 32 CHINA: PLATE AND TUBE HEAT EXCHANGER MARKET, BY END-USE INDUSTRY,  2023–2028 (UNIT)
                                TABLE 33 CHINA: PLATE AND TUBE HEAT EXCHANGER MARKET, BY END-USE INDUSTRY,  2019–2022 (USD MILLION)
                                TABLE 34 CHINA: PLATE AND TUBE HEAT EXCHANGER MARKET, BY END-USE INDUSTRY,  2023–2028 (USD MILLION)
           8.2.3 JAPAN
                    8.2.3.1 Technological advancement and strong economy to drive market
                                TABLE 35 JAPAN: PLATE AND TUBE HEAT EXCHANGER MARKET, BY END-USE INDUSTRY,  2019–2022 (UNIT)
                                TABLE 36 JAPAN: PLATE AND TUBE HEAT EXCHANGER MARKET, BY END-USE INDUSTRY, 2023–2028 (UNIT)
                                TABLE 37 JAPAN: PLATE AND TUBE HEAT EXCHANGER MARKET, BY END-USE INDUSTRY,  2019–2022 (USD MILLION)
                                TABLE 38 JAPAN: PLATE AND TUBE HEAT EXCHANGER MARKET, BY END-USE INDUSTRY,  2023–2028 (USD MILLION)
           8.2.4 INDIA
                    8.2.4.1 Rapid urbanization and industrialization to drive market
                                TABLE 39 INDIA: PLATE AND TUBE HEAT EXCHANGER MARKET, BY END-USE INDUSTRY,  2019–2022 (UNIT)
                                TABLE 40 INDIA: PLATE AND TUBE HEAT EXCHANGER MARKET, BY END-USE INDUSTRY,  2023–2028 (UNIT)
                                TABLE 41 INDIA: PLATE AND TUBE HEAT EXCHANGER MARKET, BY END-USE INDUSTRY,  2019–2022 (USD MILLION)
                                TABLE 42 INDIA: PLATE AND TUBE HEAT EXCHANGER MARKET, BY END-USE INDUSTRY,  2023–2028 (USD MILLION)
           8.2.5 SOUTH KOREA
                    8.2.5.1 Investment in energy sources to drive market
                                TABLE 43 SOUTH KOREA: PLATE AND TUBE HEAT EXCHANGER MARKET, BY END-USE INDUSTRY,  2019–2022 (UNIT)
                                TABLE 44 SOUTH KOREA: PLATE AND TUBE HEAT EXCHANGER MARKET, BY END-USE INDUSTRY,  2023–2028 (UNIT)
                                TABLE 45 SOUTH KOREA: PLATE AND TUBE HEAT EXCHANGER MARKET, BY END-USE INDUSTRY,  2019–2022 (USD MILLION)
                                TABLE 46 SOUTH KOREA: PLATE AND TUBE HEAT EXCHANGER MARKET, BY END-USE INDUSTRY,  2023–2028 (USD MILLION)
           8.2.6 REST OF ASIA PACIFIC
                    TABLE 47 REST OF ASIA PACIFIC: PLATE AND TUBE HEAT EXCHANGER MARKET,  BY END-USE INDUSTRY, 2019–2022 (UNIT)
                    TABLE 48 REST OF ASIA PACIFIC: PLATE AND TUBE HEAT EXCHANGER MARKET, BY END-USE INDUSTRY, 2023–2028 (UNIT)
                    TABLE 49 REST OF ASIA PACIFIC: PLATE AND TUBE HEAT EXCHANGER MARKET, BY END-USE INDUSTRY, 2019–2022 (USD MILLION)
                    TABLE 50 REST OF ASIA PACIFIC: PLATE AND TUBE HEAT EXCHANGER MARKET, BY END-USE INDUSTRY, 2023–2028 (USD MILLION)
    8.3 EUROPE 
          FIGURE 31 EUROPE: PLATE AND TUBE HEAT EXCHANGER MARKET SNAPSHOT
          TABLE 51 EUROPE: PLATE AND TUBE HEAT EXCHANGER MARKET, BY COUNTRY, 2019–2022 (UNIT)
          TABLE 52 EUROPE: PLATE AND TUBE HEAT EXCHANGER MARKET, BY COUNTRY, 2023–2028 (UNIT)
          TABLE 53 EUROPE: PLATE AND TUBE HEAT EXCHANGER MARKET, BY COUNTRY,  2019–2022 (USD MILLION)
          TABLE 54 EUROPE: PLATE AND TUBE HEAT EXCHANGER MARKET, BY COUNTRY,  2023–2028 (USD MILLION)
          TABLE 55 EUROPE: PLATE AND TUBE HEAT EXCHANGER MARKET, BY END-USE INDUSTRY,  2019–2022 (UNIT)
          TABLE 56 EUROPE: PLATE AND TUBE HEAT EXCHANGER MARKET, BY END-USE INDUSTRY,  2023–2028 (UNIT)
          TABLE 57 EUROPE: PLATE AND TUBE HEAT EXCHANGER MARKET, BY END-USE INDUSTRY,  2019–2022 (USD MILLION)
          TABLE 58 EUROPE: PLATE AND TUBE HEAT EXCHANGER MARKET, BY END-USE INDUSTRY,  2023–2028 (USD MILLION)
           8.3.1 RECESSION IMPACT
           8.3.2 GERMANY
                    8.3.2.1 Rising exports and low labor costs to drive market
                                TABLE 59 GERMANY: PLATE AND TUBE HEAT EXCHANGER MARKET, BY END-USE INDUSTRY,  2019–2022 (UNIT)
                                TABLE 60 GERMANY: PLATE AND TUBE HEAT EXCHANGER MARKET, BY END-USE INDUSTRY,  2023–2028 (UNIT)
                                TABLE 61 GERMANY: PLATE AND TUBE HEAT EXCHANGER MARKET, BY END-USE INDUSTRY,  2019–2022 (USD MILLION)
                                TABLE 62 GERMANY: PLATE AND TUBE HEAT EXCHANGER MARKET, BY END-USE INDUSTRY,  2023–2028 (USD MILLION)
           8.3.3 ITALY
                    8.3.3.1 Growing investment in chemical industry to drive market
                                TABLE 63 ITALY: PLATE AND TUBE HEAT EXCHANGER MARKET, BY END-USE INDUSTRY,  2019–2022 (UNIT)
                                TABLE 64 ITALY: PLATE AND TUBE HEAT EXCHANGER MARKET, BY END-USE INDUSTRY,  2023–2028 (UNIT)
                                TABLE 65 ITALY: PLATE AND TUBE HEAT EXCHANGER MARKET, BY END-USE INDUSTRY,  2019–2022 (USD MILLION)
                                TABLE 66 ITALY: PLATE AND TUBE HEAT EXCHANGER MARKET, BY END-USE INDUSTRY,  2023–2028 (USD MILLION)
           8.3.4 FRANCE
                    8.3.4.1 Rising demand from chemical and food & beverage industries to drive market
                                TABLE 67 FRANCE: PLATE AND TUBE HEAT EXCHANGER MARKET, BY END-USE INDUSTRY,  2019–2022 (UNIT)
                                TABLE 68 FRANCE: PLATE AND TUBE HEAT EXCHANGER MARKET, BY END-USE INDUSTRY,  2023–2028 (UNIT)
                                TABLE 69 FRANCE: PLATE AND TUBE HEAT EXCHANGER MARKET, BY END-USE INDUSTRY,  2019–2022 (USD MILLION)
                                TABLE 70 FRANCE: PLATE AND TUBE HEAT EXCHANGER MARKET, BY END-USE INDUSTRY,  2023–2028 (USD MILLION)
           8.3.5 SPAIN
                    8.3.5.1 Expansions in oil & gas industry to drive market
                                TABLE 71 SPAIN: PLATE AND TUBE HEAT EXCHANGER MARKET, BY END-USE INDUSTRY,  2019–2022 (UNIT)
                                TABLE 72 SPAIN: PLATE AND TUBE HEAT EXCHANGER MARKET, BY END-USE INDUSTRY,  2023–2028 (UNIT)
                                TABLE 73 SPAIN: PLATE AND TUBE HEAT EXCHANGER MARKET, BY END-USE INDUSTRY,  2019–2022 (USD MILLION)
                                TABLE 74 SPAIN: PLATE AND TUBE HEAT EXCHANGER MARKET, BY END-USE INDUSTRY, 2023–2028 (USD MILLION)
           8.3.6 UK
                    8.3.6.1 R&D expenditure in chemical industry to drive market
                                TABLE 75 UK: PLATE AND TUBE HEAT EXCHANGER MARKET, BY END-USE INDUSTRY,  2019–2022 (UNIT)
                                TABLE 76 UK: PLATE AND TUBE HEAT EXCHANGER MARKET, BY END-USE INDUSTRY,  2023–2028 (UNIT)
                                TABLE 77 UK: PLATE AND TUBE HEAT EXCHANGER MARKET, BY END-USE INDUSTRY,  2019–2022 (USD MILLION)
                                TABLE 78 UK: PLATE AND TUBE HEAT EXCHANGER MARKET, BY END-USE INDUSTRY,  2023–2028 (USD MILLION)
           8.3.7 REST OF EUROPE
                    TABLE 79 REST OF EUROPE: PLATE AND TUBE HEAT EXCHANGER MARKET, BY END-USE INDUSTRY,  2019–2022 (UNIT)
                    TABLE 80 REST OF EUROPE: PLATE AND TUBE HEAT EXCHANGER MARKET, BY END-USE INDUSTRY,  2023–2028 (UNIT)
                    TABLE 81 REST OF EUROPE: PLATE AND TUBE HEAT EXCHANGER MARKET, BY END-USE INDUSTRY,  2019–2022 (USD MILLION)
                    TABLE 82 REST OF EUROPE: PLATE AND TUBE HEAT EXCHANGER MARKET, BY END-USE INDUSTRY,  2023–2028 (USD MILLION)
    8.4 NORTH AMERICA 
          FIGURE 32 NORTH AMERICA: PLATE AND TUBE HEAT EXCHANGER MARKET SNAPSHOT
          TABLE 83 NORTH AMERICA: PLATE AND TUBE HEAT EXCHANGER MARKET, BY COUNTRY,  2019–2022 (UNIT)
          TABLE 84 NORTH AMERICA: PLATE AND TUBE HEAT EXCHANGER MARKET, BY COUNTRY,  2023–2028 (UNIT)
          TABLE 85 NORTH AMERICA: PLATE AND TUBE HEAT EXCHANGER MARKET, BY COUNTRY,  2019–2022 (USD MILLION)
          TABLE 86 NORTH AMERICA: PLATE AND TUBE HEAT EXCHANGER MARKET, BY COUNTRY,  2023–2028 (USD MILLION)
          TABLE 87 NORTH AMERICA: PLATE AND TUBE HEAT EXCHANGER MARKET, BY END-USE INDUSTRY,  2019–2022 (UNIT)
          TABLE 88 NORTH AMERICA: PLATE AND TUBE HEAT EXCHANGER MARKET, BY END-USE INDUSTRY,  2023–2028 (UNIT)
          TABLE 89 NORTH AMERICA: PLATE AND TUBE HEAT EXCHANGER MARKET, BY END-USE INDUSTRY,  2019–2022 (USD MILLION)
          TABLE 90 NORTH AMERICA: PLATE AND TUBE HEAT EXCHANGER MARKET, BY END-USE INDUSTRY,  2023–2028 (USD MILLION)
           8.4.1 RECESSION IMPACT
           8.4.2 US
                    8.4.2.1 Increase in oil production activities and industrial development to drive market
                                TABLE 91 US: PLATE & TUBE HEAT EXCHANGER MARKET, BY END-USE INDUSTRY, 2019–2022 (UNIT)
                                TABLE 92 US: PLATE & TUBE HEAT EXCHANGER MARKET, BY END-USE INDUSTRY,  2023–2028 (UNIT)
                                TABLE 93 US: PLATE & TUBE HEAT EXCHANGER MARKET, BY END-USE INDUSTRY,  2019–2022 (USD MILLION)
                                TABLE 94 US: PLATE & TUBE HEAT EXCHANGER MARKET, BY END-USE INDUSTRY,  2023–2028 (USD MILLION)
           8.4.3 CANADA
                    8.4.3.1 Availability of vast natural resources to drive market growth
                                TABLE 95 CANADA: PLATE & TUBE HEAT EXCHANGER MARKET, BY END-USE INDUSTRY,  2019–2022 (UNIT)
                                TABLE 96 CANADA: PLATE & TUBE HEAT EXCHANGER MARKET, BY END-USE INDUSTRY,  2023–2028 (UNIT)
                                TABLE 97 CANADA: PLATE & TUBE HEAT EXCHANGER MARKET, BY END-USE INDUSTRY,  2019–2022 (USD MILLION)
                                TABLE 98 CANADA: PLATE & TUBE HEAT EXCHANGER MARKET, BY END-USE INDUSTRY,  2023–2028 (USD MILLION)
           8.4.4 MEXICO
                    8.4.4.1 Deep-water oil & shale production generation to drive market
                                TABLE 99 MEXICO: PLATE & TUBE HEAT EXCHANGER MARKET, BY END-USE INDUSTRY,  2019–2022 (UNIT)
                                TABLE 100 MEXICO: PLATE & TUBE HEAT EXCHANGER MARKET, BY END-USE INDUSTRY,  2023–2028 (UNIT)
                                TABLE 101 MEXICO: PLATE & TUBE HEAT EXCHANGER MARKET, BY END-USE INDUSTRY,  2019–2022 (USD MILLION)
                                TABLE 102 MEXICO: PLATE & TUBE HEAT EXCHANGER MARKET, BY END-USE INDUSTRY,  2023–2028 (USD MILLION)
    8.5 SOUTH AMERICA 
          TABLE 103 SOUTH AMERICA: PLATE & TUBE HEAT EXCHANGER MARKET, BY COUNTRY,  2019–2022 (UNIT)
          TABLE 104 SOUTH AMERICA: PLATE & TUBE HEAT EXCHANGER MARKET, BY COUNTRY,  2023–2028 (UNIT)
          TABLE 105 SOUTH AMERICA: PLATE & TUBE HEAT EXCHANGER MARKET, BY COUNTRY,  2019–2022 (USD MILLION)
          TABLE 106 SOUTH AMERICA: PLATE & TUBE HEAT EXCHANGER MARKET, BY COUNTRY,  2023–2028 (USD MILLION)
          TABLE 107 SOUTH AMERICA: PLATE & TUBE HEAT EXCHANGER MARKET, BY END-USE INDUSTRY,  2019–2022 (UNIT)
          TABLE 108 SOUTH AMERICA: PLATE & TUBE HEAT EXCHANGER MARKET, BY END-USE INDUSTRY,  2023–2028 (UNIT)
          TABLE 109 SOUTH AMERICA: PLATE & TUBE HEAT EXCHANGER MARKET, BY END-USE INDUSTRY,  2019–2022 (USD MILLION)
          TABLE 110 SOUTH AMERICA: PLATE & TUBE HEAT EXCHANGER MARKET, BY END-USE INDUSTRY,  2023–2028 (USD MILLION)
           8.5.1 RECESSION IMPACT
           8.5.2 BRAZIL
                    8.5.2.1 Energy transition due to natural calamity to drive market
                                TABLE 111 BRAZIL: PLATE & TUBE HEAT EXCHANGER MARKET, BY END-USE INDUSTRY,  2019–2022 (UNIT)
                                TABLE 112 BRAZIL: PLATE & TUBE HEAT EXCHANGER MARKET, BY END-USE INDUSTRY,  2023–2028 (UNIT)
                                TABLE 113 BRAZIL: PLATE & TUBE HEAT EXCHANGER MARKET, BY END-USE INDUSTRY,  2019–2022 (USD MILLION)
                                TABLE 114 BRAZIL: PLATE & TUBE HEAT EXCHANGER MARKET, BY END-USE INDUSTRY,  2023–2028 (USD MILLION)
           8.5.3 ARGENTINA
                    8.5.3.1 Focus on non-hydro renewable sources to drive market
                                TABLE 115 ARGENTINA: PLATE & TUBE HEAT EXCHANGER MARKET, BY END-USE INDUSTRY,  2019–2022 (UNIT)
                                TABLE 116 ARGENTINA: PLATE & TUBE HEAT EXCHANGER MARKET, BY END-USE INDUSTRY,  2023–2028 (UNIT)
                                TABLE 117 ARGENTINA: PLATE & TUBE HEAT EXCHANGER MARKET, BY END-USE INDUSTRY,  2019–2022 (USD MILLION)
                                TABLE 118 ARGENTINA: PLATE & TUBE HEAT EXCHANGER MARKET, BY END-USE INDUSTRY,  2023–2028 (USD MILLION)
           8.5.4 REST OF SOUTH AMERICA
                    TABLE 119 REST OF SOUTH AMERICA: PLATE & TUBE HEAT EXCHANGER MARKET, BY END-USE INDUSTRY, 2019–2022 (UNIT)
                    TABLE 120 REST OF SOUTH AMERICA: PLATE & TUBE HEAT EXCHANGER MARKET, BY END-USE INDUSTRY, 2023–2028 (UNIT)
                    TABLE 121 REST OF SOUTH AMERICA: PLATE & TUBE HEAT EXCHANGER MARKET, BY END-USE INDUSTRY, 2019–2022 (USD MILLION)
                    TABLE 122 REST OF SOUTH AMERICA: PLATE & TUBE HEAT EXCHANGER MARKET, BY END-USE INDUSTRY, 2023–2028 (USD MILLION)
    8.6 MIDDLE EAST & AFRICA 
          TABLE 123 MIDDLE EAST & AFRICA: PLATE & TUBE HEAT EXCHANGER MARKET, BY COUNTRY,  2019–2022 (UNIT)
          TABLE 124 MIDDLE EAST & AFRICA: PLATE & TUBE HEAT EXCHANGER MARKET, BY COUNTRY,  2023–2028 (UNIT)
          TABLE 125 MIDDLE EAST & AFRICA: PLATE & TUBE HEAT EXCHANGER MARKET, BY COUNTRY,  2019–2022 (USD MILLION)
          TABLE 126 MIDDLE EAST & AFRICA: PLATE & TUBE HEAT EXCHANGER MARKET, BY COUNTRY,  2023–2028 (USD MILLION)
          TABLE 127 MIDDLE EAST & AFRICA: PLATE & TUBE HEAT EXCHANGER MARKET, BY END-USE INDUSTRY, 2019–2022 (UNIT)
          TABLE 128 MIDDLE EAST & AFRICA: PLATE & TUBE HEAT EXCHANGER MARKET, BY END-USE INDUSTRY, 2023–2028 (UNIT)
          TABLE 129 MIDDLE EAST & AFRICA: PLATE & TUBE HEAT EXCHANGER MARKET, BY END-USE INDUSTRY, 2019–2022 (USD MILLION)
          TABLE 130 MIDDLE EAST & AFRICA: PLATE & TUBE HEAT EXCHANGER MARKET, BY END-USE INDUSTRY, 2023–2028 (USD MILLION)
           8.6.1 RECESSION IMPACT
           8.6.2 GCC COUNTRIES
                    8.6.2.1 Saudi Arabia
                               8.6.2.1.1 Extensive use of petrochemicals in clothing, digital devices, and electric vehicle parts to drive market
                                              TABLE 131 SAUDI ARABIA: PLATE & TUBE HEAT EXCHANGER MARKET, BY END-USE INDUSTRY,  2019–2022 (UNIT)
                                              TABLE 132 SAUDI ARABIA: PLATE & TUBE HEAT EXCHANGER MARKET, BY END-USE INDUSTRY,  2023–2028 (UNIT)
                                              TABLE 133 SAUDI ARABIA: PLATE & TUBE HEAT EXCHANGER MARKET, BY END-USE INDUSTRY,  2019–2022 (USD MILLION)
                                              TABLE 134 SAUDI ARABIA: PLATE & TUBE HEAT EXCHANGER MARKET, BY END-USE INDUSTRY,  2023–2028 (USD MILLION)
                    8.6.2.2 UAE
                               8.6.2.2.1 Investment in energy and infrastructure to drive market
                                              TABLE 135 UAE: PLATE & TUBE HEAT EXCHANGER MARKET, BY END-USE INDUSTRY,  2019–2022 (UNIT)
                                              TABLE 136 UAE: PLATE & TUBE HEAT EXCHANGER MARKET, BY END-USE INDUSTRY,  2023–2028 (UNIT)
                                              TABLE 137 UAE: PLATE & TUBE HEAT EXCHANGER MARKET, BY END-USE INDUSTRY,  2019–2022 (USD MILLION)
                                              TABLE 138 UAE: PLATE & TUBE HEAT EXCHANGER MARKET, BY END-USE INDUSTRY,  2023–2028 (USD MILLION)
                    8.6.2.3 Rest of GCC Countries
                                TABLE 139 REST OF GCC COUNTRIES: PLATE & TUBE HEAT EXCHANGER MARKET, BY END-USE INDUSTRY, 2019–2022 (UNIT)
                                TABLE 140 REST OF GCC COUNTRIES: PLATE & TUBE HEAT EXCHANGER MARKET, BY END-USE INDUSTRY, 2023–2028 (UNIT)
                                TABLE 141 REST OF GCC COUNTRIES: PLATE & TUBE HEAT EXCHANGER MARKET, BY END-USE INDUSTRY, 2019–2022 (USD MILLION)
                                TABLE 142 REST OF GCC COUNTRIES: PLATE & TUBE HEAT EXCHANGER MARKET, BY END-USE INDUSTRY, 2023–2028 (USD MILLION)
           8.6.3 SOUTH AFRICA
                    8.6.3.1 Investment in construction, transportation, and retail sectors to drive market
                                TABLE 143 SOUTH AFRICA: PLATE & TUBE HEAT EXCHANGER MARKET, BY END-USE INDUSTRY,  2019–2022 (UNIT)
                                TABLE 144 SOUTH AFRICA: PLATE & TUBE HEAT EXCHANGER MARKET, BY END-USE INDUSTRY,  2023–2028 (UNIT)
                                TABLE 145 SOUTH AFRICA: PLATE & TUBE HEAT EXCHANGER MARKET, BY END-USE INDUSTRY,  2019–2022 (USD MILLION)
                                TABLE 146 SOUTH AFRICA: PLATE & TUBE HEAT EXCHANGER MARKET, BY END-USE INDUSTRY,  2023–2028 (USD MILLION)
           8.6.4 REST OF MIDDLE EAST & AFRICA
                    TABLE 147 REST OF MIDDLE EAST & AFRICA: PLATE & TUBE HEAT EXCHANGER MARKET, BY END-USE INDUSTRY, 2019–2022 (UNIT)
                    TABLE 148 REST OF MIDDLE EAST & AFRICA: PLATE & TUBE HEAT EXCHANGER MARKET,  BY END-USE INDUSTRY, 2023–2028 (UNIT)
                    TABLE 149 REST OF MIDDLE EAST & AFRICA: PLATE & TUBE HEAT EXCHANGER MARKET,  BY END-USE INDUSTRY, 2019–2022 (USD MILLION)
                    TABLE 150 REST OF MIDDLE EAST & AFRICA: PLATE & TUBE HEAT EXCHANGER MARKET, BY END-USE INDUSTRY, 2023–2028 (USD MILLION)
 
9 COMPETITIVE LANDSCAPE (Page No. - 145)
    9.1 KEY PLAYER STRATEGIES/RIGHT TO WIN 
          FIGURE 33 COMPANIES ADOPTED PARTNERSHIP AND EXPANSION AS KEY GROWTH STRATEGIES BETWEEN 2018 AND 2023
    9.2 REVENUE ANALYSIS OF PLAYERS 
          FIGURE 34 REVENUE ANALYSIS OF KEY PLAYERS
    9.3 MARKET SHARE ANALYSIS 
          FIGURE 35 SHARE OF TOP COMPANIES IN PLATE & TUBE HEAT EXCHANGER MARKET
          TABLE 151 PLATE & TUBE HEAT EXCHANGER MARKET: DEGREE OF COMPETITION
    9.4 COMPANY EVALUATION MATRIX, 2022 (TIER 1) 
           9.4.1 STARS
           9.4.2 EMERGING LEADERS
           9.4.3 PERVASIVE PLAYERS
           9.4.4 PARTICIPANTS
                    FIGURE 36 PLATE & TUBE HEAT EXCHANGER MARKET: COMPANY EVALUATION  MATRIX, 2022
           9.4.5 COMPANY FOOTPRINT
                    TABLE 152 COMPANY END-USE INDUSTRY FOOTPRINT
                    TABLE 153 COMPANY REGION FOOTPRINT
                    FIGURE 37 PRODUCT FOOTPRINT
                    TABLE 154 COMPANY FOOTPRINT
    9.5 START-UP/SME EVALUATION MATRIX 
           9.5.1 PROGRESSIVE COMPANIES
           9.5.2 RESPONSIVE COMPANIES
           9.5.3 DYNAMIC COMPANIES
           9.5.4 STARTING BLOCKS
                    FIGURE 38 PLATE & TUBE HEAT EXCHANGER MARKET: START-UPS AND SMES MATRIX, 2022
           9.5.5 COMPETITIVE BENCHMARKING
                    TABLE 155 DETAILED LIST OF COMPANIES
                    TABLE 156 PLATE & TUBE HEAT EXCHANGER MARKET: COMPETITIVE BENCHMARKING OF KEY START-UPS/SMES
    9.6 COMPETITIVE SCENARIO AND TRENDS 
           9.6.1 DEALS
                    TABLE 157 PRODUCT LAUNCH, 2018–2023
                    TABLE 158 DEALS, 2018–2023
           9.6.2 OTHER DEVELOPMENTS
                    TABLE 159 OTHER DEVELOPMENTS, 2018–2023
 
10 COMPANY PROFILES (Page No. - 163)
(Business overview, Products/Services/Solutions offered, Recent Developments, MNM view)*
     10.1 KEY PLAYERS 
             10.1.1 ALFA LAVAL
                        TABLE 160 ALFA LAVAL: COMPANY OVERVIEW
                        FIGURE 39 ALFA LAVAL: COMPANY SNAPSHOT
                        TABLE 161 ALFA LAVAL: PRODUCTS OFFERED
                        TABLE 162 ALFA LAVAL: PRODUCT LAUNCH
                        TABLE 163 ALFA LAVAL: DEALS
             10.1.2 KELVION HOLDING GMBH
                        TABLE 164 KELVION HOLDING GMBH: COMPANY OVERVIEW
                        TABLE 165 KELVION HOLDING GMBH: PRODUCTS OFFERED
                        TABLE 166 KELVION HOLDING GMBH: PRODUCT LAUNCH
                        TABLE 167 KELVION HOLDING GMBH: DEALS
                        TABLE 168 KELVION HOLDING GMBH: OTHERS
             10.1.3 DANFOSS
                        TABLE 169 DANFOSS: COMPANY OVERVIEW
                        FIGURE 40 DANFOSS: COMPANY SNAPSHOT
                        TABLE 170 DANFOSS: PRODUCTS OFFERED
                        TABLE 171 DANFOSS: OTHERS
             10.1.4 SPX FLOW
                        TABLE 172 SPX FLOW: COMPANY OVERVIEW
                        TABLE 173 SPX FLOW: PRODUCTS OFFERED
             10.1.5 API HEAT TRANSFER
                        TABLE 174 API HEAT TRANSFER: COMPANY OVERVIEW
                        TABLE 175 API HEAT TRANSFER: PRODUCTS OFFERED
             10.1.6 HRS HEAT EXCHANGER
                        TABLE 176 HRS HEAT EXCHANGER: COMPANY OVERVIEW
                        TABLE 177 HRS HEAT EXCHANGER: PRODUCTS OFFERED
                        TABLE 178 HRS HEAT EXCHANGER: PRODUCT LAUNCH
                        TABLE 179 HRS HEAT EXCHANGER: DEALS
             10.1.7 HFM PLATE HEAT EXCHANGER
                        TABLE 180 HFM PLATE HEAT EXCHANGER: COMPANY OVERVIEW
                        TABLE 181 HFM PLATE HEAT EXCHANGER: PRODUCTS OFFERED
             10.1.8 XYLEM
                        TABLE 182 XYLEM: COMPANY OVERVIEW
                        FIGURE 41 XYLEM: COMPANY SNAPSHOT
                        TABLE 183 XYLEM: PRODUCTS OFFERED
             10.1.9 WABTEC CORPORATION
                        TABLE 184 WABTEC CORPORATION: COMPANY OVERVIEW
                        FIGURE 42 WABTEC CORPORATION: COMPANY SNAPSHOT
                        TABLE 185 WABTEC CORPORATION: PRODUCTS OFFERED
                        TABLE 186 WABTEC CORPORATION: DEALS
             10.1.10 THERMEX
                        TABLE 187 THERMEX: COMPANY OVERVIEW
                        TABLE 188 THERMEX: PRODUCTS OFFERED
     10.2 OTHER KEY PLAYERS 
             10.2.1 TRANTER
                        TABLE 189 TRANTER: COMPANY OVERVIEW
             10.2.2 AIR PRODUCTS
                        TABLE 190 AIR PRODUCTS: COMPANY OVERVIEW
             10.2.3 BARRIQUAND TECHNOLOGIES THERMIQUES
                        TABLE 191 BARRIQUAND TECHNOLOGIES THERMIQUES: COMPANY OVERVIEW
             10.2.4 VAHTERUS
                        TABLE 192 VAHTERUS: COMPANY OVERVIEW
             10.2.5 GEURTS HEATEXCHANGERS B.V.
                        TABLE 193 GEURTS HEATEXCHANGERS B.V.: COMPANY OVERVIEW
             10.2.6 UK EXCHANGERS LIMITED
                        TABLE 194 UK EXCHANGERS LIMITED: COMPANY OVERVIEW
             10.2.7 ELANCO
                        TABLE 195 ELANCO: COMPANY OVERVIEW
             10.2.8 KNM GROUP
                        TABLE 196 KNM GROUP: COMPANY OVERVIEW
             10.2.9 MASON MANUFACTURING
                        TABLE 197 MASON MANUFACTURING: COMPANY OVERVIEW
             10.2.10 TINITA ENGINEERING
                        TABLE 198 TINITA ENGINEERING: COMPANY OVERVIEW
             10.2.11 UNITED HEAT EXCHANGER
                        TABLE 199 UNITED HEAT EXCHANGER: COMPANY OVERVIEW
             10.2.12 GESMEX EXCHANGERS GMBH
                        TABLE 200 GESMEX EXCHANGERS GMBH: COMPANY OVERVIEW
             10.2.13 PRECISION EQUIPMENTS
                        TABLE 201 PRECISION EQUIPMENTS: COMPANY OVERVIEW
             10.2.14 SHANDONG WINTECH TECHNOLOGY CO., LTD.
                        TABLE 202 SHANDONG WINTECH TECHNOLOGY CO., LTD.: COMPANY OVERVIEW
             10.2.15 TRANP ENERGY EQUIPMENT CO., LTD
                        TABLE 203 TRANP ENERGY EQUIPMENT CO., LTD.: COMPANY OVERVIEW
 
*Details on Business overview, Products/Services/Solutions offered, Recent Developments, MNM view might not be captured in case of unlisted companies.
 
11 APPENDIX (Page No. - 196)
     11.1 DISCUSSION GUIDE 
     11.2 KNOWLEDGESTORE: MARKETSANDMARKETS’  SUBSCRIPTION PORTAL 
     11.3 CUSTOMIZATION OPTIONS 
     11.4 RELATED REPORTS 
     11.5 AUTHOR DETAILS 

The study involved four major activities in estimating the market size of the plate and tube heat exchanger market. Exhaustive secondary research was done to collect information on the market, the peer market, and the parent market. The next step was to validate these findings, assumptions, and sizing with industry experts across the value chain through primary research. Both top-down and bottom-up approaches were employed to estimate the complete market size. Thereafter, the market breakdown and data triangulation procedures were used to estimate the market size of the segments and subsegments.

Secondary Research

In the secondary research process, various secondary sources have been referred to for identifying and collecting information for this study. These secondary sources include annual reports, press releases, investor presentations of companies, white papers, certified publications, trade directories, certified publications, articles from recognized authors, gold standard and silver standard websites, and databases.

Secondary research has been used to obtain key information about the value chain of the industry, monetary chain of the market, the total pool of key players, market classification and segmentation according to industry trends to the bottom-most level, and regional markets. It was also used to obtain information about the key developments from a market-oriented perspective.

Primary Research

The plate and tube heat exchanger market comprises several stakeholders in the value chain, which include raw material suppliers, manufacturers, and end users. Various primary sources from the supply and demand sides of the plate and tube heat exchanger market have been interviewed to obtain qualitative and quantitative information. The primary interviewees from the demand side include key opinion leaders in end-use sectors. The primary sources from the supply side include manufacturers, associations, and institutions involved in the plate and tube heat exchanger industry.

Primary interviews were conducted to gather insights such as market statistics, data of revenue collected from the products and services, market breakdowns, market size estimations, market forecasting, and data triangulation. Primary research also helped in understanding the various trends related to technology, raw material, application type, end-use industries, and region. Stakeholders from the demand side, such as CIOs, CTOs, and CSOs were interviewed to understand the buyer’s perspective on the suppliers, products, component providers, and their current usage of plate and tube heat exchanger and outlook of their business which will affect the overall market.

The breakdown of profiles of the primary interviewees is illustrated in the figure below:
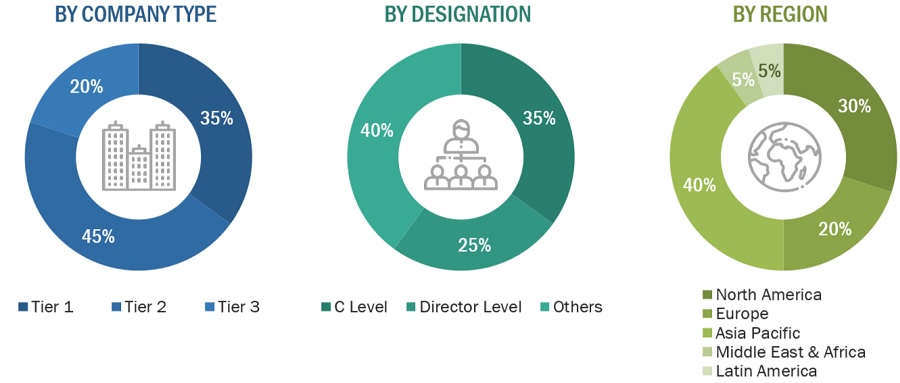
Plate and Tube Heat  Exchanger Market Size, and Share

Note: Tier 1, Tier 2, and Tier 3 companies are classified based on their market revenue in 2022 available in the public domain, product portfolios, and geographical presence.

Other designations include consultants and sales, marketing, and procurement managers.

To know about the assumptions considered for the study, download the pdf brochure

Company Name

Designation

Alfa Laval

Individual Industry Expert

Kelvion Holding GmbH

Sales Manager

Xylem

Director

API Heat Transfer

Marketing Manager

HRS Heat Exchanger

R&D Manager


Market Size Estimation

The top-down and bottom-up approaches have been used to estimate and validate the size of the plate and tube heat exchanger  market.

  • The key players in the industry have been identified through extensive secondary research.
  • The supply chain of the industry has been determined through primary and secondary research.
  • All percentage shares, splits, and breakdowns have been determined using secondary sources and verified through primary sources.
  • All possible parameters that affect the markets covered in this research study have been accounted for, viewed in extensive detail, verified through primary research, and analyzed to obtain the final quantitative and qualitative data.
  • The research includes the study of reports, reviews, and newsletters of the key market players, along with extensive interviews for opinions with leaders such as directors and marketing executives.

Plate And Tube Heat Exchanger Market: Bottum-Up Approach

Plate and Tube Heat  Exchanger Market Size, and Share

Note: All the shares are based on the global market size.

Source: Secondary Research, Interviews with Experts, and MarketsandMarkets Analysis

To know about the assumptions considered for the study, Request for Free Sample Report

Plate And Tube Heat Exchanger Market: Top-Down Approach

Plate and Tube Heat  Exchanger Market Size, and Share

Data Triangulation

After arriving at the total market size from the estimation process explained above, the overall market has been split into several segments and sub-segments. To complete the overall market engineering process and arrive at the exact statistics for all the segments and sub-segments, the data triangulation and market breakdown procedures have been employed, wherever applicable. The data has been triangulated by studying various factors and trends from both the demand and supply sides. Along with this, the market size has been validated by using both the top-down and bottom-up approaches and primary interviews. Hence, for every data segment, there have been three sources—top-down approach, bottom-up approach, and expert interviews. The data was assumed correct when the values arrived from the three sources matched.

Market Definition

A plate and tube heat exchanger is a specialized heat transfer device that combines multiple heat exchange techniques or materials within a single unit to optimize efficiency, adaptability, and performance in various industrial applications. These heat exchangers typically integrate different heat transfer mechanisms, such as tube-and-fin configurations, enhanced surfaces, phase-change materials, or multiple materials like stainless steel and titanium alloys, to cater to specific industrial needs, maximize heat transfer rates, and minimize energy consumption.

Key Stakeholders

  • Senior Management
  • End User
  • Finance/Procurement Department
  • R&D Department

Report Objectives

  • To define, describe, and forecast the size of the plate and tube heat exchanger market, in terms of value and volume.
  • To provide detailed information regarding the major factors (drivers, opportunities, restraints, and challenges) influencing the growth of the market
  • To estimate and forecast the market size based on material type, end-use industry and region.
  • To forecast the size of the market with respect to major regions, namely, Europe, North America, Asia Pacific, Middle East & Africa, and South America, along with their key countries
  • To strategically analyze micromarkets1 with respect to individual growth trends, prospects, and their contribution to the overall market
  • To analyze opportunities in the market for stakeholders and provide a competitive landscape of market leaders.
  • To track and analyze recent developments such as expansions, new product launches, partnerships & agreements, and acquisitions in the market.
  • To strategically profile key market players and comprehensively analyze their core competencies.

Available Customizations

Along with the given market data, MarketsandMarkets offers customizations according to the company’s specific needs. The following customization options are available for the report:

Regional Analysis

  • Further breakdown of a region with respect to a particular country or additional application

Company Information

  • Detailed analysis and profiles of additional market players
Custom Market Research Services

We will customize the research for you, in case the report listed above does not meet with your exact requirements. Our custom research will comprehensively cover the business information you require to help you arrive at strategic and profitable business decisions.

Request Customization
Report Code
CH 8939
Published ON
Feb, 2024
Choose License Type
BUY NOW
  • SHARE
X
Request Customization
Speak to Analyst
Speak to Analyst
OR FACE-TO-FACE MEETING
PERSONALIZE THIS RESEARCH
  • Triangulate with your Own Data
  • Get Data as per your Format and Definition
  • Gain a Deeper Dive on a Specific Application, Geography, Customer or Competitor
  • Any level of Personalization
REQUEST A FREE CUSTOMIZATION
LET US HELP YOU!
  • What are the Known and Unknown Adjacencies Impacting the Plate and Tube Heat Exchanger Market
  • What will your New Revenue Sources be?
  • Who will be your Top Customer; what will make them switch?
  • Defend your Market Share or Win Competitors
  • Get a Scorecard for Target Partners
CUSTOMIZED WORKSHOP REQUEST
+1-888-600-6441
  • Call Us
  • +1-888-600-6441 (Corporate office hours)
  • +1-888-600-6441 (US/Can toll free)
  • +44-800-368-9399 (UK office hours)
CONNECT WITH US
ABOUT TRUST ONLINE
©2024 MarketsandMarkets Research Private Ltd. All rights reserved
DMCA.com Protection Status Website Feedback