Artificial Intelligence / AI in Drug Discovery Market Size by Offering, Process (Target selection, Validation, Lead generation, optimization), Drug Design (Small molecule, Vaccine, Antibody, PK/PD), Dry Lab, Wet Lab (Single Cell analysis) & Region - Global Forecast to 2028
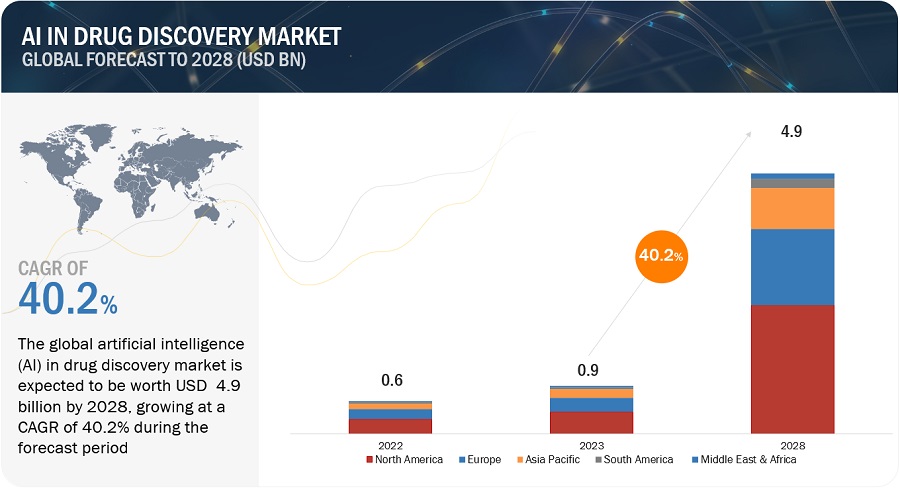
The size of global AI in drug discovery market in terms of revenue was estimated to be worth $0.9 billion in 2023 and is poised to reach $4.9 billion by 2028, growing at a CAGR of 40.2% from 2023 to 2028. The research study consists of an industry trend analysis, pricing analysis, patent analysis, conference and webinar materials, key stakeholders, and buying behaviour in the market.
The integration of Artificial Intelligence (AI) into the domain of drug discovery is poised to significantly fortify the market landscape. AI accelerates research by optimizing experiments, emphasizing impactful targets, and enabling virtual screening, leading to faster failure and diversified testing. AI can transform drug discovery workflows, consolidating steps, automating processes, reducing in-process decision-making, and accelerating property optimization in parallel. Development of epitope selection, prediction and binding tools, resulting in significant acceleration of the discovery of new vaccines and other therapeutics. However, AI algorithms may lack the nuanced understanding and creative insight that experienced researchers possess. The depth, dimensionality, and scale are often too limited for the application of AI to better characterize diseases. There may be challenges such as missing metadata on cell culture conditions or assay conditions beyond experimental outcomes and others. The use of AI raises ethical questions, particularly around data privacy, bias, and transparency in decision-making, are some of the factors expected to restrain the growth of this market in the coming years.
Attractive Opportunities in AI in Drug Discovery Market
To know about the assumptions considered for the study, Request for Free Sample Report
AI in Drug Discovery Market Dynamics
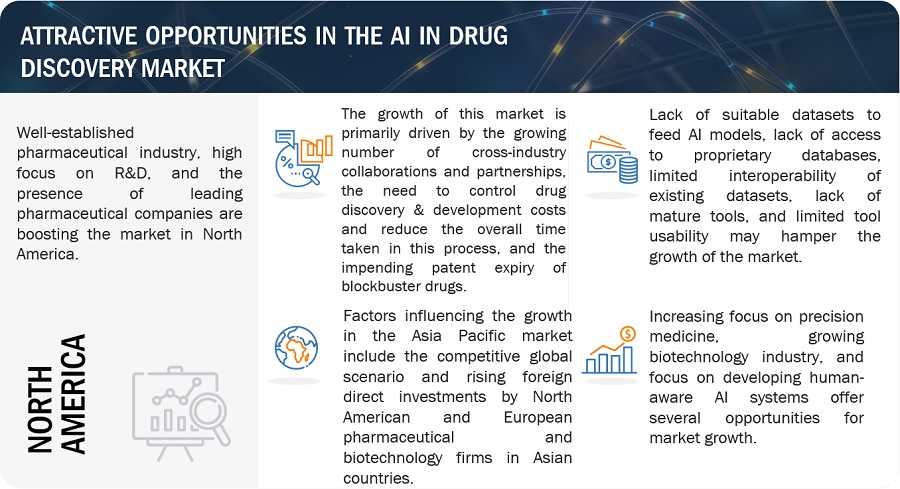
Driver: Growing need to control drug discovery & development costs and reduce time involved in drug development
Drug discovery is a very costly and lengthy process, owing to which there is a need for alternative tools for discovering new drugs. Drug discovery and development are commonly conducted through in vivo and in vitro methods, which are very costly and time-consuming. It typically takes a staggering 10–15 years and costs up to USD 2.8 billion on average, to develop a new drug, while an astonishing proportion (80–90%) of them fail in the clinic, with Phase II proof-of-concept (PoC) trials accounting for the most significant number of clinical failures. Although the number of new molecular entities (NMEs) approved by regulatory agencies, such as the US Food and Drug Administration (FDA), has increased over the past decade (2010–2019) compared with the prior decade, the cost of bringing a new drug to market has risen precipitously. The key drivers contributing to the increased cost of pharmaceutical innovation include investment lost from late-stage clinical attrition, an increasingly stringent regulatory system that sets a high bar for approval, and higher clinical trial costs, especially for pivotal trials. Given these realities, pharmaceutical and biotech companies are incentivized to innovate and adopt new technologies to improve productivity, cut costs, and ensure sustainability.
In the drug discovery process, only one out of 5,000–10,000 compounds are approved as a potential drug for a particular condition. AI in drug discovery has the potential to significantly reduce the time and costs associated with bringing new drugs to market. It can also help identify novel treatments for diseases that were previously difficult to target.
Several players operating in this market are developing platforms that can help in the rapid discovery of drugs. For instance, in May 2023 Google Cloud launched two new AI-powered solutions, the Target and Lead Identification Suite, and the Multiomics Suite, to accelerate drug discovery and precision medicine for biotech companies, pharmaceutical firms, and public sector organizations. The Target and Lead Identification Suite enables more efficient in silico drug design, predicting protein structures and accelerating lead optimization for drug discovery. The two new Google Cloud suites help address a long-standing issue in the biopharma industry: the lengthy and costly process of bringing a new medicine to the US market. Several businesses, including Big Pharma’s Pfizer have already started using the products. Simarly, in March 2023, Insilico Medicine integrated a specialized AI chat feature, ChatPandaGPT, into its PandaOmics platform. This integration enables researchers to have natural language conversations with the platform, facilitating the discovery of potential therapeutic targets and biomarkers in a more efficient manner. The new feature allows researchers to have natural language conversations with the platform and analyze large datasets to discover potential therapeutic targets and biomarkers more efficiently.
Restraint: Shortage of AI workforce and ambiguous regulatory guidelines for medical software
AI is a complex system, and for developing, managing, and implementing AI systems, companies require a workforce with certain skill sets. For instance, personnel dealing with AI systems should be aware of technologies such as cognitive computing, ML and machine intelligence, deep learning, and image recognition. Developing and deploying AI tools in drug discovery demands a blend of domain-specific expertise and data science skills. Both academia and industry face challenges due to a lack of subject matter expertise, difficulties in team formation, and organizational silos hindering collaboration. As AI becomes more integrated into large organizations, these issues may worsen, necessitating increased training and skill-building for both AI and drug discovery experts to bridge current capability gaps and support interdisciplinary teamwork in the future.
AI service providers are facing challenges regarding deploying/servicing their solutions at their customer sites. This is because of the lack of technology awareness and shortage of AI experts. Also, it is a perplexing task for any government or regulatory agency to keep up with these advancements and meaningfully guide the deployment of AI systems, especially in healthcare applications. The accuracy, reliability, security, and clinical use of medical AI technologies are ensured by subjecting them to a combination of standards and regulations. To receive FDA approval, AI or machine learning tools that have applications in healthcare must pass a series of tests to show that they can produce results at least as accurately as humans are currently able to produce. Similarly, in the European Union, there is no general exclusion for software, and software may be regulated as a medical device if it has a medical purpose. Generally, a case-by-case assessment is required, taking into account the product characteristics, mode of use, and claims made by the manufacturer. However, the assessment is particularly complex because, unlike the classification of general medical devices, it is not immediately apparent how these parameters apply to software, given that software does not act on the human body to restore, correct, or modify bodily functions
Opportunity: Emerging Markets
The Al in drug discovery market is poised for expansion, with emerging economies like India, China, and Middle Eastern nations presenting promising growth prospects. This is primarily attributed to the robust growth in their pharmaceutical and biopharmaceutical sectors, relaxed regulatory policies, and access to a skilled, cost-effective workforce. These countries are anticipated to witness a substantial surge in pharmaceutical demand due to the escalating prevalence of chronic and infectious diseases, rising income levels, and improvements in healthcare infrastructure. Consequently, these markets are highly appealing to companies facing profit margin challenges in mature markets, patent expirations of drugs, and escalating regulatory complexities. Additionally, the burgeoning interest of pharmaceutical firms in outsourcing drug discovery services, driven by the increasing demand for vaccines, diminishing antibiotic pipelines, and surging research and development expenses, further bolsters the growth of drug discovery services within emerging markets.
Challenge: Limited availability of data sets
For the use of AI and machine learning at their full potential, large sets of quality data are required to get the desired outcomes. Large data sets allow machine learning to capture patterns and generate novel hypotheses. However, in the drug discovery and development field, generating data is very expensive.
The majority of valuable data that holds significance for drug discovery is compartmentalized within pharmaceutical and CRO (clinical research organization) entities, particularly those that have accumulated exclusive data over many years. This data is usually regarded as precious, confidential resources that provide a competitive edge to these organizations. Consequently, startups and smaller companies are frequently compelled to rely on publicly accessible data, such as information from peer-reviewed reports, which may frequently be of poor quality. Therefore, it becomes difficult for SMEs to afford to make numerous molecules and conduct biological tests on the same. On the other hand, even though large pharmaceutical and biotechnology companies generate a large volume of data, most of it is protected. These companies adhere to a strict code of secrecy and do not pool or release their data with other parties. This is a key challenge in the market.
The depth, dimensionality, and scale are often too limited for the application of AI to better characterize diseases. There may be challenges such as missing metadata on cell culture conditions or assay conditions beyond experimental outcomes and others. Efforts like Ochre Bio's deep phenotyping approach for liver disease show promise but require patient samples and face scalability challenges across disease types. Moreover, proprietary datasets often contain high-quality data for a given use case (e.g., use cases pertaining to large-scale small molecule synthesis or safety and toxicity use cases), but lack of access to these datasets can significantly hinder the development of tools within academia. Tools developed in an academic setting, using publicly available data, are sometimes less accurate.
AI in Drug Discovery Market Ecosystem
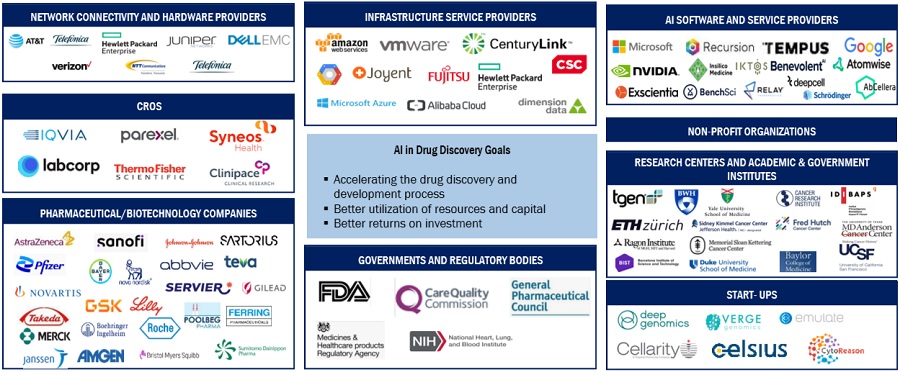
The aspects present in this market are included in the ecosystem market map of the overall artificial intelligence (AI) in drug discovery, and each element is defined with a list of the organizations involved. Products and services are included. The manufacturers of various products include the organizations involved in the entire process of research, product development, optimization, and launch. Vendors provide the services to end users either directly or through a collaboration with a third party.
In-house research facilities, contract research organizations, and contract development and manufacturing companies are all part of research and product development and are essential for outsourcing product development services.
Source: Secondary Literature, Interviews with Experts, and MarketsandMarkets Analysis
The global AI in drug discovery market is segmented by offering, technology, therapeutic area, process, use case, end user, and region.
The understanding disease segment of the AI in drug discovery industry expected to grow at the highest CAGR during the forecast period
The understanding disease segment projected to be the fastest-growing market of the global AI in drug discovery market from 2023 to 2028. AI plays a crucial role in drug discovery by identifying and validating new targets for disease treatment. It automates image analysis from phenotypic screens, mines -omics data (proteomics, genomics) to understand target-disease interactions, models protein dynamics to study target-disease pathways, and identifies biomarkers to categorize patient populations for drug research. These applications enhance the understanding of diseases and facilitate the development of more effective and targeted drug therapies. The use of AI for data mining of (-omics) data to link targets to diseases and drug repurposing applications are driving the growth of this market.
Deep learning: The largest segment of the AI in drug discovery industry for machine learning, by type
The deep learning segment expected to dominate the global AI in drug discovery market for machine learning, by type, during the forecast. Deep learning, a subset of machine learning, is distinguished by its exceptional ability to extract intricate patterns and insights from vast and complex datasets, such as genomics, proteomics, and chemical structures, crucial to drug discovery. Deep learning involves using neural networks to analyze complex biological data, predict drug interactions, and identify potential candidates. It accelerates target identification, compound screening, and clinical trial optimization, leading to faster, cost-effective drug development and more precise personalized medicine.
Infectious diseases: The largest segment of the AI in drug discovery industry, by therapeutic area
The AI in drug discovery market, by therapeutic area is categorized as oncology, infectious diseases, neurology, metabolic, cardiovascular, immunology, and other therapeutic areas. The infectious diseases accounted for the second largest share of the global market during the forecast period. Majority of the focus is concentrated in diseases where significant commercial incentives exist or with easy access to philanthropic funding. Infectious disease such as COVID-19, malaria, tuberculosis, and HIV, receive majority of the focus and funding and less interest expressed on other infectious diseases including neglected tropical diseases (NTDs).
North America is expected to account for the largest share in AI in drug discovery industry in 2022
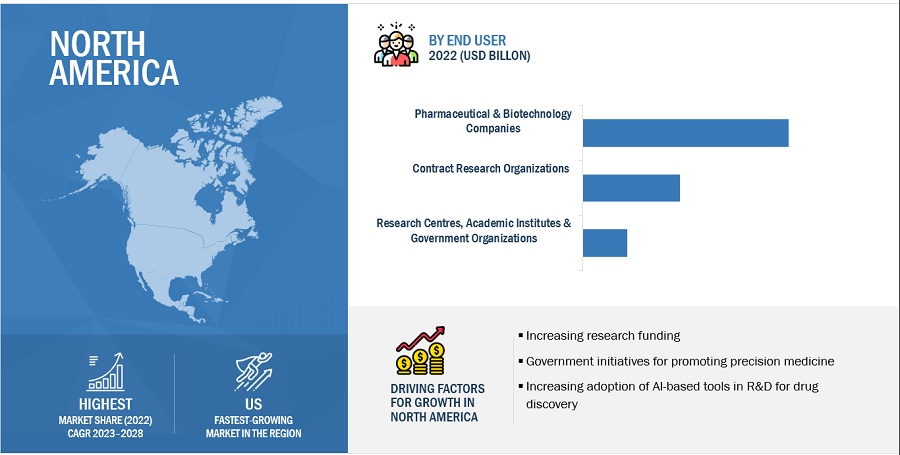
Based on region, the global market has been segmented into North America, Europe, Asia Pacific, South America, and the Middle East & Africa. In 2022, North America accounted for the largest market share followed by Europe and Asia Pacific. The large share of North America can be attributed to the increasing research funding, government initiatives for promoting precision medicine in the US, and increasing adoption of AI-based tools in R&D for drug discovery among major pharmaceutical companies in the US. The region's commitment to fostering innovation through collaborations between academia, industry, and technology providers further bolsters its position in the AI in drug discovery market.
To know about the assumptions considered for the study, download the pdf brochure
Some of the prominent players are NVIDIA Corporation (US), Exscientia (UK), BenevolentAI (UK), Recursion (US), Insilico Medicine (US), Schrödinger, Inc. (US), Microsoft Corporation (US), Google (US), Atomwise Inc. (US), Illumina, Inc. (US), NuMedii, Inc. (US), XtalPi Inc. (US), Iktos (France), Tempus Labs (US), Deep Genomics, Inc. (Canada), Verge Genomics (US), BenchSci (Canada), Insitro (US), Valo Health (US), BPGbio, Inc. (US), IQVIA Inc (US), Labcorp (US), Tencent Holdings Limited (China), Predictive Oncology, Inc. (US), Celsius Therapeutics (US), CytoReason (Israel), Owkin, Inc. (US), Cloud Pharmaceuticals (US), Evaxion Biotech (Denmark), Standigm (South Korea), BIOAGE (US), Envisagenics (US), and Aria Pharmaceuticals, Inc. (US). These players are increasingly focusing on as product launches and enhancements, investments, partnerships, collaborations, joint ventures, funding, acquisition, expansions, agreements, sales contracts, and alliances to strengthen their presence in the global market.
Scope of the AI in Drug Discovery Industry
|
Report Metric |
Details |
|
Market Revenue Size in 2023 |
$0.9 billion |
|
Projected Revenue Size by 2028 |
$4.9 billion |
|
Industry Growth Rate |
Poised to Grow at a CAGR of 40.2% |
|
Market Driver |
Growing need to control drug discovery & development costs and reduce time involved in drug development |
|
Market Opportunity |
Emerging Markets |
The study categorizes the AI in drug discovery market to forecast revenue and analyze trends in each of the following submarkets:
By Offering
- Software
- Services
By Technology
-
Machine Learning
- Deep Learning
- Supervised Learning
- Reinforcement Learning
- Unsupervised Learning
- Other Machine Learning Technologies
- Natural Language Processing
- Context-aware Processing
- Other Technologies
By Therapeutic Area
- Oncology
- Infectious Diseases
- Neurology
- Metabolic Diseases
- Cardiovascular Diseases
- Immunology
- Other Therapeutic Areas
By Process
- Target Identification & Selection
- Target Validation
- Hit Identification & Prioritization
- Hit-to-lead Identification/ Lead generation
- Lead Optimization
- Candidate Selection & Validation
By Use Cases
- Understanding Disease
- Small Molecule Design and Optimization
- Vaccine Design and Optimization
- Antibody & Other Biologics Design and Optimization
- Safety and Toxicity
By End User
- Pharmaceutical & Biotechnology Companies
- Contract Research Organizations
- Research Centers and Academic & Government Institutes
By Region
-
North America
- US
- Canada
- Mexico
-
Europe
- Germany
- UK
- France
- Italy
- Rest of Europe
-
Asia Pacific
- Japan
- China
- India
- Rest of Asia Pacific
- South America
- Middle East & Africa
Recent Developments of AI in Drug Discovery Industry
- In October 2023, Recursion, in collaboration with Roche and Genentech, achieved its first significant milestone by identifying and validating a hit series for a specific disease, triggering Roche's Small Molecule Validation Program Option. Recursion would lead the program's advancement using its Recursion OS and digital chemistry tools. This marked progress in their joint efforts to develop therapeutic programs based on Maps of Biology and Chemistry, with plans to expand to multiple CNS cell types for novel target hypotheses and partnerships in the future.
- In September 2023, Exscientia entered into a collaboration with Merck KGaA focused on the discovery of novel small molecule drug candidates across oncology, neuroinflammation and immunology. The multi-year collaboration will utilize Exscientia’s AI-driven precision drug design and discovery capabilities while leveraging Merck KGaA’s disease expertise in oncology and neuroinflammation, clinical development capabilities and global footprint.
- In May 2023, Google Cloud launched two new AI-powered solutions, the Target and Lead Identification Suite, and the Multiomics Suite, to accelerate drug discovery and precision medicine for biotech companies, pharmaceutical firms, and public sector organizations. The Target and Lead Identification Suite enables more efficient in silico drug design, predicting protein structures and accelerating lead optimization for drug discovery.
- In May 2023, 9xchange partnered with BenevolentAI. The partnership aimed to leverage BenevolentAI's AI-enabled technology to support decision-making related to indication expansion and drug repurposing for assets within the 9xchange platform. By combining BenevolentAI's proven AI-enabled engine with the 9xchange platform, the partnership aimed to uncover untapped potential in therapeutic portfolios, create new opportunities for drug discovery.
- In March 2023, NVIDIA launched the BioNeMo Cloud service, expanding its generative AI cloud offerings to aid drug discovery and research in genomics, chemistry, biology, and molecular dynamics. The BioNeMo Cloud service allows researchers to fine-tune AI applications on their proprietary data and run AI model inference in web browsers or through cloud APIs.
Frequently Asked Questions (FAQ):
What is the projected market revenue value of the global AI in drug discovery market?
The global AI in drug discovery market boasts a total revenue value of $4.9 billion by 2028.
What is the estimated growth rate (CAGR) of the global AI in drug discovery market?
The global AI in drug discovery market has an estimated compound annual growth rate (CAGR) of 40.2% and a revenue size in the region of $0.9 billion in 2023.
To speak to our analyst for a discussion on the above findings, click Speak to Analyst
This market research study involved the extensive use of secondary sources, directories, and databases to identify and collect information useful for this technical, market-oriented, and financial study of the AI in drug discovery market. In-depth interviews were conducted with various primary respondents, including key industry participants, subject-matter experts (SMEs), C-level executives of key market players, and industry consultants, among other experts, to obtain and verify critical qualitative and quantitative information and to assess market prospects. The size of the market was estimated through various secondary research approaches and triangulated with inputs from primary research to arrive at the final market size.
Secondary Research
The secondary research process involved the widespread use of secondary sources, directories, databases (such as Bloomberg Businessweek, Factiva, and D&B Hoovers), white papers, annual reports, company house documents, investor presentations, and SEC filings of companies. Some non-exclusive secondary sources include the Accreditation Council for Continuing Medical Education (ACCME), Royal College of Physicians and Surgeons of Canada (RCPSC), World Health Organization (WHO), European Accreditation Council for CME (EACCME), Agency for Healthcare Research and Quality (AHRQ), European Union of Medical Specialists (UEMS), Eurostat, The American College of Cardiology (ACC), The American Registry of Radiologic Technologists (ARRT), Expert Interviews, and MarketsandMarkets Analysis.
Secondary research was used to identify and collect information useful for the extensive, technical, market-oriented, and commercial study of the clinical decision support system market. It was also used to obtain important information about the key players and market classification and segmentation according to industry trends to the bottom-most level and key developments related to market and technology perspectives. A database of the key industry leaders was also prepared using secondary research.
Primary Research
Extensive primary research was conducted after acquiring basic knowledge about the global market scenario through secondary research. Several primary interviews were conducted with market experts from both the demand side (Purchase manager, Heads of Artificial Intelligence, Machine Learning, Drug Discovery, and Computational Molecular Design, research scientist) and supply side (such as C-level and D-level executives, technology experts, product managers, marketing and sales managers, distributors, and channel partners, among others) across five major regions—North America, Europe, the Asia Pacific, Latin America, Middle East and the Africa. Approximately 70% and 30% of primary interviews were conducted with supply-side and demand-side participants, respectively. This primary data was collected through questionnaires, e-mails, online surveys, personal interviews, and telephonic interviews.
Breakdown of Primary Interviews
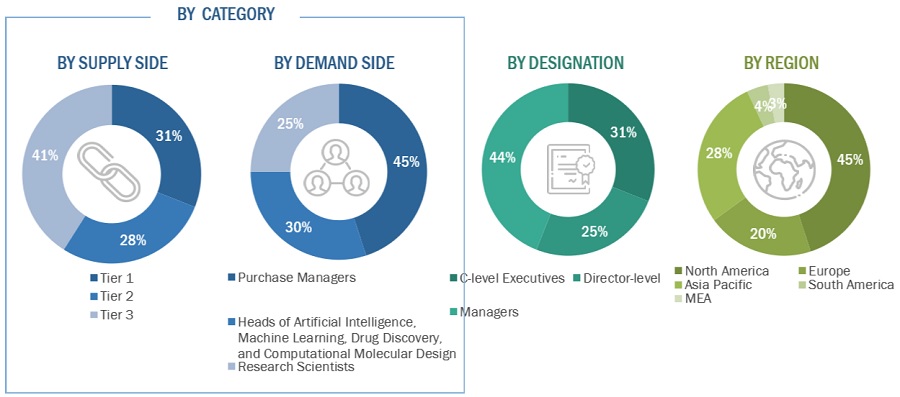
Note 1: Tiers are defined based on the total revenues of companies. As of 2022, Tier 1 = >USD 1 billion, Tier 2 = USD 500 million to USD 1 billion, and Tier 3 = <USD 500 million.
To know about the assumptions considered for the study, download the pdf brochure
Market Size Estimation
Both top-down and bottom-up approaches were used to estimate and validate the total size of the global AI in drug discovery market. These methods were also used extensively to estimate the size of various subsegments in the market. The research methodology used to estimate the market size includes the following:
- The key players in the industry and markets have been identified through extensive secondary research.
- The revenue generated from the sale of AI in drug discovery products by leading players has been determined through primary and secondary research.
- All percentage shares, splits, and breakdowns have been determined using secondary sources and verified through primary sources.
Global AI in drug discovery market: Bottom-Up Approach

To know about the assumptions considered for the study, Request for Free Sample Report
Global AI in drug discovery market: Top-Down Approach

Data Triangulation
After arriving at the overall market size, from the market size estimation process explained above, the AI in drug discovery market was split into segments and subsegments. To complete the overall market engineering process and to arrive at the exact statistics for all segments and subsegments, the data triangulation and market breakdown procedures were employed, wherever applicable. The data was triangulated by studying various factors and trends from both the demand and supply sides in the market.
Market Definition:
Artificial intelligence (AI) in drug discovery is the use of Al algorithms and techniques to improve the efficiency and effectiveness of the drug discovery process. Al can be used to automate tasks, analyze large datasets, and generate new insights that would be difficult or impossible to obtain using traditional methods. Al algorithms, particularly machine learning and deep learning models, are employed to analyze vast datasets related to genetics, molecular structures, and biological interactions. These Al systems can predict potential drug candidates, assess their safety profiles, and optimize the drug development process.
AI in drug discovery enables faster target identification and in-silico drug design. It identifies patterns in data, which allows the precise prediction about which compounds will turn out to be medicines. Al is still in its early stages of development in drug discovery, but it has the potential to revolutionize the process. By automating tasks, analyzing large datasets, and generating to discover new drugs more quickly and efficiently. Al has the potential to create significant value in drug discovery, primarily through three main drivers: time and cost savings, increased probability of success, and novelty of both the molecular target and optimized therapeutic agent.
Key Stakeholders:
- Artificial intelligence (AI) in drug discovery solution providers
- AI Platform Providers
- Technology Providers
- AI System Providers
- Platform providers
- System Integrators
- Pharmaceutical Companies
- Biotechnology Companies and Start-ups
- Drug Discovery Ventures
- Contract Development and Manufacturing Organization (CDMO)
- Contract Research Organizations
- Research Centers and Universities
- Academic Institutes
- Forums, alliances, and associations
- Distributors
- Venture capitalists
- Government organizations
- Institutional investors and investment banks
- Investors/Shareholders
- Consulting companies in the drug discovery sector and regulatory consultants
- Raw material and component manufacturers
- Hardware Manufacturers and Suppliers
- Data Providers
- Regulatory Agencies
- Healthcare Providers
- Patient Advocacy Groups
- Ethical and Legal Experts
Report Objectives
- To define, describe, and forecast the global AI in drug discovery market based on offering, therapeutic area, process, use cases, technology, end user, and region.
- To provide detailed information regarding the major factors (such as drivers, restraints, opportunities, and challenges) influencing the market growth
- To strategically analyze micromarkets with respect to individual growth trends, prospects, and contributions to the overall market
- To analyze opportunities in the market for stakeholders and provide details of the competitive landscape for market leaders.
- To strategically analyze the market structure and profile the key players of the market and comprehensively analyze their core competencies.
- To forecast the size of the market segments with respect to five regions, namely, North America, Europe, Asia Pacific, South America, and the Middle East & Africa.
- To track and analyze competitive developments such as product launches and enhancements, and investments, partnerships, collaborations, joint ventures, funding, acquisition, expansions, agreements, sales contracts, and alliances in the market during the forecast period.
Available Customizations:
With the given market data, MarketsandMarkets offers customizations as per the company’s specific needs. The following customization options are available for the report:
Geographic Analysis
- Further breakdown of the Rest of the Asia Pacific market into Singapore, Malaysia, Thailand, and Australia, and others
- Further breakdown of the Rest of Europe market into Russia, Denmark, Sweden, Finland, and other European countries


 Generating Response ...


Growth opportunities and latent adjacency in Artificial Intelligence / AI in Drug Discovery Market
Which market segment is expected to shape the future of the AI in Drug Discovery Market?
Which are the most innovative companies in AI in Drug Discovery Market?
What are the new trends and advancements in the AI in Drug Discovery Market?