Animal Genetics Market

Animal Genetics Market Size by Product (Live Animal (Poultry, Porcine, Bovine, Canine) Genetic Material (Semen (Bovine, Porcine, Equine), Embryo (Bovine, Equine)) Genetic Testing Service (Disease, Genetic Traits - Bovine, DNA Typing)) & Region - Global Forecast to 2028

Report Code: BT 3244 Aug, 2023, by marketsandmarkets.com

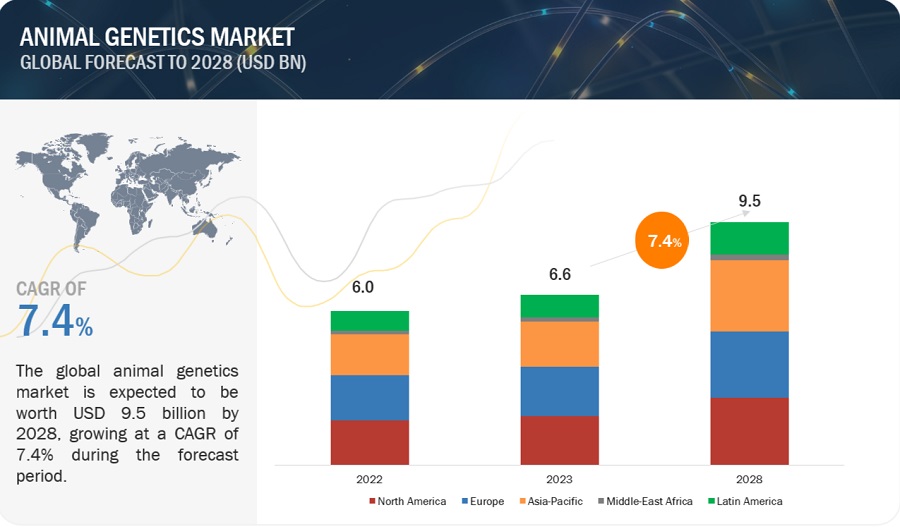
The size of global animal genetics market in terms of revenue was estimated to be worth $6.6 billion in 2023 and is poised to reach $9.5 billion by 2028, growing at a CAGR of 7.4% from 2023 to 2028. The research study consists of an industry trend analysis, pricing analysis, patent analysis, conference and webinar materials, key stakeholders, and buying behaviour in the market.

Market growth is largely driven by factors such as the increasing consumption of animal-derived protein, growing global population & rapid urbanization, growing customer awareness, growing demand for companion animals, focus on superior breeds, and an emphasis on genetic services to prevent genetic diseases & business loss. Market growth is hindered due to the emergence of alternatives to meat (such as lab-grown meat) and a shortage of professionals in veterinary research.

Attractive Opportunities in the Animal Genetics Market
Animal Genetics Market

To know about the assumptions considered for the study, Request for Free Sample Report
Animal Genetics Market

Animal Genetics Market Dynamics

Driver: Growing global population and rapid urbanization

Globally, farmers are expected to produce 70% more food to feed a population that is estimated to reach 9.6 billion by 2050, according to the UN Food and Agriculture Organization. Most of this projected growth is expected to be in developing countries. Although the global population growth is projected to stabilize during the present century, rapid population growth is expected to be one of the major challenges for achieving improvements in food security in some countries.

Furthermore, rapid urbanization in developing countries is responsible for increasing concerns regarding food security. According to the UN Department of Economic and Social Affairs, as of September 2021, approximately 55% of the global population lived in urban areas. This percentage is expected to increase to 73% by 2050 as urbanization continues to be a significant trend worldwide. Due to this trend, the consumption of animal products is expected to increase, as a large part of the population is moving from an agricultural lifestyle to an urban setting. This trend is highly evident in emerging economies such as Brazil, Russia, India, and China, where rapid urbanization drives the demand for animal food products.

To cater to the rising demand for animal proteins, livestock producers increasingly use advanced genetic approaches in animal breeding. In the dairy industry, artificial insemination is increasingly being used to increase milk production; in the porcine industry, high-quality porcine genetics are used to increase meat production. Such trends are expected to drive the demand for animal genetic products and technologies in the coming years.

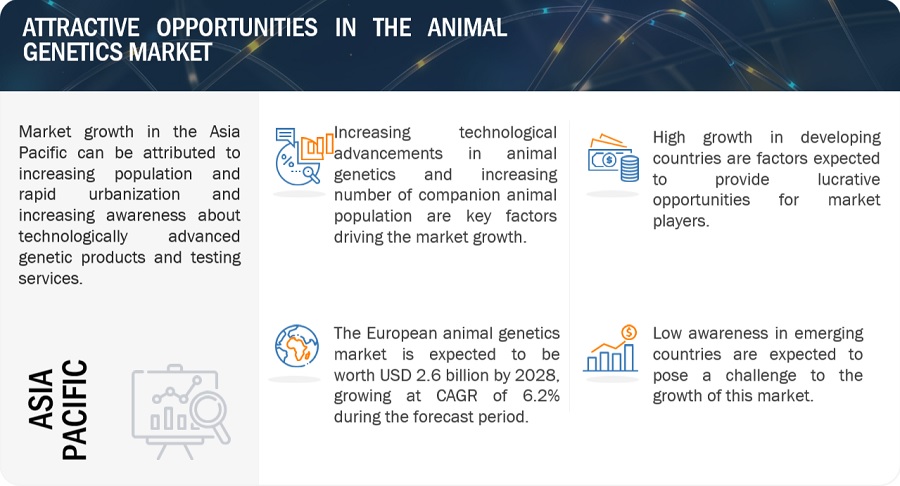
Owing to the availability of advanced genetic technologies, developed countries will continue to account for a greater share of this demand than the developing countries across Asia Pacific and Latin America. However, rapid growth in the urban population and the adoption of advanced technologies in developing countries will boost the overall animal genetics market.

Restraint: The emergence of alternative such as lab-based meat

Although the ongoing population growth and urbanization in developing countries are drivers of its increase, the per capita meat consumption is partially offset by the shift towards a demand for quality products. This includes a move towards lab-based meat. Lab-grown meat, also known as cultured or cell-based meat, is an innovative technology that involves growing animal muscle tissue in a controlled environment, rather than raising and slaughtering animals for meat production. This technology has the potential to address various challenges associated with traditional meat production, such as environmental sustainability, animal welfare, and resource consumption.

For instance, in 2020, a US-based company, namely, Eat Just, passed a safety review by the Singapore Food Agency to market and sell its lab-grown chicken bits. In 2021 and 2022, Several startups and established food companies were actively investing in and researching cultured meat technology. Moreover, changing consumer preferences and attitudes towards meat consumption concerning its impact on health, the environment, animal welfare, and global greenhouse gas emissions could also drive demand from animal-based protein. This may negatively impact the demand for animal-based protein in the long run, which in turn would thwart the adoption of animal genetics.

Opportunity: Innovations in phenotyping services

Technological developments in animal genetic testing are mainly focused on two areas—the measurement of an increasingly large array of new phenotypes and the development of systems for automatic trait measurement and recording (such as automated milk-recording systems and pedometers for ambulatory activities). For instance, for animal breeds with limited scope for improving trait measurement, new phenotype tests are being developed. Milk quality trait measurement in dairy cattle now includes not only total protein and fat content but also the measurement of sub-components like lactoferrin and fatty acids. The measurement of health-related traits is also an emerging field of phenotypic investigation, which includes indirect measures for the detection of mastitis (electrical conductivity of milk and milk mineral content), female fertility (milk hormone assays and physical activity), and traits related to the detection of lameness or metabolic syndromes.

Owing to the reduced prices of genotyping tests, trait measurement has become a major economically limiting factor in livestock selection schemes; hence, there is a growing focus on research towards large-scale automatic phenotyping. Automated milk-recording systems, pedometers (for measuring fertility and lameness), and rumination tags (for monitoring rumination time, which is related to metabolic activity and methane emissions) are gaining greater importance in animal breeding. These innovations in phenotyping technologies have emerged as powerful tools to improve herd management and breeding schemes. The greater uptake of these technologies will provide new growth avenues for players in the genetic testing services market.

Challenge: Economic sustainability in local breeds

The implementation of genetic improvement programs for local breeds requires significant investments. A lack of infrastructure in areas where local breeds are present requires huge investments to develop said infrastructure. Such investments are often given low importance due to their economic feasibility and outcomes. For instance, artificial insemination in a small population of local animal breeds has higher per dose semen costs than the same in large animal populations due to economies of scale. The cost-benefit analysis in such cases results in negative or poorer outcomes against many required investments. Considering this scenario, the growing need to improve the productivity of local breeds and improve the affordability and economic feasibility of genetic improvement programs for these breeds is one of the major challenges in the animal genetics industry.

Animal Genetics Market Ecosystem

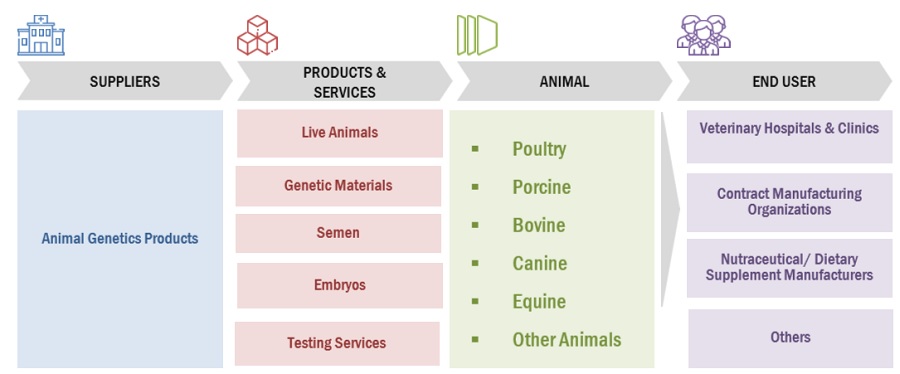
Leading players in this market include well-established and financially stable manufacturers of animal genetics. These companies have been operating in the market for several years and possess a diversified product portfolio, advanced technologies, and strong global presence. Prominent companies in animal genetics market include Neogen Corporation (US), Genus (Uk), Urus (US), EW Group Gmbh (Germany), Groupe Grimaud (France).
Animal Genetics Market Ecosystem

The genetic materials segment of the animal genetics industry is expected to register the highest CAGR during the forecast period.

The genetic materials segment of the animal genetics market is projected to grow at the highest CAGR during 2023 to 2028. This is attributed to high adoption of advanced genetic technologies such as artificial insemination, embryo transfer, and sexed semen for the large-scale production of high-yield live animals and enhanced breed quality. Genetic materials are used for animal breeding to improve the offspring’s traits. The two major genetic materials that are used for animal breeding are semen and embryos. Animal breeding using genetic materials can be done through artificial insemination, cloning, in vitro fertilization, embryo transfer, and semen sexing.

The embryos segment of the animal genetics industry is estimated to grow at a higher CAGR during the forecast period.

The embryos segment of the animal genetics market is estimated to grow at a higher CAGR during the forecast period. Embryo transfer technology is mainly used for cattle, sheep, goats, pigs, and to a smaller extent in buffaloes and camels. Significant growth has been observed in bovine embryo transfer in recent years. Embryo transfer in the bovine industry has recently gained considerable popularity with seed stock and beef producers. It has profited from technologies such as IVF, ultrasonography, and genomics. Producers use embryo transfer programs to increase the flock numbers of genetically elite animals.

APAC is estimated to be the fastest-growing regional market for animal genetics industry.

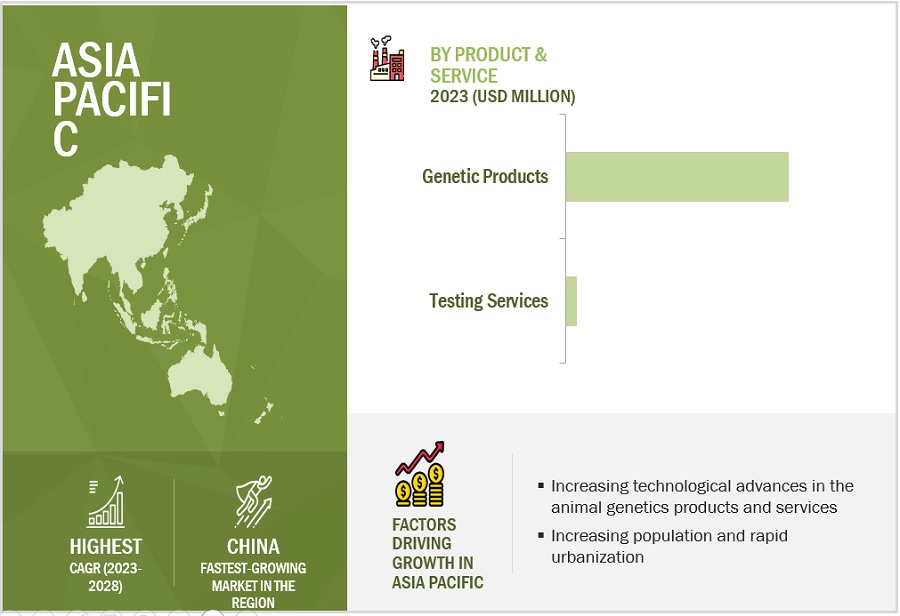
The global animal genetics market is segmented into North America, Europe, Asia Pacific, Latin America, and the Middle East & Africa. In 2022, APAC is estimated to be the fastest-growing regional market for animal genetics. The high growth in this market can majorly be attributed to the rapid urbanization and rising per capita income and increasing per capita spending on animal care. Some of the major players in the Asia Pacific market are ABS Global (US), Groupe Grimaud (France), Zoetis (US), Hendrix Genetics (Netherlands), Topigs Norsvin (Netherlands), CRV Holding (Netherlands), and Neogen (US).
Animal Genetics Market by Region

To know about the assumptions considered for the study, download the pdf brochure

The animal genetics market is dominated by a few globally established players such as Neogen Corporation (US), Genus (Uk), Urus (US), EW Group Gmbh (Germany), Groupe Grimaud (France). Major players adopt growth strategies to expand their geographical presence and garner higher shares in the global market, such as product launches and approvals, expansions, collaborations, and acquisitions.

Scope of the Animal Genetics Industry

Report Metric

Details

Market Revenue Size in 2023

$6.6 billion

Projected Revenue Size by 2028

$9.5 billion

Industry Growth Rate

Poised to Grow at a CAGR of 7.4%

Market Driver

Growing global population and rapid urbanization

Market Opportunity

Innovations in phenotyping services

The study categorizes the animal genetics market to forecast revenue and analyze trends in each of the following submarkets:

By Product & Service
  • Animal Genetic Products
    • Live Animals
      • Poultry
      • Porcine
      • Bovine
      • Canine
      • Other live animals
    • Genetic Materials
      • Semen
        • Bovine
        • Porcine
        • Equine
        • Canine
        • other animal semen
      • Embryos
        • Bovine
        • Equine
        • Other animal embryos
  • Animal Genetic Testing Services
    • Genetic Disease Tests
    • Genetic Trait Tests
      • Bovine
      • Other animal genetic trait tests
    • DNA Typing
    • Other services
By Region
  • North America
    • US
    • Canada
  • Europe
    • France
    • Germany
    • UK
    • Spain
    • Italy
    • Netherlands
    • Rest of Europe
  • Asia Pacific
    • China
    • India
    • Japan
    • Australia
    • South Korea
    • Rest of Asia Pacific
  • Latin America
    • Brazil
    • Mexico
    • Rest Of Latin America
  • Middle East & Africa

Recent Developments of Animal Genetics Industry

  • In March 2023, URUS Group collaborated with Genetics Australia. The JV will be 60 percent owned by URUS and 40 percent owned by Genetics Australia (GA). It will have access to the full suite of GENEX products and access to the PEAK program.
  • In January 2023, Zoetis collaborated with VAS to give farmers better compatibility crossover between Vas's PULSE platform, a broad farm management cloud-based software, and DairyComp, a herd health system with Zoetis's CLARIFIDE genetic and fertility testing.

Frequently Asked Questions (FAQ):

To speak to our analyst for a discussion on the above findings, click Speak to Analyst

TABLE OF CONTENTS
 
1 INTRODUCTION (Page No. - 36)
    1.1 STUDY OBJECTIVES 
    1.2 MARKET DEFINITION 
           1.2.1 INCLUSIONS AND EXCLUSIONS
    1.3 MARKET SCOPE 
          FIGURE 1 ANIMAL GENETICS MARKET SEGMENTATION
           1.3.1 YEARS CONSIDERED
           1.3.2 CURRENCY CONSIDERED
                    TABLE 1 CURRENCY CONVERSION RATES, 2020–2022
    1.4 STAKEHOLDERS 
    1.5 SUMMARY OF CHANGES 
    1.6 RECESSION IMPACT 
 
2 RESEARCH METHODOLOGY (Page No. - 40)
    2.1 ANIMAL GENETIC PRODUCTS MARKET: RESEARCH DATA 
          FIGURE 2 RESEARCH DESIGN
           2.1.1 SECONDARY DATA
                    2.1.1.1 Key data from secondary sources
           2.1.2 PRIMARY DATA
                    FIGURE 3 PRIMARY SOURCES
                    2.1.2.1 Key data from primary sources
                    2.1.2.2 Key industry insights
                                FIGURE 4 PARTICIPANTS FOR PRIMARY INTERVIEWS
                                FIGURE 5 BREAKDOWN OF PRIMARY INTERVIEWS: BY COMPANY TYPE, DESIGNATION,  AND REGION
    2.2 MARKET SIZE ESTIMATION 
          FIGURE 6 SUPPLY-SIDE MARKET SIZE ESTIMATION
          FIGURE 7 REVENUE SHARE ANALYSIS
          FIGURE 8 PROJECTED CAGR ANALYSIS OF DRIVERS, RESTRAINTS, OPPORTUNITIES, AND CHALLENGES (2023–2028)
          FIGURE 9 CAGR PROJECTIONS: SUPPLY-SIDE ANALYSIS
    2.3 MARKET BREAKDOWN AND DATA TRIANGULATION 
          FIGURE 10 DATA TRIANGULATION
    2.4 MARKET SHARE ESTIMATION 
    2.5 RESEARCH ASSUMPTIONS 
          TABLE 2 ASSUMPTIONS
    2.6 RISK ANALYSIS 
          TABLE 3 RISK ASSESSMENT
    2.7 RESEARCH LIMITATIONS 
           2.7.1 METHODOLOGY-RELATED LIMITATIONS
    2.8 IMPACT OF RECESSION 
 
3 EXECUTIVE SUMMARY (Page No. - 52)
    FIGURE 11 ANIMAL GENETICS MARKET SHARE, BY TYPE, 2023 VS. 2028 (USD MILLION)
    FIGURE 12 ANIMAL GENETIC PRODUCTS MARKET, BY TYPE, 2023 VS. 2028 (USD MILLION)
    FIGURE 13 LIVE ANIMALS MARKET, BY TYPE, 2023 VS. 2028 (USD MILLION)
    FIGURE 14 SEMEN MARKET, BY TYPE, 2023 VS. 2028 (USD MILLION)
    FIGURE 15 EMBRYO MARKET, BY TYPE, 2023 VS. 2028 (USD MILLION)
    FIGURE 16 ANIMAL GENETIC TESTING SERVICES MARKET, BY TYPE,  2023 VS. 2028 (USD MILLION)
    FIGURE 17 REGIONAL SNAPSHOT OF ANIMAL GENETICS INDUSTRY, 2022
 
4 PREMIUM INSIGHTS (Page No. - 57)
    4.1 GROWTH POTENTIAL OF ANIMAL GENETICS MARKET 
          FIGURE 18 RISING CONSUMPTION OF ANIMAL-DERIVED PROTEIN
    4.2 ASIA PACIFIC MARKET, BY PRODUCT & SERVICE AND COUNTRY 
          FIGURE 19 LIVE ANIMALS SEGMENT AND CHINA ACCOUNTED FOR LARGEST SHARES  OF ASIA PACIFIC MARKET IN 2022
    4.3 MARKET: REGIONAL GROWTH OPPORTUNITIES 
          FIGURE 20 CHINA TO REGISTER HIGHEST CAGR DURING FORECAST PERIOD
    4.4 ANIMAL GENETICS MARKET PREDICTION: REGIONAL MIX (2021–2028) 
          FIGURE 21 EUROPE TO DOMINATE MARKET DURING FORECAST PERIOD
    4.5 ANIMAL GENETICS MARKET PREDICTION: DEVELOPED VS. DEVELOPING MARKETS (USD MILLION) 
          FIGURE 22 DEVELOPING MARKETS TO REGISTER HIGHER GROWTH RATE  DURING FORECAST PERIOD
 
5 MARKET OVERVIEW (Page No. - 61)
    5.1 INTRODUCTION 
    5.2 MARKET DYNAMICS 
          FIGURE 23 ANIMAL GENETICS MARKET SHARE: DRIVERS, RESTRAINTS,  OPPORTUNITIES, AND CHALLENGES
           5.2.1 DRIVERS
                    5.2.1.1 Increasing consumption of animal-derived protein and dairy products
                                TABLE 4 TRENDS IN DEVELOPING AND DEVELOPED COUNTRIES: MILK POWDER PRODUCTION, 2020–2029
                                TABLE 5 TRENDS IN DEVELOPING AND DEVELOPED COUNTRIES: PER CAPITA CONSUMPTION OF MEAT, 2020–2029
                    5.2.1.2 Growing global population and rapid urbanization
                                TABLE 6 GLOBAL URBAN POPULATION GROWTH, 2020–2050
                    5.2.1.3 Growing awareness regarding animal health and benefits of animal genetic tests and products
                    5.2.1.4 Rising adoption of companion animals
                    5.2.1.5 Prevention of genetic diseases through advanced genetic services
                    5.2.1.6 Development of innovative technologies related to animal genetics
           5.2.2 RESTRAINTS
                    5.2.2.1 Emergence of lab-based meat
           5.2.3 OPPORTUNITIES
                    5.2.3.1 Untapped market potential in developing countries
                    5.2.3.2 Innovations in phenotyping services
                    5.2.3.3 Increasing investments in organic growth strategies and research & development
           5.2.4 CHALLENGES
                    5.2.4.1 Growing need for breeding programs to improve economic performance
                    5.2.4.2 Economic sustainability in local breeds
                    5.2.4.3 Outbreak of African Swine Fever in China
                    5.2.4.4 Shortage of skilled professionals in veterinary research
 
6 INDUSTRY INSIGHTS (Page No. - 71)
    6.1 INTRODUCTION 
    6.2 INDUSTRY TRENDS 
           6.2.1 GOVERNMENT-LED FUNDING FOR RESEARCH & DEVELOPMENT
           6.2.2 RISING RESEARCH COLLABORATIONS AND PARTNERSHIPS
           6.2.3 CHANGING DYNAMICS IN CHINESE PORCINE MARKET
           6.2.4 USE OF ARTIFICIAL INTELLIGENCE IN ANIMAL BREEDING AND TESTING
           6.2.5 INTRODUCTION OF GENETICALLY MODIFIED DISEASE-RESISTANT ANIMALS
    6.3 STRATEGIC BENCHMARKING 
           6.3.1 INCREASED FOCUS ON VARIOUS GROWTH STRATEGIES
    6.4 LIVESTOCK BREEDING PROGRAMS, BY REGION 
          TABLE 7 FOCUS OF BREEDING PROGRAMS ON MAJOR LIVESTOCK SPECIES, BY REGION
          TABLE 8 PRESENCE OF BREEDING PROGRAMS FOR MAJOR LIVESTOCK SPECIES, BY REGION
    6.5 TECHNOLOGY ANALYSIS 
          TABLE 9 INTENSITY OF UTILIZATION OF VARIOUS GENETIC TECHNOLOGIES, BY REGION
           6.5.1 GENE EDITING
           6.5.2 PRECISION PHENOTYPING
           6.5.3 ARTIFICIAL INTELLIGENCE
    6.6 INDICATIVE PRICING MODEL ANALYSIS 
          TABLE 10 AVERAGE SELLING PRICE OF LIVE ANIMALS AND GENETIC PRODUCTS
           6.6.1 AVERAGE SELLING PRICE TRENDS
    6.7 ANIMAL GENETICS MARKET SHARE, BY ANIMAL TYPE 
    6.8 PORTER’S FIVE FORCES ANALYSIS 
          TABLE 11 PORTER’S FIVE FORCES ANALYSIS
           6.8.1 THREAT OF NEW ENTRANTS
           6.8.2 THREAT OF SUBSTITUTES
           6.8.3 BARGAINING POWER OF SUPPLIERS
           6.8.4 BARGAINING POWER OF BUYERS
           6.8.5 INTENSITY OF COMPETITIVE RIVALRY
    6.9 VALUE CHAIN ANALYSIS 
    6.10 SUPPLY CHAIN ANALYSIS 
           6.10.1 SUPPLY CHAIN OF MARKET
                     FIGURE 25 MARKET: SUPPLY CHAIN ANALYSIS
    6.11 ECOSYSTEM MAPPING 
          FIGURE 26 MARKET: ECOSYSTEM ANALYSIS
    6.12 PATENT ANALYSIS 
           6.12.1 PATENT PUBLICATION TRENDS FOR MARKET
                     FIGURE 27 PATENT PUBLICATION TRENDS FOR ANIMAL GENETICS (2017–2023)
           6.12.2 TOP APPLICANTS (COMPANIES/INSTITUTIONS)  FOR ANIMAL GENETICS
                     FIGURE 28 TOP APPLICANTS (COMPANIES/INSTITUTIONS) FOR ANIMAL  GENETICS PATENTS (2017–2023)
           6.12.3 TOP INVENTORS IN MARKET
           6.12.4 JURISDICTION ANALYSIS: TOP APPLICANTS (COUNTRIES) FOR ANIMAL GENETICS PATENTS
           6.12.5 TRADE ANALYSIS
                     TABLE 12 IMPORT OF LIVE BOVINES, BY REGION, 2018–2022 (USD BILLION)
                     TABLE 13 IMPORT OF LIVE SWINE, BY REGION, 2018–2022 (USD MILLION)
                     TABLE 14 IMPORT OF LIVE SHEEP AND GOATS, BY REGION, 2018–2022 (USD MILLION)
                     TABLE 15 IMPORT OF LIVE POULTRY, BY REGION, 2018–2022 (USD MILLION)
                     TABLE 16 IMPORT OF LIVE HORSES, ASSES, MULES, AND HINNIES, BY REGION,  2018–2022 (USD MILLION)
                     TABLE 17 EXPORT OF LIVE BOVINES, BY REGION, 2018–2022 (USD MILLION)
                     TABLE 18 EXPORT OF LIVE SWINE, BY REGION, 2018–2022 (USD MILLION)
                     TABLE 19 EXPORT OF LIVE SHEEP AND GOATS, BY REGION, 2018–2022 (USD MILLION)
                     TABLE 20 EXPORT OF LIVE POULTRY, BY REGION, 2018–2022 (USD MILLION)
                     TABLE 21 EXPORT OF LIVE HORSES, ASSES, MULES, AND HINNIES, BY REGION,  2018–2022 (USD MILLION)
    6.13 KEY CONFERENCES AND EVENTS, 2023–2024 
           TABLE 22 KEY CONFERENCES AND EVENTS, 2023–2024
    6.14 REGULATORY LANDSCAPE 
           6.14.1 REGULATORY ANALYSIS
                    6.14.1.1 US
                    6.14.1.2 Europe
           6.14.2 REGULATORY BODIES, GOVERNMENT AGENCIES,  AND OTHER ORGANIZATIONS
                    6.14.2.1 North America
                     TABLE 23 NORTH AMERICA: LIST OF REGULATORY BODIES, GOVERNMENT AGENCIES,  AND OTHER ORGANIZATIONS
                    6.14.2.2 Europe
                     TABLE 24 EUROPE: LIST OF REGULATORY BODIES, GOVERNMENT AGENCIES,  AND OTHER ORGANIZATIONS
                    6.14.2.3 Rest of the world (ROW)
                     TABLE 25 REST OF THE WORLD: LIST OF REGULATORY BODIES, GOVERNMENT AGENCIES,  AND OTHER ORGANIZATIONS
    6.15 KEY STAKEHOLDERS AND BUYING CRITERIA 
           6.15.1 KEY STAKEHOLDERS IN BUYING PROCESS
                     FIGURE 31 INFLUENCE OF STAKEHOLDERS ON BUYING PROCESS FOR ANIMAL GENETIC PRODUCTS
                     TABLE 26 INFLUENCE OF STAKEHOLDERS ON BUYING PROCESS OF ANIMAL GENETIC PRODUCTS AND SERVICES
           6.15.2 BUYING CRITERIA
                     FIGURE 32 KEY BUYING CRITERIA FOR ANIMAL GENETIC PRODUCTS AND SERVICES
                     TABLE 27 KEY BUYING CRITERIA FOR ANIMAL GENETIC PRODUCTS AND SERVICES
    6.16 CASE STUDY ANALYSIS 
           TABLE 28 ESTIMATING MARKET SIZE AND SHARE OF ANIMAL GENETIC PRODUCTS  AT COUNTRY LEVEL
           TABLE 29 ESTIMATING MARKET SIZE AND SHARE OF ANIMAL GENETIC TESTING SERVICES AT COUNTRY LEVEL
 
7 ANIMAL GENETICS MARKET, BY PRODUCT & SERVICE (Page No. - 101)
    7.1 INTRODUCTION 
          TABLE 30 ANIMAL GENETICS INDUSTRY, BY PRODUCT & SERVICE, 2021–2028 (USD MILLION)
    7.2 ANIMAL GENETIC PRODUCTS 
          TABLE 31 ANIMAL GENETIC PRODUCTS MARKET, BY TYPE, 2021–2028 (USD MILLION)
          TABLE 32 ANIMAL GENETIC PRODUCTS MARKET, BY COUNTRY/REGION,  2021–2028 (USD MILLION)
           7.2.1 LIVE ANIMALS
                    TABLE 33 LIVE ANIMALS MARKET, BY TYPE, 2021–2028 (USD MILLION)
                    TABLE 34 LIVE ANIMALS MARKET, BY COUNTRY/REGION, 2021–2028 (USD MILLION)
                    7.2.1.1 Poultry
                               7.2.1.1.1 Increasing consumption of poultry meat across globe to drive segmental growth
                                              TABLE 35 LIVE POULTRY MARKET: KEY PLAYER OFFERINGS
                                              TABLE 36 LIVE POULTRY MARKET, BY COUNTRY/REGION, 2021–2028 (USD MILLION)
                    7.2.1.2 Porcine
                               7.2.1.2.1 Growing pork consumption to impact global demand for live porcine
                                              TABLE 37 LIVE PORCINE MARKET: KEY PLAYER OFFERINGS
                                              TABLE 38 LIVE PORCINE MARKET, BY COUNTRY/REGION, 2021–2028 (USD MILLION)
                    7.2.1.3 Bovine
                               7.2.1.3.1 Growing trend of veganism to hamper market growth
                                              TABLE 39 LIVE BOVINE MARKET: KEY PLAYER OFFERINGS
                                              TABLE 40 LIVE BOVINE MARKET, BY COUNTRY/REGION, 2021–2028 (USD MILLION)
                    7.2.1.4 Canine
                               7.2.1.4.1 Increasing canine adoption in developing countries to support market growth
                                              TABLE 41 LIVE CANINE MARKET, BY COUNTRY/REGION, 2021–2028 (USD MILLION)
                    7.2.1.5 Other live animals
                                TABLE 42 OTHER LIVE ANIMALS MARKET, BY COUNTRY/REGION, 2021–2028 (USD MILLION)
           7.2.2 GENETIC MATERIALS
                    TABLE 43 GENETIC MATERIALS MARKET, BY TYPE, 2021–2028 (USD MILLION)
                    TABLE 44 GENETIC MATERIALS MARKET, BY COUNTRY/REGION, 2021–2028 (USD MILLION)
                    7.2.2.1 Semen
                                TABLE 45 SEMEN MARKET, BY TYPE, 2021–2028 (USD MILLION)
                                TABLE 46 SEMEN MARKET, BY COUNTRY/REGION, 2021–2028 (USD MILLION)
                               7.2.2.1.1 Bovine semen
                                             7.2.2.1.1.1 Bovine semen segment to register highest growth during study period
                                                              TABLE 47 CONVENTIONAL VS. SEXED SEMEN: EVALUATION CRITERIA
                                                              TABLE 48 BOVINE SEMEN: KEY PLAYER OFFERINGS
                                                              TABLE 49 BOVINE SEMEN MARKET, BY COUNTRY/REGION, 2021–2028 (USD MILLION)
                               7.2.2.1.2 Porcine semen
                                             7.2.2.1.2.1 Increasing use of artificial insemination in swine industry to drive market
                                                              TABLE 50 PORCINE SEMEN: KEY PLAYER OFFERINGS
                                                              TABLE 51 PORCINE SEMEN MARKET, BY COUNTRY/REGION, 2021–2028 (USD MILLION)
                               7.2.2.1.3 Equine semen
                                             7.2.2.1.3.1 Growing acceptance of artificial insemination by national and international breeding authorities across Europe and America to boost market growth
                                                              TABLE 52 EQUINE SEMEN MARKET, BY COUNTRY/REGION, 2021–2028 (USD MILLION)
                               7.2.2.1.4 Canine semen
                                             7.2.2.1.4.1 Rising adoption of dogs as companion animals to drive market
                                                              TABLE 53 CANINE SEMEN MARKET, BY COUNTRY/REGION, 2021–2028 (USD MILLION)
                               7.2.2.1.5 Other animal semen
                                              TABLE 54 OTHER ANIMAL SEMEN MARKET, BY COUNTRY/REGION, 2021–2028 (USD MILLION)
                    7.2.2.2 Embryos
                                TABLE 55 EMBRYOS MARKET, BY TYPE, 2021–2028 (USD MILLION)
                                TABLE 56 EMBRYOS MARKET, BY COUNTRY/REGION, 2021–2028 (USD MILLION)
                               7.2.2.2.1 Bovine embryos
                                             7.2.2.2.1.1 Increasing popularity of embryo transfer to identify genetically elite animals to fuel market growth
                                                               TABLE 57 BOVINE EMBRYOS MARKET, BY COUNTRY/REGION, 2021–2028 (USD MILLION)
                               7.2.2.2.2 Equine embryos
                                             7.2.2.2.2.1 Increasing embryo transfer by horse breeders to extend pregnancy term in mares to drive market
                                                               TABLE 58 EQUINE EMBRYOS MARKET, BY COUNTRY/REGION, 2021–2028 (USD MILLION)
                               7.2.2.2.3 Other animal embryos
                                              TABLE 59 OTHER ANIMAL EMBRYOS MARKET, BY COUNTRY/REGION, 2021–2028 (USD MILLION)
    7.3 ANIMAL GENETIC TESTING SERVICES 
          TABLE 60 ANIMAL GENETIC TESTING SERVICES MARKET, BY TYPE, 2021–2028 (USD MILLION)
          TABLE 61 ANIMAL GENETIC TESTING SERVICES MARKET, BY COUNTRY/REGION,  2021–2028 (USD MILLION)
           7.3.1 GENETIC DISEASE TESTS
                    7.3.1.1 Genetic disease tests segment to witness highest growth
                                TABLE 62 GENETIC DISEASE TESTING SERVICES: KEY PLAYER OFFERINGS
                                TABLE 63 GENETIC DISEASE TESTS MARKET, BY COUNTRY/REGION, 2021–2028 (USD MILLION)
           7.3.2 GENETIC TRAIT TESTS
                    TABLE 64 GENETIC TRAIT TESTING SERVICES: KEY PLAYER OFFERINGS
                    TABLE 65 GENETIC TRAIT TESTS MARKET, BY TYPE, 2021–2028 (USD MILLION)
                    TABLE 66 GENETIC TRAIT TESTS MARKET, BY COUNTRY/REGION, 2021–2028 (USD MILLION)
                    7.3.2.1 Bovine
                               7.3.2.1.1 Rising focus of breeders on ensuring high-productivity traits in herds to boost market growth
                                              TABLE 67 BOVINE GENETIC TRAIT TESTS MARKET, BY COUNTRY/REGION,  2021–2028 (USD MILLION)
                    7.3.2.2 Other animal genetic trait tests
                                TABLE 68 OTHER ANIMAL GENETIC TRAIT TESTS MARKET, BY COUNTRY, 2021–2028 (USD MILLION)
           7.3.3 DNA TYPING
                    7.3.3.1 Rising adoption of DNA parentage testing to improve genetic selection to drive market
                                TABLE 69 DNA TYPING SERVICES: KEY PLAYER OFFERINGS
                                TABLE 70 DNA TYPING MARKET, BY COUNTRY/REGION, 2021–2028 (USD MILLION)
           7.3.4 OTHER SERVICES
                    TABLE 71 OTHER ANIMAL GENETIC TESTING SERVICES MARKET, BY COUNTRY,  2021–2028 (USD MILLION)
 
8 ANIMAL GENETICS MARKET, BY REGION (Page No. - 139)
    8.1 INTRODUCTION 
          FIGURE 33 ANIMAL GENETICS INDUSTRY: GEOGRAPHIC SNAPSHOT
          TABLE 72 ANIMAL GENETICS INDUSTRY, BY REGION, 2021–2028 (USD MILLION)
    8.2 EUROPE 
           8.2.1 EUROPE: RECESSION IMPACT
                    FIGURE 34 EUROPE: ANIMAL GENETICS MARKET SNAPSHOT
                    TABLE 73 EUROPE: ANIMAL GENETICS MARKET REPORT, BY COUNTRY, 2021–2028 (USD MILLION)
                    TABLE 74 EUROPE: ANIMAL GENETICS INDUSTRY, BY PRODUCT & SERVICE,  2021–2028 (USD MILLION)
                    TABLE 75 EUROPE: ANIMAL GENETIC PRODUCTS MARKET, BY TYPE, 2021–2028 (USD MILLION)
                    TABLE 76 EUROPE: LIVE ANIMALS MARKET, BY TYPE, 2021–2028 (USD MILLION)
                    TABLE 77 EUROPE: GENETIC MATERIALS MARKET, BY TYPE, 2021–2028 (USD MILLION)
                    TABLE 78 EUROPE: SEMEN MARKET, BY TYPE, 2021–2028 (USD MILLION)
                    TABLE 79 EUROPE: EMBRYOS MARKET, BY TYPE, 2021–2028 (USD MILLION)
                    TABLE 80 EUROPE: ANIMAL GENETIC TESTING SERVICES MARKET, BY TYPE,  2021–2028 (USD MILLION)
                    TABLE 81 EUROPE: ANIMAL GENETIC TRAIT TESTS MARKET, BY TYPE, 2021–2028 (USD MILLION)
           8.2.2 FRANCE
                    8.2.2.1 Growing domestic demand for livestock and poultry products to drive market
                                TABLE 82 FRANCE: MACROECONOMIC INDICATORS
                                TABLE 83 FRANCE: ANIMAL GENETICS MARKET SHARE, BY PRODUCT & SERVICE,  2021–2028 (USD MILLION)
                                TABLE 84 FRANCE: ANIMAL GENETIC PRODUCTS MARKET, BY TYPE, 2021–2028 (USD MILLION)
                                TABLE 85 FRANCE: LIVE ANIMALS MARKET, BY TYPE, 2021–2028 (USD MILLION)
                                TABLE 86 FRANCE: GENETIC MATERIALS MARKET, BY TYPE, 2021–2028 (USD MILLION)
                                TABLE 87 FRANCE: SEMEN MARKET, BY TYPE, 2021–2028 (USD MILLION)
                                TABLE 88 FRANCE: EMBRYOS MARKET, BY TYPE, 2021–2028 (USD MILLION)
                                TABLE 89 FRANCE: ANIMAL GENETIC TESTING SERVICES MARKET, BY TYPE,  2021–2028 (USD MILLION)
                                TABLE 90 FRANCE: ANIMAL GENETIC TRAIT TESTS MARKET, BY TYPE,  2021–2028 (USD MILLION)
           8.2.3 GERMANY
                    8.2.3.1 Rising popularity of poultry meat to drive demand for poultry genetics
                                TABLE 91 GERMANY: MACROECONOMIC INDICATORS
                                TABLE 92 GERMANY: ANIMAL GENETICS MARKET SHARE, BY PRODUCT & SERVICE,  2021–2028 (USD MILLION)
                                TABLE 93 GERMANY: ANIMAL GENETIC PRODUCTS MARKET, BY TYPE, 2021–2028 (USD MILLION)
                                TABLE 94 GERMANY: LIVE ANIMALS MARKET, BY TYPE, 2021–2028 (USD MILLION)
                                TABLE 95 GERMANY: GENETIC MATERIALS MARKET, BY TYPE, 2021–2028 (USD MILLION)
                                TABLE 96 GERMANY: SEMEN MARKET, BY TYPE, 2021–2028 (USD MILLION)
                                TABLE 97 GERMANY: EMBRYOS MARKET, BY TYPE, 2021–2028 (USD MILLION)
                                TABLE 98 GERMANY: ANIMAL GENETIC TESTING SERVICES MARKET, BY TYPE,  2021–2028 (USD MILLION)
                                TABLE 99 GERMANY: ANIMAL GENETIC TRAIT TESTS MARKET, BY TYPE,  2021–2028 (USD MILLION)
           8.2.4 UK
                    8.2.4.1 Government-led initiatives to boost efficiency and profitability in livestock industry to fuel market growth
                                TABLE 100 UK: MACROECONOMIC INDICATORS
                                TABLE 101 UK: ANIMAL GENETICS MARKET REPORT, BY PRODUCT & SERVICE, 2021–2028 (USD MILLION)
                                TABLE 102 UK: ANIMAL GENETIC PRODUCTS MARKET, BY TYPE, 2021–2028 (USD MILLION)
                                TABLE 103 UK: LIVE ANIMALS MARKET, BY TYPE, 2021–2028 (USD MILLION)
                                TABLE 104 UK: GENETIC MATERIALS MARKET, BY TYPE, 2021–2028 (USD MILLION)
                                TABLE 105 UK: SEMEN MARKET, BY TYPE, 2021–2028 (USD MILLION)
                                TABLE 106 UK: EMBRYOS MARKET, BY TYPE, 2021–2028 (USD MILLION)
                                TABLE 107 UK: ANIMAL GENETIC TESTING SERVICES MARKET, BY TYPE, 2021–2028 (USD MILLION)
                                TABLE 108 UK: ANIMAL GENETIC TRAIT TESTS MARKET, BY TYPE, 2021–2028 (USD MILLION)
           8.2.5 SPAIN
                    8.2.5.1 Growing need to maintain genetic heritage of livestock to drive market
                                TABLE 109 SPAIN: MACROECONOMIC INDICATORS
                                TABLE 110 SPAIN: ANIMAL GENETICS MARKET PREDICTION, BY PRODUCT & SERVICE, 2021–2028 (USD MILLION)
                                TABLE 111 SPAIN: ANIMAL GENETIC PRODUCTS MARKET, BY TYPE, 2021–2028 (USD MILLION)
                                TABLE 112 SPAIN: LIVE ANIMALS MARKET, BY TYPE, 2021–2028 (USD MILLION)
                                TABLE 113 SPAIN: GENETIC MATERIALS MARKET, BY TYPE, 2021–2028 (USD MILLION)
                                TABLE 114 SPAIN: SEMEN MARKET, BY TYPE, 2021–2028 (USD MILLION)
                                TABLE 115 SPAIN: EMBRYOS MARKET, BY TYPE, 2021–2028 (USD MILLION)
                                TABLE 116 SPAIN: ANIMAL GENETIC TESTING SERVICES MARKET, BY TYPE,  2021–2028 (USD MILLION)
                                TABLE 117 SPAIN: ANIMAL GENETIC TRAIT TESTS MARKET, BY TYPE,  2021–2028 (USD MILLION)
           8.2.6 ITALY
                    8.2.6.1 Government-led focus on preservation of local breeds to fuel market growth
                                TABLE 118 ITALY: MACROECONOMIC INDICATORS
                                TABLE 119 ITALY: ANIMAL GENETICS MARKET REPORT, BY PRODUCT & SERVICE, 2021–2028 (USD MILLION)
                                TABLE 120 ITALY: ANIMAL GENETIC PRODUCTS MARKET, BY TYPE, 2021–2028 (USD MILLION)
                                TABLE 121 ITALY: LIVE ANIMALS MARKET, BY TYPE, 2021–2028 (USD MILLION)
                                TABLE 122 ITALY: GENETIC MATERIALS MARKET, BY TYPE, 2021–2028 (USD MILLION)
                                TABLE 123 ITALY: SEMEN MARKET, BY TYPE, 2021–2028 (USD MILLION)
                                TABLE 124 ITALY: EMBRYOS MARKET, BY TYPE, 2021–2028 (USD MILLION)
                                TABLE 125 ITALY: ANIMAL GENETIC TESTING SERVICES MARKET, BY TYPE,  2021–2028 (USD MILLION)
                                TABLE 126 ITALY: ANIMAL GENETIC TRAIT TESTS MARKET, BY TYPE, 2021–2028 (USD MILLION)
           8.2.7 NETHERLANDS
                    8.2.7.1 Rising adoption of efficient farming practices to drive market
                                TABLE 127 NETHERLANDS: MACROECONOMIC INDICATORS
                                TABLE 128 NETHERLANDS: ANIMAL GENETICS MARKET PREDICTION, BY PRODUCT & SERVICE,  2021–2028 (USD MILLION)
                                TABLE 129 NETHERLANDS: ANIMAL GENETIC PRODUCTS MARKET, BY TYPE,  2021–2028 (USD MILLION)
                                TABLE 130 NETHERLANDS: LIVE ANIMALS MARKET, BY TYPE, 2021–2028 (USD MILLION)
                                TABLE 131 NETHERLANDS: GENETIC MATERIALS MARKET, BY TYPE, 2021–2028 (USD MILLION)
                                TABLE 132 NETHERLANDS: SEMEN MARKET, BY TYPE, 2021–2028 (USD MILLION)
                                TABLE 133 NETHERLANDS: EMBRYOS MARKET, BY TYPE, 2021–2028 (USD MILLION)
                                TABLE 134 NETHERLANDS: ANIMAL GENETIC TESTING SERVICES MARKET, BY TYPE,  2021–2028 (USD MILLION)
                                TABLE 135 NETHERLANDS: ANIMAL GENETIC TRAIT TESTS MARKET, BY TYPE,  2021–2028 (USD MILLION)
           8.2.8 REST OF EUROPE
                    TABLE 136 ROE: ANIMAL GENETICS MARKET REPORT, BY PRODUCT & SERVICE, 2021–2028 (USD MILLION)
                    TABLE 137 ROE: ANIMAL GENETIC PRODUCTS MARKET, BY TYPE, 2021–2028 (USD MILLION)
                    TABLE 138 ROE: LIVE ANIMALS MARKET, BY TYPE, 2021–2028 (USD MILLION)
                    TABLE 139 ROE: GENETIC MATERIALS MARKET, BY TYPE, 2021–2028 (USD MILLION)
                    TABLE 140 ROE: SEMEN MARKET, BY TYPE, 2021–2028 (USD MILLION)
                    TABLE 141 ROE: EMBRYOS MARKET, BY TYPE, 2021–2028 (USD MILLION)
                    TABLE 142 ROE: ANIMAL GENETIC TESTING SERVICES MARKET, BY TYPE, 2021–2028 (USD MILLION)
                    TABLE 143 ROE: ANIMAL GENETIC TRAIT TESTS MARKET, BY TYPE, 2021–2028 (USD MILLION)
    8.3 NORTH AMERICA 
           8.3.1 NORTH AMERICA: RECESSION IMPACT
                    FIGURE 35 NORTH AMERICA: ANIMAL GENETICS MARKET SNAPSHOT
                    TABLE 144 NORTH AMERICA: ANIMAL GENETICS MARKET PREDICTION, BY COUNTRY, 2021–2028 (USD MILLION)
                    TABLE 145 NORTH AMERICA: ANIMAL GENETICS INDUSTRY, BY PRODUCT & SERVICE,  2021–2028 (USD MILLION)
                    TABLE 146 NORTH AMERICA: ANIMAL GENETIC PRODUCTS MARKET, BY TYPE,  2021–2028 (USD MILLION)
                    TABLE 147 NORTH AMERICA: LIVE ANIMALS MARKET, BY TYPE, 2021–2028 (USD MILLION)
                    TABLE 148 NORTH AMERICA: GENETIC MATERIALS MARKET, BY TYPE, 2021–2028 (USD MILLION)
                    TABLE 149 NORTH AMERICA: SEMEN MARKET, BY TYPE, 2021–2028 (USD MILLION)
                    TABLE 150 NORTH AMERICA: EMBRYOS MARKET, BY TYPE, 2021–2028 (USD MILLION)
                    TABLE 151 NORTH AMERICA: ANIMAL GENETIC TESTING SERVICES MARKET, BY TYPE,  2021–2028 (USD MILLION)
                    TABLE 152 NORTH AMERICA: ANIMAL GENETIC TRAIT TESTS MARKET, BY TYPE,  2021–2028 (USD MILLION)
           8.3.2 US
                    8.3.2.1 Increased adoption of advanced genetic testing to drive market
                                TABLE 153 US: MACROECONOMIC INDICATORS
                                TABLE 154 US: ANIMAL GENETICS MARKET ANALYSIS, BY PRODUCT & SERVICE, 2021–2028 (USD MILLION)
                                TABLE 155 US: ANIMAL GENETIC PRODUCTS MARKET, BY TYPE, 2021–2028 (USD MILLION)
                                TABLE 156 US: LIVE ANIMALS MARKET, BY TYPE, 2021–2028 (USD MILLION)
                                TABLE 157 US: GENETIC MATERIALS MARKET, BY TYPE, 2021–2028 (USD MILLION)
                                TABLE 158 US: SEMEN MARKET, BY TYPE, 2021–2028 (USD MILLION)
                                TABLE 159 US: EMBRYOS MARKET, BY TYPE, 2021–2028 (USD MILLION)
                                TABLE 160 US: ANIMAL GENETIC TESTING SERVICES MARKET, BY TYPE, 2021–2028 (USD MILLION)
                                TABLE 161 US: ANIMAL GENETIC TRAIT TESTS MARKET, BY TYPE, 2021–2028 (USD MILLION)
           8.3.3 CANADA
                    8.3.3.1 Growing demand for genetic materials to boost market growth
                                TABLE 162 CANADA: MACROECONOMIC INDICATORS
                                TABLE 163 CANADA: ANIMAL GENETICS MARKET ANALYSIS, BY PRODUCT & SERVICE,  2021–2028 (USD MILLION)
                                TABLE 164 CANADA: ANIMAL GENETIC PRODUCTS MARKET, BY TYPE, 2021–2028 (USD MILLION)
                                TABLE 165 CANADA: LIVE ANIMALS MARKET, BY TYPE, 2021–2028 (USD MILLION)
                                TABLE 166 CANADA: GENETIC MATERIALS MARKET, BY TYPE, 2021–2028 (USD MILLION)
                                TABLE 167 CANADA: SEMEN MARKET, BY TYPE, 2021–2028 (USD MILLION)
                                TABLE 168 CANADA: EMBRYOS MARKET, BY TYPE, 2021–2028 (USD MILLION)
                                TABLE 169 CANADA: ANIMAL GENETIC TESTING SERVICES MARKET, BY TYPE,  2021–2028 (USD MILLION)
                                TABLE 170 CANADA: ANIMAL GENETIC TRAIT TESTS MARKET, BY TYPE, 2021–2028 (USD MILLION)
    8.4 ASIA PACIFIC 
           8.4.1 ASIA PACIFIC: RECESSION IMPACT
                    FIGURE 36 ASIA PACIFIC: ANIMAL GENETICS MARKET SNAPSHOT
                    TABLE 171 APAC: ANIMAL GENETICS INDUSTRY, BY COUNTRY, 2021–2028 (USD MILLION)
                    TABLE 172 APAC: ANIMAL GENETICS MARKET REPORT, BY PRODUCT & SERVICE, 2021–2028 (USD MILLION)
                    TABLE 173 APAC: ANIMAL GENETIC PRODUCTS MARKET, BY TYPE, 2021–2028 (USD MILLION)
                    TABLE 174 APAC: LIVE ANIMALS MARKET, BY TYPE, 2021–2028 (USD MILLION)
                    TABLE 175 APAC: GENETIC MATERIALS MARKET, BY TYPE, 2021–2028 (USD MILLION)
                    TABLE 176 APAC: SEMEN MARKET, BY TYPE, 2021–2028 (USD MILLION)
                    TABLE 177 APAC: EMBRYOS MARKET, BY TYPE, 2021–2028 (USD MILLION)
                    TABLE 178 APAC: ANIMAL GENETIC TESTING SERVICES MARKET, BY TYPE,  2021–2028 (USD MILLION)
                    TABLE 179 APAC: ANIMAL GENETIC TRAIT TESTS MARKET, BY TYPE,  2021–2028 (USD MILLION)
           8.4.2 CHINA
                    8.4.2.1 Exponential population growth and demand for meat and dairy products to boost market growth
                                TABLE 180 CHINA: MACROECONOMIC INDICATORS
                                TABLE 181 CHINA: ANIMAL GENETICS MARKET ANALYSIS, BY PRODUCT & SERVICE,  2021–2028 (USD MILLION)
                                TABLE 182 CHINA: ANIMAL GENETIC PRODUCTS MARKET, BY TYPE, 2021–2028 (USD MILLION)
                                TABLE 183 CHINA: LIVE ANIMALS MARKET, BY TYPE, 2021–2028 (USD MILLION)
                                TABLE 184 CHINA: GENETIC MATERIALS MARKET, BY TYPE, 2021–2028 (USD MILLION)
                                TABLE 185 CHINA: SEMEN MARKET, BY TYPE, 2021–2028 (USD MILLION)
                                TABLE 186 CHINA: EMBRYOS MARKET, BY TYPE, 2021–2028 (USD MILLION)
                                TABLE 187 CHINA: ANIMAL GENETIC TESTING SERVICES MARKET, BY TYPE,  2021–2028 (USD MILLION)
                                TABLE 188 CHINA: ANIMAL GENETIC TRAIT TESTS MARKET, BY TYPE,  2021–2028 (USD MILLION)
           8.4.3 INDIA
                    8.4.3.1 Large-scale production of live bovines to drive market
                                TABLE 189 INDIA: MACROECONOMIC INDICATORS
                                TABLE 190 INDIA: ANIMAL GENETICS MARKET ANALYSIS, BY PRODUCT & SERVICE, 2021–2028 (USD MILLION)
                                TABLE 191 INDIA: ANIMAL GENETIC PRODUCTS MARKET, BY TYPE, 2021–2028 (USD MILLION)
                                TABLE 192 INDIA: LIVE ANIMALS MARKET, BY TYPE, 2021–2028 (USD MILLION)
                                TABLE 193 INDIA: GENETIC MATERIALS MARKET, BY TYPE, 2021–2028 (USD MILLION)
                                TABLE 194 INDIA: SEMEN MARKET, BY TYPE, 2021–2028 (USD MILLION)
                                TABLE 195 INDIA: EMBRYOS MARKET, BY TYPE, 2021–2028 (USD MILLION)
                                TABLE 196 INDIA: ANIMAL GENETIC TESTING SERVICES MARKET, BY TYPE,  2021–2028 (USD MILLION)
                                TABLE 197 INDIA: ANIMAL GENETIC TRAIT TESTS MARKET, BY TYPE, 2021–2028 (USD MILLION)
           8.4.4 JAPAN
                    8.4.4.1 Increased production and consumption of livestock products to propel market growth
                                TABLE 198 JAPAN: MACROECONOMIC INDICATORS
                                TABLE 199 JAPAN: ANIMAL GENETICS MARKET ANALYSIS, BY PRODUCT & SERVICE,  2021–2028 (USD MILLION)
                                TABLE 200 JAPAN: ANIMAL GENETIC PRODUCTS MARKET, BY TYPE, 2021–2028 (USD MILLION)
                                TABLE 201 JAPAN: LIVE ANIMALS MARKET, BY TYPE, 2021–2028 (USD MILLION)
                                TABLE 202 JAPAN: GENETIC MATERIALS MARKET, BY TYPE, 2021–2028 (USD MILLION)
                                TABLE 203 JAPAN: SEMEN MARKET, BY TYPE, 2021–2028 (USD MILLION)
                                TABLE 204 JAPAN: EMBRYOS MARKET, BY TYPE, 2021–2028 (USD MILLION)
                                TABLE 205 JAPAN: ANIMAL GENETIC TESTING SERVICES MARKET, BY TYPE,  2021–2028 (USD MILLION)
                                TABLE 206 JAPAN: ANIMAL GENETIC TRAIT TESTS MARKET, BY TYPE, 2021–2028 (USD MILLION)
           8.4.5 AUSTRALIA
                    8.4.5.1 Increased demand for animal-based food products to drive market
                                TABLE 207 AUSTRALIA: MACROECONOMIC INDICATORS
                                TABLE 208 AUSTRALIA: ANIMAL GENETICS MARKET SEGMENTS, BY PRODUCT & SERVICE,  2021–2028 (USD MILLION)
                                TABLE 209 AUSTRALIA: ANIMAL GENETIC PRODUCTS MARKET, BY TYPE, 2021–2028 (USD MILLION)
                                TABLE 210 AUSTRALIA: LIVE ANIMALS MARKET, BY TYPE, 2021–2028 (USD MILLION)
                                TABLE 211 AUSTRALIA: GENETIC MATERIALS MARKET, BY TYPE, 2021–2028 (USD MILLION)
                                TABLE 212 AUSTRALIA: SEMEN MARKET, BY TYPE, 2021–2028 (USD MILLION)
                                TABLE 213 AUSTRALIA: EMBRYOS MARKET, BY TYPE, 2021–2028 (USD MILLION)
                                TABLE 214 AUSTRALIA: ANIMAL GENETIC TESTING SERVICES MARKET, BY TYPE,  2021–2028 (USD MILLION)
                                TABLE 215 AUSTRALIA: ANIMAL GENETIC TRAIT TESTS MARKET, BY TYPE,  2021–2028 (USD MILLION)
           8.4.6 SOUTH KOREA
                    8.4.6.1 Growing consumption of high-quality animal products to drive market
                                TABLE 216 SOUTH KOREA: MACROECONOMIC INDICATORS
                                TABLE 217 SOUTH KOREA: ANIMAL GENETICS MARKET SEGMENTS, BY PRODUCT & SERVICE,  2021–2028 (USD MILLION)
                                TABLE 218 SOUTH KOREA: ANIMAL GENETIC PRODUCTS MARKET, BY TYPE,  2021–2028 (USD MILLION)
                                TABLE 219 SOUTH KOREA: LIVE ANIMALS MARKET, BY TYPE, 2021–2028 (USD MILLION)
                                TABLE 220 SOUTH KOREA: GENETIC MATERIALS MARKET, BY TYPE, 2021–2028 (USD MILLION)
                                TABLE 221 SOUTH KOREA: SEMEN MARKET, BY TYPE, 2021–2028 (USD MILLION)
                                TABLE 222 SOUTH KOREA: EMBRYOS MARKET, BY TYPE, 2021–2028 (USD MILLION)
                                TABLE 223 SOUTH KOREA: ANIMAL GENETIC TESTING SERVICES MARKET, BY TYPE,  2021–2028 (USD MILLION)
                                TABLE 224 SOUTH KOREA: ANIMAL GENETIC TRAIT TESTS MARKET, BY TYPE,  2021–2028 (USD MILLION)
           8.4.7 REST OF ASIA PACIFIC
                    TABLE 225 ROAPAC: ANIMAL GENETICS MARKET SEGMENTS, BY PRODUCT & SERVICE,  2021–2028 (USD MILLION)
                    TABLE 226 ROAPAC: ANIMAL GENETIC PRODUCTS MARKET, BY TYPE, 2021–2028 (USD MILLION)
                    TABLE 227 ROAPAC: LIVE ANIMALS MARKET, BY TYPE, 2021–2028 (USD MILLION)
                    TABLE 228 ROAPAC: GENETIC MATERIALS MARKET, BY TYPE, 2021–2028 (USD MILLION)
                    TABLE 229 ROAPAC: SEMEN MARKET, BY TYPE, 2021–2028 (USD MILLION)
                    TABLE 230 ROAPAC: EMBRYOS MARKET, BY TYPE, 2021–2028 (USD MILLION)
                    TABLE 231 ROAPAC: ANIMAL GENETIC TESTING SERVICES MARKET, BY TYPE,  2021–2028 (USD MILLION)
                    TABLE 232 ROAPAC: ANIMAL GENETIC TRAIT TESTS MARKET, BY TYPE,  2021–2028 (USD MILLION)
    8.5 LATIN AMERICA 
           8.5.1 LATIN AMERICA: RECESSION IMPACT
                    TABLE 233 LATIN AMERICA: ANIMAL GENETICS MARKET SEGMENTS, BY COUNTRY, 2021–2028 (USD MILLION)
                    TABLE 234 LATIN AMERICA: ANIMAL GENETICS INDUSTRY, BY PRODUCT & SERVICE,  2021–2028 (USD MILLION)
                    TABLE 235 LATIN AMERICA: ANIMAL GENETIC PRODUCTS MARKET, BY TYPE,  2021–2028 (USD MILLION)
                    TABLE 236 LATIN AMERICA: LIVE ANIMALS MARKET, BY TYPE, 2021–2028 (USD MILLION)
                    TABLE 237 LATIN AMERICA: GENETIC MATERIALS MARKET, BY TYPE, 2021–2028 (USD MILLION)
                    TABLE 238 LATIN AMERICA: SEMEN MARKET, BY TYPE, 2021–2028 (USD MILLION)
                    TABLE 239 LATIN AMERICA: EMBRYOS MARKET, BY TYPE, 2021–2028 (USD MILLION)
                    TABLE 240 LATIN AMERICA: ANIMAL GENETIC TESTING SERVICES MARKET, BY TYPE,  2021–2028 (USD MILLION)
                    TABLE 241 LATIN AMERICA: ANIMAL GENETIC TRAIT TESTS MARKET, BY TYPE,  2021–2028 (USD MILLION)
           8.5.2 BRAZIL
                    8.5.2.1 Growing beef industry to drive market
                                TABLE 242 BRAZIL: MACROECONOMIC INDICATORS
                                TABLE 243 BRAZIL: ANIMAL GENETICS MARKET SEGMENTS, BY PRODUCT & SERVICE,  2021–2028 (USD MILLION)
                                TABLE 244 BRAZIL: ANIMAL GENETIC PRODUCTS MARKET, BY TYPE, 2021–2028 (USD MILLION)
                                TABLE 245 BRAZIL: LIVE ANIMALS MARKET, BY TYPE, 2021–2028 (USD MILLION)
                                TABLE 246 BRAZIL: GENETIC MATERIALS MARKET, BY TYPE, 2021–2028 (USD MILLION)
                                TABLE 247 BRAZIL: SEMEN MARKET, BY TYPE, 2021–2028 (USD MILLION)
                                TABLE 248 BRAZIL: EMBRYOS MARKET, BY TYPE, 2021–2028 (USD MILLION)
                                TABLE 249 BRAZIL: ANIMAL GENETIC TESTING SERVICES MARKET, BY TYPE,  2021–2028 (USD MILLION)
                                TABLE 250 BRAZIL: ANIMAL GENETIC TRAIT TESTS MARKET, BY TYPE,  2021–2028 (USD MILLION)
           8.5.3 MEXICO
                    8.5.3.1 Government-led initiatives to improve herd quality to fuel market growth
                                TABLE 251 MEXICO: MACROECONOMIC INDICATORS
                                TABLE 252 MEXICO: ANIMAL GENETICS MARKET SEGMENTATION, BY PRODUCT & SERVICE,  2021–2028 (USD MILLION)
                                TABLE 253 MEXICO: ANIMAL GENETIC PRODUCTS MARKET, BY TYPE, 2021–2028 (USD MILLION)
                                TABLE 254 MEXICO: LIVE ANIMALS MARKET, BY TYPE, 2021–2028 (USD MILLION)
                                TABLE 255 MEXICO: GENETIC MATERIALS MARKET, BY TYPE, 2021–2028 (USD MILLION)
                                TABLE 256 MEXICO: SEMEN MARKET, BY TYPE, 2021–2028 (USD MILLION)
                                TABLE 257 MEXICO: EMBRYOS MARKET, BY TYPE, 2021–2028 (USD MILLION)
                                TABLE 258 MEXICO: ANIMAL GENETIC TESTING SERVICES MARKET, BY TYPE,  2021–2028 (USD MILLION)
                                TABLE 259 MEXICO: ANIMAL GENETIC TRAIT TESTS MARKET, BY TYPE, 2021–2028 (USD MILLION)
           8.5.4 REST OF LATIN AMERICA
                    TABLE 260 ROLA: ANIMAL GENETICS MARKET SEGMENTATION, BY PRODUCT & SERVICE, 2021–2028 (USD MILLION)
                    TABLE 261 ROLA: ANIMAL GENETIC PRODUCTS MARKET, BY TYPE, 2021–2028 (USD MILLION)
                    TABLE 262 ROLA: LIVE ANIMALS MARKET, BY TYPE, 2021–2028 (USD MILLION)
                    TABLE 263 ROLA: GENETIC MATERIALS MARKET, BY TYPE, 2021–2028 (USD MILLION)
                    TABLE 264 ROLA: SEMEN MARKET, BY TYPE, 2021–2028 (USD MILLION)
                    TABLE 265 ROLA: EMBRYOS MARKET, BY TYPE, 2021–2028 (USD MILLION)
                    TABLE 266 ROLA: ANIMAL GENETIC TESTING SERVICES MARKET, BY TYPE,  2021–2028 (USD MILLION)
                    TABLE 267 ROLA: ANIMAL GENETIC TRAIT TESTS MARKET, BY TYPE,  2021–2028 (USD MILLION)
    8.6 MIDDLE EAST & AFRICA 
           8.6.1 GROWING URBANIZATION AND SHIFTING DIETARY HABITS TO DRIVE MARKET
           8.6.2 MIDDLE EAST & AFRICA: RECESSION IMPACT
                    TABLE 268 MIDDLE EAST & AFRICA: ANIMAL GENETICS MARKET SEGMENTATION, BY PRODUCT & SERVICE,  2021–2028 (USD MILLION)
                    TABLE 269 MIDDLE EAST & AFRICA: ANIMAL GENETIC PRODUCTS MARKET, BY TYPE,  2021–2028 (USD MILLION)
                    TABLE 270 MIDDLE EAST & AFRICA: LIVE ANIMALS MARKET, BY TYPE, 2021–2028 (USD MILLION)
                    TABLE 271 MIDDLE EAST & AFRICA: GENETIC MATERIALS MARKET, BY TYPE,  2021–2028 (USD MILLION)
                    TABLE 272 MIDDLE EAST & AFRICA: SEMEN MARKET, BY TYPE, 2021–2028 (USD MILLION)
                    TABLE 273 MIDDLE EAST & AFRICA: EMBRYOS MARKET, BY TYPE, 2021–2028 (USD MILLION)
                    TABLE 274 MIDDLE EAST & AFRICA: ANIMAL GENETIC TESTING SERVICES MARKET, BY TYPE,  2021–2028 (USD MILLION)
                    TABLE 275 MIDDLE EAST & AFRICA: ANIMAL GENETIC TRAIT TESTS MARKET, BY TYPE,  2021–2028 (USD MILLION)
 
9 COMPETITIVE LANDSCAPE (Page No. - 224)
    9.1 INTRODUCTION 
          FIGURE 37 KEY DEVELOPMENTS IN ANIMAL GENETICS MARKET
    9.2 MARKET SHARE ANALYSIS, 2022 
           9.2.1 ANIMAL GENETIC PRODUCTS MARKET, BY ANIMAL TYPE, 2022
                    9.2.1.1 Bovine genetics
                                FIGURE 38 BOVINE GENETICS MARKET SHARE ANALYSIS, BY KEY PLAYER, 2022
                    9.2.1.2 Porcine genetics
                                FIGURE 39 PORCINE GENETICS MARKET SHARE ANALYSIS, BY KEY PLAYER, 2022
                    9.2.1.3 Poultry genetics
                                FIGURE 40 POULTRY GENETICS MARKET SHARE ANALYSIS, BY KEY PLAYER, 2022
                    9.2.1.4 Animal genetic testing services
                                FIGURE 41 ANIMAL GENETIC TESTING SERVICES MARKET SHARE ANALYSIS,  BY KEY PLAYER, 2022
    9.3 FOOTPRINT ANALYSIS OF TOP PLAYERS IN ANIMAL GENETICS MARKET 
          TABLE 276 ANIMAL GENETICS INDUSTRY: COMPANY FOOTPRINT ANALYSIS
          TABLE 277 ANIMAL GENETICS INDUSTRY: COMPANY PRODUCT & SERVICE FOOTPRINT ANALYSIS
          TABLE 278 ANIMAL GENETICS INDUSTRY: COMPANY REGIONAL FOOTPRINT ANALYSIS
    9.4 PRODUCT & SERVICE PORTFOLIO MATRIX 
    9.5 COMPANY EVALUATION MATRIX, 2022 
           9.5.1 STARS
           9.5.2 EMERGING LEADERS
           9.5.3 PERVASIVE PLAYERS
           9.5.4 PARTICIPANTS
                    FIGURE 42 ANIMAL GENETICS MARKET SEGMENTATION: COMPANY EVALUATION MATRIX, 2022
    9.6 COMPANY EVALUATION MATRIX FOR START-UPS/SMALL AND MEDIUM-SIZED ENTERPRISES (SMES), 2022 
           9.6.1 PROGRESSIVE COMPANIES
           9.6.2 DYNAMIC COMPANIES
           9.6.3 STARTING BLOCKS
           9.6.4 RESPONSIVE COMPANIES
                    FIGURE 43 COMPANY EVALUATION MATRIX FOR START-UPS/SMES, 2022
    9.7 COMPETITIVE BENCHMARKING 
          TABLE 279 ANIMAL GENETICS INDUSTRY: KEY START-UPS/SMES
    9.8 COMPETITIVE SCENARIO AND TRENDS 
           9.8.1 KEY DEVELOPMENTS IN ANIMAL GENETICS MARKET
                    TABLE 280 DEALS (2020–2023)
                    TABLE 281 PRODUCT LAUNCHES (2020–2023)
 
10 COMPANY PROFILES (Page No. - 240)
     10.1 KEY PLAYERS 
(Business Overview, Products Offered, Recent Developments, and MnM View (Key strengths/Right to Win, Strategic Choices Made, and Weaknesses and Competitive Threats))*
             10.1.1 NEOGEN CORPORATION
                        TABLE 282 NEOGEN CORPORATION: BUSINESS OVERVIEW
                        FIGURE 44 NEOGEN CORPORATION: COMPANY SNAPSHOT
             10.1.2 GENUS
                        TABLE 283 GENUS: COMPANY OVERVIEW
                        FIGURE 45 GENUS: COMPANY SNAPSHOT
             10.1.3 URUS
                        TABLE 284 URUS GROUP: COMPANY OVERVIEW
             10.1.4 EW GROUP GMBH
                        TABLE 285 EW GROUP: COMPANY OVERVIEW
             10.1.5 GROUPE GRIMAUD
                        TABLE 286 GROUPE GRIMAUD: COMPANY OVERVIEW
             10.1.6 CRV HOLDING
                        TABLE 287 CRV HOLDING: COMPANY OVERVIEW
             10.1.7 TOPIGS NORSVIN
                        TABLE 288 TOPIGS NORSVIN: COMPANY OVERVIEW
             10.1.8 ZOETIS, INC.
                        TABLE 289 ZOETIS, INC.: COMPANY OVERVIEW
                        FIGURE 46 ZOETIS, INC.: COMPANY SNAPSHOT
             10.1.9 ENVIGO
                        TABLE 290 ENVIGO: COMPANY OVERVIEW
             10.1.10 HENDRIX GENETICS
                        TABLE 291 HENDRIX GENETICS: COMPANY OVERVIEW
             10.1.11 ANIMAL GENETICS
                        TABLE 292 ANIMAL GENETICS: COMPANY OVERVIEW
     10.2 OTHER PLAYERS 
             10.2.1 VETGEN
                        TABLE 293 VETGEN: COMPANY OVERVIEW
             10.2.2 DANBRED
                        TABLE 294 DANBRED: COMPANY OVERVIEW
             10.2.3 TROPICAL BOVINE GENETICS
                        TABLE 295 TROPICAL BOVINE GENETICS: COMPANY OVERVIEW
             10.2.4 EASYDNA
                        TABLE 296 EASYDNA: COMPANY OVERVIEW
             10.2.5 INGURAN LLC DBA ST GENETICS
                        TABLE 297 INGURAN LLC DBA ST GENETICS: COMPANY OVERVIEW
             10.2.6 SEMEX ALLIANCE
                        TABLE 298 SEMEX ALLIANCE: COMPANY OVERVIEW
             10.2.7 SUPERIOR ANIMAL GENETICS
                        TABLE 299 SUPERIOR ANIMAL GENETICS: COMPANY OVERVIEW
             10.2.8 COBB-VANTRESS
                        TABLE 300 COBB-VANTRESS: COMPANY OVERVIEW
             10.2.9 MILK SOURCE
                        TABLE 301 MILK SOURCE: COMPANY OVERVIEW
             10.2.10 EUROGENE AI SERVICES
                        TABLE 302 EUROGENE AI SERVICES: COMPANY OVERVIEW
             10.2.11 AGRI-GENE
                        TABLE 303 AGRI-GENE: COMPANY OVERVIEW
             10.2.12 ACCELERATED GENETICS
                        TABLE 304 ACCELERATED GENETICS: COMPANY OVERVIEW
             10.2.13 VIKING GENETICS
                        TABLE 305 VIKING GENETICS: COMPANY OVERVIEW
             10.2.14 INDICAL BIOSCIENCE
                        TABLE 306 INDICAL BIOSCIENCE: COMPANY OVERVIEW
 
*Details on Business Overview, Products Offered, Recent Developments, and MnM View (Key strengths/Right to Win, Strategic Choices Made, and Weaknesses and Competitive Threats) might not be captured in case of unlisted companies.
 
11 APPENDIX (Page No. - 328)
     11.1 DISCUSSION GUIDE 
     11.2 KNOWLEDGESTORE: MARKETSANDMARKETS’  SUBSCRIPTION PORTAL 
     11.3 CUSTOMIZATION OPTIONS 
     11.4 RELATED REPORTS 
     11.5 AUTHOR DETAILS 

This study involved the extensive use of both primary and secondary sources. The research process involved the study of various factors affecting the industry to identify the segmentation types, industry trends, key players, competitive landscape, key market dynamics, and key player strategies.

Secondary Research

This research study involved the usage of comprehensive secondary sources; directories; databases such as Bloomberg Business, Factiva, and Dun & Bradstreet; white papers; annual reports; company house documents; investor presentations; and SEC filings of companies. Secondary research was used to identify and collect information useful for an extensive, technical, market-oriented, and commercial study of the animal genetics market. It was also used to obtain important information about the key players, market classification and segmentation according to industry trends to the bottommost level, and key developments related to market and technology perspectives. A database of the key industry leaders was also prepared using secondary research.

Primary Research

In the primary research process, various sources from both the supply and demand sides were interviewed to obtain qualitative and quantitative information for this report. Primary sources from the supply side include project/sales/marketing/business development managers, presidents, CEOs, vice presidents, chairpersons, chief operating officers, chief strategy officers, directors, chief information officers, chief medical information officers related to the animal genetics markets. Primary sources from the demand side include professionals from veterinary centers & institutes, professors, veterinanians and researchers.

A breakdown of the primary respondents is provided below:

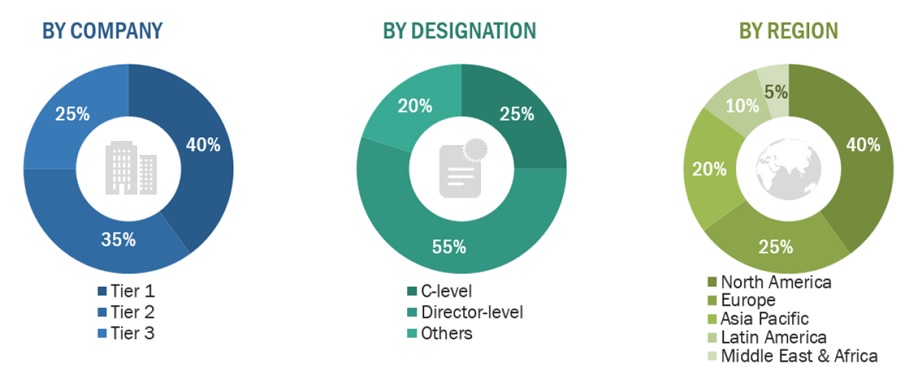
Breakdown of Primary Interviews: Supply-Side Participants, By Company Type, Designation, and Region

Supply side:
Animal Genetics Market Size, and Share

Note 1: C-level primaries include CEOs, COOs, CTOs, and VPs.

Note 2: Other primaries include sales managers, marketing managers, and product managers.

Note 3: Companies are classified into tiers based on their total revenue. As of 2022: Tier 1 = >USD 1 billion, Tier 2 = USD 500 million to USD 1 billion, and Tier 3 = <USD 500 million.

To know about the assumptions considered for the study, download the pdf brochure

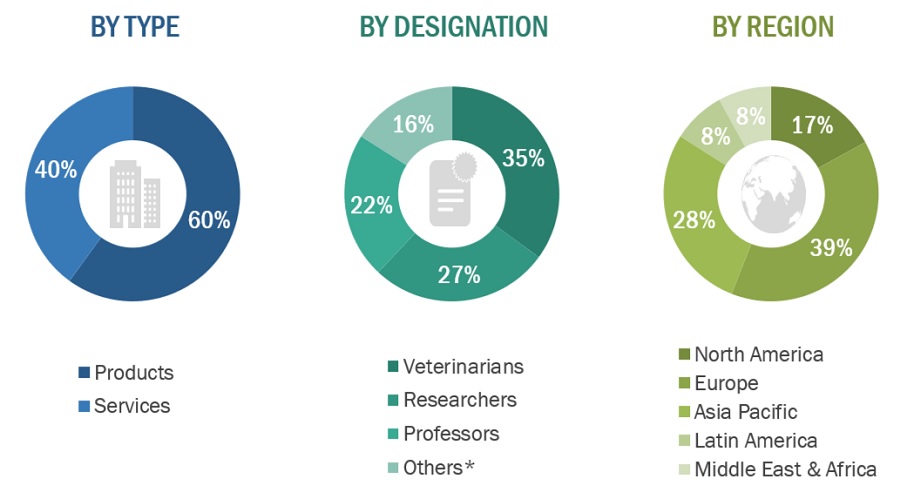
Breakdown of Primary Interviews: Demand-Side Participants, By Type, Designation, and Region

Demand Side:
Animal Genetics Market Size, and Share

To know about the assumptions considered for the study, Request for Free Sample Report

Note: Others include department heads, professionals from veterinary centers & institutes.

Market Size Estimation

The total size of the animal genetics market was arrived at after data triangulation from three different approaches, as mentioned below. After each approach, the weighted average of the three approaches was taken based on the level of assumptions used in each approach

Animal Genetics Market Size, and Share

Data Triangulation

After arriving at the market size, the total market was divided into several segments and subsegments. To complete the overall market engineering process and arrive at the exact statistics for all segments and subsegments, data triangulation and market breakdown procedures were employed wherever applicable. The following figure shows the market validation, source structure, and data triangulation methodology implemented in the market engineering process.

Market Definition

Animal genetics refers to the practice of selective breeding of farm and companion animals by humans for specific benefits—for example, farmers are adopting gene modification and selective breeding practices to increase the yield of animal-derived products. This study covers the animal genetic products (live animals and genetic materials) and animal genetic testing services.

Key Stakeholders

  • Animal genetics companies
  • Animal breeders
  • Research institutes and academic centers
  • Contract research organizations (CROs)
  • Government associations
  • Milk and meat producers
  • Market research and consulting firms
  • Venture capitalists and investors 

Objectives of the Study

  • To define, describe, and forecast the animal genetics market by product & service and region
  • To strategically analyze the industry trends, technology trends, pricing analysis, regulatory scenario, supply/value chain, ecosystem/market map, Porter’s Five Forces, trade & patent analysis, key stakeholders & buying criteria, and conferences & events
  • To provide detailed information about the factors influencing market growth (drivers, restraints, opportunities, and challenges)
  • To analyze micromarkets with respect to individual growth trends, prospects, and contributions to the overall market
  • To analyze market opportunities for stakeholders and provide details of the competitive landscape for key players
  • To forecast the market size based on region in Europe, North America, the Asia Pacific, Latin America, and the Middle East and Africa
  • To strategically profile key players in the animal genetics market and comprehensively analyze their core competencies
  • To track and analyze competitive developments such as acquisitions, product launches, approvals, expansions, and partnerships
  • To analyze the impact of the recession on the animal genetics market

Available customizations

With the given market data, MarketsandMarkets offers customizations as per your company’s specific needs. The following customization options are available for the report:

Company Information

  • Detailed analysis and profiling of additional market players (up to 5)

Geographic Analysis

  • Further breakdown of the RoE animal genetics market into Austria, Finland, and others
  • Further breakdown of the RoLATAM animal genetics market into Argentina, Colombia, Chile, and others

Competitive Landscape Assessment

  • Market share analysis for the North America and Europe region, which provides market shares of the top 3–5 key players in the animal genetics market
  • Competitive leadership mapping for established players in the US
Custom Market Research Services

We will customize the research for you, in case the report listed above does not meet with your exact requirements. Our custom research will comprehensively cover the business information you require to help you arrive at strategic and profitable business decisions.

Request Customization

Instant Answers with GPT - Ask Now!

Ask real questions. Get complete answers !
Report Code
BT 3244
Published ON
Aug, 2023
Choose License Type
BUY NOW
  • SHARE
X
Request Customization
Speak to Analyst
Speak to Analyst
OR FACE-TO-FACE MEETING
PERSONALIZE THIS RESEARCH
  • Triangulate with your Own Data
  • Get Data as per your Format and Definition
  • Gain a Deeper Dive on a Specific Application, Geography, Customer or Competitor
  • Any level of Personalization
REQUEST A FREE CUSTOMIZATION
LET US HELP YOU!
  • What are the Known and Unknown Adjacencies Impacting the Animal Genetics Market
  • What will your New Revenue Sources be?
  • Who will be your Top Customer; what will make them switch?
  • Defend your Market Share or Win Competitors
  • Get a Scorecard for Target Partners
CUSTOMIZED WORKSHOP REQUEST
+1-888-600-6441
  • Call Us
  • +1-888-600-6441 (Corporate office hours)
  • +1-888-600-6441 (US/Can toll free)
  • +44-800-368-9399 (UK office hours)
CONNECT WITH US
ABOUT TRUST ONLINE
©2024 MarketsandMarkets Research Private Ltd. All rights reserved
DMCA.com Protection Status Website Feedback