Application Container Market by Service (Container Monitoring, Security, Data Management, Networking, Orchestration), Platform (Docker, Kubernetes), Application Area, Deployment Mode, Organization Size, Vertical, and Region - Global Forecast to 2023


[178 Pages Report] An application container is an Operating System (OS)-level virtualization that deploys and runs distributed applications without actually running a virtual machine. It is more efficient than hardware infrastructure virtualization, which provides the same Kernel OS to various isolated applications and enables them to run on a single host. Application containers usually work on virtual machines, cloud instances, and bare-metal cloud systems across different OS.
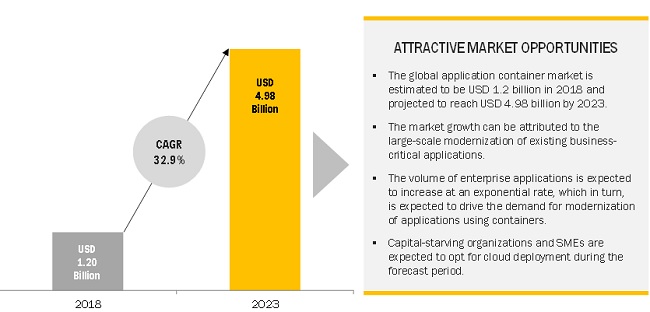
The global application container market is expected to grow from USD 1.2 billion in 2018 to USD 4.98 billion by 2023, at a CAGR of 32.9% during the forecast period. This growth is expected to be fueled by the increasing number of container orchestration services and container security services deployed in enterprises globally.
By service, container orchestration service is expected to hold the largest market share during the forecast period
The application container market by service has been segmented into container orchestration, container data management, container security, container networking, container monitoring, consulting, and support and maintenance. As more and more applications are migrating to the cloud, the demand for application containers is also expected to be increasing among enterprises. Cloud-native applications and legacy application modernization, bundled with DevOps strategies adopted by various enterprises, are expected to be driving the demand for application container services. The container orchestration segment is expected to hold the largest market share during the forecast period; this significant market share can be attributed to the high demand for efficient container management and container orchestration services among organizations.
By vertical, banking, financial services and insurance vertical is expected to hold the largest market share during the forecast period
The application container market has been segmented based on different verticals, namely, telecommunications and IT, education, BFSI, media and entertainment, healthcare and life sciences, retail and e-commerce, and others. The BFSI vertical is estimated to hold the largest market share and expected to grow at the highest CAGR during the forecast period. The main factor driving the growth of the application container services in the BFSI vertical is the omnichannel approach and the trend of shifting towards cloud environment. The demand for application container services is estimated to be gaining traction across all industries. Since cloud transformation has become one of the key elements of enterprise strategies today, the demand for application container services is also seen to be increasing.
Asia Pacific is expected to grow at the highest CAGR during the forecast period
APAC is expected to experience the highest growth in terms of adopting application container services during the forecast period. The growth is likely to be driven by factors, such as the increased spending on improving infrastructures and the emergence of advanced and secured cloud-based solutions, tax reformation policies, smart cities initiatives, and the rise of the digital economy. The major countries that are expected to witness high growth rates in this region include China, Japan, Singapore, Australia and New Zealand (ANZ), and the rest of the Association of Southeast Asian Nations (ASEAN) countries. Companies in this region are transforming their strategy from customer acquisition to customer experience. Most of the leading companies are changing their legacy applications and securing them. With the application container technology, organizations can make their applications agiler. Moreover, organizations can quickly adapt or migrate to the cloud by developing their applications on application container platforms.
Market Dynamics
Driver: Growing need for business agility and faster time-to-market
Enterprises require coordination to grow and respond to the increase in competition. This can be achieved only by adopting the latest technologies and developing and delivering modern applications. The existence of legacy environments hinder technological adoptions and require transformations at the application, platform, and technology levels. Application containers help in quickening the application development process by minimizing the testing time and reducing the complexities of testing processes, thereby bringing about agility. In addition to this, the container orchestration streamlines the deployment of applications in various environments, such as physical or virtual and public, private, or hybrid cloud infrastructures. This gives a competitive advantage to enterprises and results in increased efficiency, reduced application-related costs, and a better Return on Investment (RoI).
Restraint: Emergence of application container sprawl
Container sprawl is a term used to describe the running of unmanageable, multiple instances of applications through containers, and the corresponding heavy resource consumption resulting from it. Resource consumption, in various cases, results in fewer resources for running useful containers. Moreover, the chances of misconfiguration and mishandling of unmanageable containers on a particular host increase its chances of misconfiguration and mishandling. Container sprawl can drive up the costs of the public cloud environment. Large enterprises are at a higher risk of container sprawls than the Small and Medium-sized Enterprises (SMEs). Tracking and mapping of containers would soon become a necessity, as more and more applications are starting to get containerized. To counter the container sprawl, enterprises need to adopt an efficient DevOps and security strategy.
Opportunity: Rising adoption of IoT among various verticals
IoT has become the frontline technology due to its enormous business benefits. Multiple organizations across the globe are rapidly implementing IoT technology. The application container technology helps in realizing the real benefits of the IoT technology. Application containers offer features, such as the ability to migrate applications between IoT devices, enable application sign-ups and switch to different hosts, offer easy application upgrades, and provide simplicity and faster configuration, which are all well-suited for IoT technology. Application containers are also innately capable of running applications on IoT edge devices that consist of limited resources and majorly support lightweight OS. The demand for application containers in the IoT arena can be attributed to the need for frequent and fast IoT application updates at scale.
Challenge: Security risks associated with the application container technology
Committing to the application container technology could result in significant cost benefits and faster time-to-market, but it also presents various security challenges that need to be addressed. Application containers cannot isolate from the host operating system, as they share the same host OS as the other containers. There is a chance that if a hacker gains access to the host OS, it can breach the security of other containers as well. In addition to this, network hacking could lead to cross-container threats. Container-based security, like encryption services, can be challenging to attain, as users may have to build an Application Programming Interface (API) call from the containers to enable encryption services. Therefore, the whole application development process in containers need to be monitored continuously to minimize the risks and improve the security features.
Get online access to the report on the World's First Market Intelligence Cloud
- Easy to Download Historical Data & Forecast Numbers
- Company Analysis Dashboard for high growth potential opportunities
- Research Analyst Access for customization & queries
- Competitor Analysis with Interactive dashboard
- Latest News, Updates & Trend analysis
Request Sample Scope of the Report
:
Get online access to the report on the World's First Market Intelligence Cloud
- Easy to Download Historical Data & Forecast Numbers
- Company Analysis Dashboard for high growth potential opportunities
- Research Analyst Access for customization & queries
- Competitor Analysis with Interactive dashboard
- Latest News, Updates & Trend analysis

|
Report Metric |
Details |
|
Market size available for years |
2016�2023 |
|
Base year considered |
2017 |
|
Forecast period |
2018�2023 |
|
Forecast units |
USD Million (Value) |
|
Segments covered |
Platform, Service, Deployment Mode, Organization Size, ndustry Vertical, and Region |
|
Geographies covered |
North America, Europe, Asia Pacific (APAC), Latin America, and the Middle East and Africa (MEA) |
|
Companies covered |
IBM (US), AWS (US), Microsoft (US), Google (US), VMware (US), Apprenda (US), Joyent (US), Rancher Labs (US), SUSE (Germany), Sysdig (US), Jelastic (US), Kontena (Finland), Mesosphere (US), Puppet (US), Twistlock (US), Weaveworks (UK), CA Technologies (US), Oracle (US), Nimble Storage (US), BlueData (US), Apcera (US), Cisco (US), Red Hat (US), Docker (US), and Portworx (US) |
The study includes platform, service, deployment mode, application area, organization size, vertical, and region segments to arrive at the global application container market size during the forecast period.
By Service:
- Consulting
- Container monitoring
- Container security
- Container data management
- Container networking
- Container orchestration
- Support and maintenance
By Deployment Mode:
- Cloud
- On-premises
By Organization Size:
- SMEs
- Large enterprises
By Application Area
- Production
- Collaboration
- Modernization
- Others (resource optimization and content management)
By Vertical
- BFSI
- Healthcare and life science
- Telecommunication and IT
- Retail and e-commerce
- Education
- Media and entertainment
- Others (manufacturing, utilities, transportation and logistics, travel and hospitality, and government)
By Region:
- North America (US, Canada)
- Europe (UK, Germany, France, Rest of Europe)
- APAC (Australia & New Zealand, China, Japan, Singapore, Rest of Asia Pacific)
- MEA (Kingdom of Saudi Arabia, United Arab Emirates, Qatar, South Africa, Rest of Middle East and Africa)
- Latin America (Brazil Mexico, Rest of Latin America)
Key Market Players
IBM (US), Amazon Web Services (AWS) (US), Microsoft (US), Google (US), VMware (US)
Recent Developments
- In December 2017, AWS announced the launch of the AWS EU (Paris) Region. The AWS EU Region is the company�s fourth in Europe, joining the existing regions in Germany, Ireland, and the UK. Thousands of French customers already use AWS in other areas, and developers, startups, enterprises, as well as government, education, and non-profit organizations, would be able to leverage AWS to run applications and store data in France.
- In August 2017, Microsoft and Red Hat expanded their strategic partnership to help enterprises quickly adopt containers. As per the partnership, the Red Hat container service would support Microsoft services, such as native support for Windows Server containers on Red Hat OpenShift Container Platform, Red Hat OpenShift Dedicated on Microsoft Azure, and SQL Server on Red Hat Enterprise Linux and OpenShift.
- In June 2017, Apcera announced that the Apcera Platform had achieved �VMware Ready� status, which would enable end-users to use VMware vSphere 6 for production environments. The use of the Apcera Platform with vSphere 6 would help enterprises modernize their legacy applications.
- In April 2017, IBM announced that the Docker Enterprise Edition (EE) is available for Linux on IBM zSystems, LinuxONE, and Power Systems. It would provide enterprises advanced performance and flexibility for developing and deploying business-critical applications across hybrid cloud environments. LinuxONE and z Systems can support up to 1 million Docker containers on a single system, with high levels of security.
- In March 2017, Cisco acquired AppDynamics, a US-based software provider of application and business performance monitoring. The acquisition is aimed at reinforcing Cisco's strategic direction and shift toward software-centric solutions.
Key questions addressed in the report
- Which regions are likely to grow at the highest CAGR?
- What are the recent trends affecting the application container market?
- Who are the key players in the market, and how intense is the competition?
- What are the key implementation areas of application management?
- What are the challenges hindering the adoption of application management services?
To speak to our analyst for a discussion on the above findings, click Speak to Analyst
Table of Contents
1 Introduction (Page No. - 17)
1.1 Objectives of the Study
1.1.1 Business Intelligence
1.1.2 Competitive Intelligence
1.2 Market Definition
1.3 Market Scope
1.4 Years Considered for the Study
1.5 Currency
1.6 Stakeholders
2 Research Methodology (Page No. - 21)
2.1 Research Data
2.1.1 Research Methodology
2.1.1.1 Breakdown of Primaries
2.1.1.2 Key Industry Insights
2.2 Market Size Estimation
2.3 Assumptions
2.4 Limitations
3 Executive Summary (Page No. - 28)
4 Premium Insights (Page No. - 34)
4.1 Attractive Market Opportunities in the Global Market
4.2 Application Container Market, By Service, 2018 vs 2023
4.3 Market, By Deployment Mode, 2018 vs 2023
4.4 Market, By Organization Size, 2018 vs 2023
4.5 Market, By Vertical, 2018�2023
4.6 Market, Market Share Across Various Regions
4.7 Market Investment Scenario
5 Market Overview and Industry Trends (Page No. - 38)
5.1 Introduction
5.2 Market Dynamics
5.2.1 Drivers
5.2.1.1 Growing Need for Business Agility and Faster Time-To-Market
5.2.1.2 Gaining Momentum in Microservices Architecture
5.2.1.3 Large-Scale Modernization of Existing Business-Critical Applications
5.2.1.4 Wide Presence of Open Source Vendors Offering Application Container-Based Services
5.2.2 Restraints
5.2.2.1 Emergence of Application Container Sprawl
5.2.3 Opportunities
5.2.3.1 SMES� Increasing Investment in Technologies
5.2.3.2 Rising Adoption of IoT Among Various Verticals
5.2.4 Challenges
5.2.4.1 Security Risks Associated With the Application Container Technology
5.2.4.2 Presence of Skill Gap in the Market
5.3 Virtual Machines vs Application Containers
5.4 Container Technology Life Cycle
5.5 Application Container Use Cases
6 Application Container Platforms (Page No. - 45)
6.1 Introduction
6.2 Docker Swarm
6.3 Kubernetes
6.4 AWS ECS
6.5 Mesos
6.6 Hashicorp Nomad
6.7 Cloud Foundry
6.8 Openstack Magnum
6.9 Azure Container
6.10 Internally Developed Tools
7 Application Container Market, By Service (Page No. - 48)
7.1 Introduction
7.2 Consulting
7.3 Container Monitoring
7.4 Container Security
7.5 Container Data Management
7.6 Container Networking
7.7 Container Orchestration
7.8 Support and Maintenance
8 Application Container Market, By Deployment Mode (Page No. - 56)
8.1 Introduction
8.2 Cloud
8.3 Private Cloud
8.4 Public Cloud
8.5 On-Premises
9 Application Container Market, By Application Area (Page No. - 61)
9.1 Introduction
9.2 Production
9.3 Collaboration
9.4 Modernization
9.5 Others
10 Application Container Market, By Organization Size (Page No. - 67)
10.1 Introduction
10.2 Small and Medium-Sized Enterprises
10.3 Large Enterprises
11 Application Container Market, By Vertical (Page No. - 71)
11.1 Introduction
11.2 Banking, Financial Services, and Insurance
11.3 Healthcare and Life Sciences
11.4 Telecommunications and IT
11.5 Retail and Ecommerce
11.6 Education
11.7 Media and Entertainment
11.8 Others
12 Application Container Market, By Region (Page No. - 80)
12.1 Introduction
12.2 North America
12.2.1 United States
12.2.2 Canada
12.3 Europe
12.3.1 United Kingdom
12.3.2 Germany
12.3.3 France
12.3.4 Rest of Europe
12.4 Asia Pacific
12.4.1 Australia and New Zealand
12.4.2 China
12.4.3 Japan
12.4.4 Singapore
12.4.5 Rest of Asia Pacific
12.5 Middle East and Africa
12.5.1 Kingdom of Saudi Arabia
12.5.2 United Arab Emirates
12.5.3 Qatar
12.5.4 South Africa
12.5.5 Rest of Middle East and Africa
12.6 Latin America
12.6.1 Brazil
12.6.2 Mexico
12.6.3 Rest of Latin America
13 Competitive Landscape (Page No. - 105)
13.1 Overview
13.2 Market Ranking Analysis for the Application Container Market
13.3 Competitive Scenario
13.3.1 New Service/Product Launches
13.3.2 Business Expansions
13.3.3 Mergers and Acquisitions
13.3.4 Agreements and Partnerships
14 Company Profiles (Page No. - 111)
(Business Overview, Products & Services, Key Insights, Recent Developments, SWOT Analysis, MnM View)*
14.1 AWS
14.2 IBM
14.3 Microsoft
14.4 Apcera
14.5 Cisco
14.6 Red Hat
14.7 Docker
14.8 Google
14.9 VMware
14.10 Apprenda
14.11 Joyent
14.12 Rancher Labs
14.13 SUSE
14.14 Sysdig
14.15 Jelastic
14.16 Kontena
14.17 Mesosphere
14.18 Puppet Enterprise
14.19 Twistlock
14.20 Weaveworks
14.21 CA Technologies
14.22 Oracle
14.23 Nimble Storage (An HPE Company)
14.24 BlueData
14.25 Portworx
15 Appendix (Page No. - 170)
15.1 Discussion Guide
15.2 Knowledge Store: Marketsandmarkets� Subscription Portal
15.3 Introducing RT: Real-Time Market Intelligence
15.4 Available Customization
15.5 Related Reports
15.6 Author Details
*Details on Business Overview, Products & Services, Key Insights, Recent Developments, SWOT Analysis, MnM View Might Not Be Captured in Case of Unlisted Companies.
List of Tables (75 Tables)
Table 1 United States Dollar Exchange Rate, 2014�2017
Table 2 Virtual Machines vs Application Containers
Table 3 Application Container Use Cases
Table 4 Services: Application Container Market Size, By Type, 2016�2023 (USD Million)
Table 5 Services: Market Size, By Region, 2016�2023 (USD Million)
Table 6 Consulting: Market Size, By Region, 2016�2023 (USD Million)
Table 7 Container Monitoring: Market Size, By Region, 2016�2023 (USD Million)
Table 8 Container Security: Market Size, By Region, 2016�2023 (USD Million)
Table 9 Container Data Management: Market Size, By Region, 2016�2023 (USD Million)
Table 10 Container Networking: Market Size, By Region, 2016�2023 (USD Million)
Table 11 Container Orchestration: Market Size, By Region, 2016�2023 (USD Million)
Table 12 Support and Maintenance: Market Size, By Region, 2016�2023 (USD Million)
Table 13 Application Container Market Size, By Deployment Mode, 2016�2023 (USD Million)
Table 14 Cloud: Market Size, By Type, 2016�2023 (USD Million)
Table 15 Cloud: Market Size, By Region, 2016�2023 (USD Million)
Table 16 Private Cloud Market Size, By Region, 2016�2023 (USD Million)
Table 17 Public Cloud Market Size, By Region, 2016�2023 (USD Million)
Table 18 On-Premises: Market Size, By Region, 2016�2023 (USD Million)
Table 19 Application Container Market Size, By Application Area, 2016�2023 (USD Million)
Table 20 Production: Market Size, By Region, 2016�2023 (USD Million)
Table 21 Collaboration: Market Size, By Region, 2016�2023 (USD Million)
Table 22 Modernization: Market Size, By Region, 2016�2023 (USD Million)
Table 23 Others: Market Size, By Region, 2016�2023 (USD Million)
Table 24 Application Container Market Size, By Organization Size, 2016�2023 (USD Million)
Table 25 Small and Medium-Sized Enterprises: Market Size, By Region, 2016�2023 (USD Million)
Table 26 Large Enterprises: Market Size, By Region, 2016�2023 (USD Million)
Table 27 Application Container Market Size, By Vertical, 2016�2023 (USD Million)
Table 28 Banking, Financial Services, and Insurance: Market Size, By Region, 2016�2023 (USD Million)
Table 29 Healthcare and Life Sciences: Market Size, By Region, 2016�2023 (USD Million)
Table 30 Telecommunications and IT: Market Size, By Region, 2016�2023 (USD Million)
Table 31 Retail and Ecommerce: Market Size, By Region, 2016�2023 (USD Million)
Table 32 Education: Market Size, By Region, 2016�2023 (USD Million)
Table 33 Media and Entertainment: Market Size, By Region, 2016�2023 (USD Million)
Table 34 Others: Market Size, By Region, 2016�2023 (USD Million)
Table 35 Application Container Market Size, By Region, 2016�2023 (USD Million)
Table 36 North America: Application Container Market Size, By Country, 2016�2023 (USD Million)
Table 37 North America: Market Size, By Service, 2016�2023 (USD Million)
Table 38 North America: Market Size, By Deployment Mode, 2016�2023 (USD Million)
Table 39 North America: Market Size, By Cloud, 2016�2023 (USD Million)
Table 40 North America: Market Size, By Application Area, 2016�2023 (USD Million)
Table 41 North America: Market Size, By Organization Size, 2016�2023 (USD Million)
Table 42 North America: Market Size, By Vertical, 2016�2023 (USD Million)
Table 43 Europe: Application Container Market Size, By Country, 2016�2023 (USD Million)
Table 44 Europe: Market Size, By Service, 2016�2023 (USD Million)
Table 45 Europe: Market Size, By Deployment Mode, 2016�2023 (USD Million)
Table 46 Europe: Market Size, By Cloud, 2016�2023 (USD Million)
Table 47 Europe: Market Size, By Application Area, 2016�2023 (USD Million)
Table 48 Europe: Market Size, By Organization Size, 2016�2023 (USD Million)
Table 49 Europe: Market Size, By Vertical, 2016�2023 (USD Million)
Table 50 Asia Pacific: Application Container Market Size, By Country, 2016�2023 (USD Million)
Table 51 Asia Pacific: Market Size, By Service, 2016�2023 (USD Million)
Table 52 Asia Pacific: Market Size, By Deployment Mode, 2016�2023 (USD Million)
Table 53 Asia Pacific: Market Size, By Cloud, 2016�2023 (USD Million)
Table 54 Asia Pacific: Market Size, By Application Area, 2016�2023 (USD Million)
Table 55 Asia Pacific: Market Size, By Organization Size, 2016�2023 (USD Million)
Table 56 Asia Pacific: Market Size, By Vertical, 2016�2023 (USD Million)
Table 57 Middle East and Africa: Application Container Market Size, By Country, 2016�2023 (USD Million)
Table 58 Middle East and Africa: Market Size, By Service, 2016�2023 (USD Million)
Table 59 Middle East and Africa: Market Size, By Deployment Mode, 2016�2023 (USD Million)
Table 60 Middle East and Africa: Market Size, By Cloud, 2016�2023 (USD Million)
Table 61 Middle East and Africa: Market Size, By Application Area, 2016�2023 (USD Million)
Table 62 Middle East and Africa: Market Size, By Organization Size, 2016�2023 (USD Million)
Table 63 Middle East and Africa: Market Size, By Vertical, 2016�2023 (USD Million)
Table 64 Latin America: Application Container Market Size, By Country, 2016�2023 (USD Million)
Table 65 Latin America: Market Size, By Service, 2016�2023 (USD Million)
Table 66 Latin America: Market Size, By Deployment Mode, 2016�2023 (USD Million)
Table 67 Latin America: Market Size, By Cloud, 2016�2023 (USD Million)
Table 68 Latin America: Market Size, By Application Area, 2016�2023 (USD Million)
Table 69 Latin America: Market Size, By Organization Size, 2016�2023 (USD Million)
Table 70 Latin America: Market Size, By Vertical, 2016�2023 (USD Million)
Table 71 Market Ranking, 2018
Table 72 New Service/Product Launches, 2016�2017
Table 73 Business Expansions, 2015�2017
Table 74 Mergers and Acquisitions, 2016�2018
Table 75 Agreements and Partnerships, 2016�2017
List of Figures (49 Figures)
Figure 1 Global Application Container Market: Market Segmentation
Figure 2 Global Market: Regional Scope
Figure 3 Global Market: Research Design
Figure 4 Breakdown of Primary Interviews: By Company, Designation, and Region
Figure 5 Data Triangulation
Figure 6 Market Size Estimation Methodology: Bottom-Up Approach
Figure 7 Market Size Estimation Methodology: Top-Down Approach
Figure 8 Application Container Evolution
Figure 9 Application Container Market Size, 2016�2023
Figure 10 Market Analysis
Figure 11 Fastest Growing Segments in the Market, 2018�2023
Figure 12 Large Scale Modernization of Legacy Applications is Expected to Drive the Growth of the Application Container Market
Figure 13 Container Orchestration Service is Expected to Hold the Largest Market Share During the Forecast Period
Figure 14 Cloud Deployment Mode is Expected to Hold the Larger Market Share During the Forecast Period
Figure 15 Large Enterprises Segment is Expected to Hold the Larger Market Share During the Forecast Period
Figure 16 Banking, Financial Services, and Insurance Vertical is Expected to Hold the Largest Market Share During the Forecast Period
Figure 17 North America is Estimated to Hold the Largest Market Size in 2018
Figure 18 Market Investment Scenario
Figure 19 Drivers, Restraints, Opportunities, and Challenges
Figure 20 Container Technology Architecture and Life Cycle Phases
Figure 21 Kubernetes and Docker Swarm are Expected to Be the Most Adopted Container Platforms, 2018
Figure 22 Container Security Segment is Expected to Grow at the Highest CAGR During the Forecast Period
Figure 23 Container Network Model
Figure 24 Cloud Deployment Mode is Expected to Grow at the Higher CAGR During the Forecast Period
Figure 25 Modernization Application Area is Expected to Grow at the Highest CAGR During the Forecast Period
Figure 26 Small and Medium-Sized Enterprises Segment is Expected to Grow at A Higher CAGR During the Forecast Period
Figure 27 Banking, Financial Services, and Insurance Vertical is Expected to Grow at the Highest CAGR During the Forecast Period
Figure 28 Asia Pacific is Expected to Grow at the Highest CAGR During the Forecast Period
Figure 29 Asia Pacific: A Hotspot in the Application Container Market During the Forecast Period
Figure 30 North America: Market Snapshot
Figure 31 Asia Pacific: Market Snapshot
Figure 32 Key Developments By Leading Players in the Application Container Market During 2016�2018
Figure 33 Market Evaluation Framework
Figure 34 AWS: Company Snapshot
Figure 35 AWS: SWOT Analysis
Figure 36 IBM: Company Snapshot
Figure 37 IBM: SWOT Analysis
Figure 38 Microsoft: Company Snapshot
Figure 39 Microsoft: SWOT Analysis
Figure 40 Apcera: SWOT Analysis
Figure 41 Cisco: Company Snapshot
Figure 42 Cisco: SWOT Analysis
Figure 43 Red Hat: Company Snapshot
Figure 44 Docker: SWOT Analysis
Figure 45 Google: Company Snapshot
Figure 46 Google: SWOT Analysis
Figure 47 VMware: Company Snapshot
Figure 48 CA Technologies: Company Snapshot
Figure 49 Oracle: Company Snapshot


Growth opportunities and latent adjacency in Application Container Market