Aromatic Solvents Market by Type (Toluene Solvents, Xylene Solvents and Ethylbenzene Solvents), Application (Paints & Coatings, Printing Inks, Adhesives, Cleaning & Degreasing) and Region (APAC, North America, Europe) - Global Forecast to 2023


[103 Pages Report] The aromatic solvents market size was USD 5.78 billion in 2017 and is projected to reach 8.29 billion by 2023, at a CAGR of 2.66% during the forecast period. The base year considered for the study is 2017 while the forecast period is from 2018 to 2023.
Objectives of the report are as follows:
- To define, describe, and forecast the market size of aromatic solvents, in terms of value and volume
- To provide detailed information regarding the major factors (drivers, opportunities, restraints, and challenges) influencing the growth of the market
- To estimate and forecast the market size by type, application, and region
- To forecast the size of the market with respect to five main regions, namely, North America, Europe, Asia Pacific (APAC), South America, and the Middle East & Africa
- To analyze opportunities in the market for stakeholders and provide a competitive landscape of the market leaders
- To track and analyze recent developments such as expansions and acquisitions in the market
- To strategically profile the key market players and comprehensively analyze their core competencies
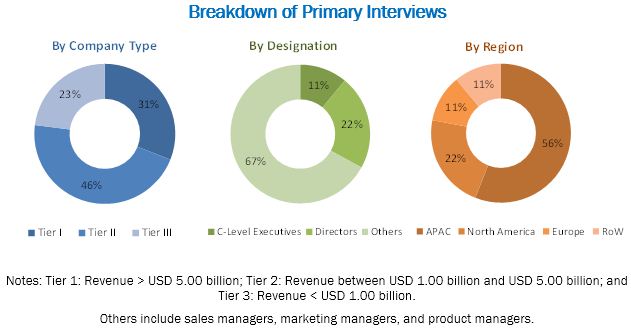
Both top-down and bottom-up approaches have been implemented to estimate and project the size of the aromatic solvents market during the forecast period. The size of the aromatic solvents market has been calculated, and weightages have been assigned to various market segments. This has been performed based on extensive primary interviews and secondary research of the information available on the websites of various associations such as the European Environmental Protection Agency (EPA), European Solvents Industry Group (ESIG), European Solvents Volatile Organic Compounds Coordination Group (ESVOC CG), Registration, Evaluation, Authorisation and Restriction of Chemicals (REACH), Gulf Petrochemicals & Chemicals Association (GPCA), American Institute of Chemical Engineers (AIChE), The European Chemical Industry Council (CEFIC), and International Organization of Motor Vehicle Manufacturers (OICA). Primary research includes extensive interviews with key personnel, such as chief executive officers, vice presidents, directors, and executives of the leading players in the aromatic solvents markets. After arriving at the overall market size, the total market has been split into several segments and subsegments. Data triangulation and market breakdown procedures have been employed to complete the overall market engineering process and arrive at the exact statistics for all segments and subsegments. The breakdown of profiles of primary respondents has been depicted in the figure below.
To know about the assumptions considered for the study, download the pdf brochure
The ecosystem of the aromatic solvents market comprises end users, producers & suppliers, and manufacturers of solvents such as China Petroleum and Chemical Corporation (China), Royal Dutch Shell Plc (Netherlands), ExxonMobil Corporation (US), LyondellBasell Industries Holdings B.V. (Netherlands), BASF SE (Germany), SK Global Chemical Co., Ltd. (South Korea), China National Petroleum Corporation (China), Reliance Industries Limited (India), Chinese Petroleum Corporation (Taiwan), and Total S.A. (France).
Target Audience:
- Industrial aromatic solvent manufacturers, dealers, and suppliers
- Government bodies
- End users
- Feedstock suppliers
- Large infrastructure companies
- Investment banks
- Consulting companies/consultants in chemical and material sectors
- Industry associations
- Research and consulting firms
�The study answers several questions for stakeholders, primarily, the market segments they need to focus upon during the next 2 to 5 years to prioritize their efforts and investments.�
Scopeof the Report
The research report categorizes the aromatic solvents market into the following segments:
Aromatic Solvents Market, by Type
- Toluene Solvents
- Xylene Solvents
- Ethylbenzene Solvents
Aromatic Solvents Market, by Application
- Paints & Coatings
- Adhesives
- Printing Inks
- Cleaning & Degreasing
- Others
Aromatic solvents Market, by Region:
- North America
- Europe
- Asia Pacific
- South America
- Middle East & Africa
Available Customizations
With the given market data, MarketsandMarkets offers customizations according to client-specific needs.
- Detailed analysis and profiles of additional market players (up to five)
The aromatic solvents market is projected to grow from USD 7.27 billion in 2018 to USD 8.29 billion by 2023, at a CAGR of 2.66% during the forecast period. Aromatic solvent is a type of hydrocarbon that has alternating double and single bonds between carbon atoms, which form rings. Aromatic solvents are powerful solvents for organic liquids. Hence, they are widely used in a variety of industries such as paints, petrochemicals, nail polish removers, cleaners, adhesives, dyes, and varnishes.
The aromatic solvents market has been segmented on the basis of type, application, and region. Based on type, the market has been segmented into toluene solvents, xylene solvents, and ethylbenzene solvents. The toluene solvents segment accounted for the largest market share, in terms of value, in 2017. The high solvency power and low-toxicity of toluene solvents and xylene solvents are expected to increase their usage in various applications such as paints & coatings, printing inks, adhesives, and cleaning & degreasing.
Based on application, the aromatic solvents market has been segmented into paints & coatings, adhesives, printing inks, cleaning & degreasing, and others. The paints & coatings segment accounted for the largest market share, in terms of value, in 2017. The growth of the automotive OEM, machinery, and appliances markets, globally accompanied by the rise in building & construction activities are expected to drive the demand in this application during the forecast period.
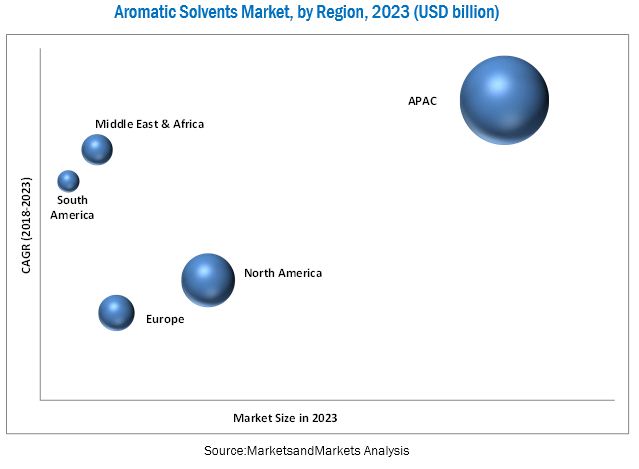
Asia Pacific is estimated to be the largest market for aromatic solvents in 2018, and the region is also expected to continue to lead the market till 2023, owing to the growing industries in the region�s emerging economies such China, South Korea, and India. The rising per capita disposable incomes, rapid urbanization, and growing demand for automobiles are projected to fuel the aromatic solvents market.
The aromatic solvents market is a consolidated market with exceedingly large players possessing large production capacities. A few players in the aromatic solvents market have integrated both backward and forward to obtain cost advantages. Due to low product differentiation, the product quality does not have an impact on the market. Thus, the intensity of competition in the aromatic solvents market is low. The fluctuating prices of raw materials adversely impact the overall cost of production incurred by the manufacturers of solvents. High capital costs coupled with the licensing of proprietary technology restrict the entry of new players into the market.
Expansion was the major developmental strategy adopted between 2013 and 2018 by the key players in the aromatic solvents market. Companies such as Royal Dutch Shell Plc. (Netherlands), SK Global Chemical Co., Ltd. (South Korea), and ExxonMobil Corporation (US) have adopted these strategies to strengthen their market presence and customer base as well as gain a competitive edge in the market.
To speak to our analyst for a discussion on the above findings, click Speak to Analyst
Table of Contents
1 Introduction (Page No. - 14)
1.1 Objectives of the Study
1.2 Market Definition
1.3 Market Scope
1.3.1 Years Considered for the Study
1.4 Currency
1.5 Unit Considered
1.6 Limitations
1.7 Stakeholders
2 Research Methodology (Page No. - 17)
2.1 Research Data
2.1.1 Secondary Data
2.1.1.1 Key Data From Secondary Sources
2.1.2 Primary Data
2.1.2.1 Key Data From Primary Sources
2.1.2.2 Breakdown of Primary Interviews
2.2 Market Size Estimation
2.2.1 Bottom-Up Approach
2.2.2 Top-Down Approach
2.3 Data Triangulation
2.4 Assumptions
3 Executive Summary (Page No. - 24)
4 Premium Insights (Page No. - 26)
4.1 Attractive Opportunities in the Aromatic Solvents Market
4.2 Aromatic Solvents Market, By Region
4.3 Aromatic Solvents Market Overview
4.4 Aromatic Solvents Market, By Type
5 Market Overview (Page No. - 28)
5.1 Introduction
5.2 Market Dynamics
5.2.1 Drivers
5.2.1.1 High Demand From the Construction and Automotive Industries
5.2.2 Restraints
5.2.2.1 Industries Shifting Focus on Green Solvents
5.2.3 Opportunities
5.2.3.1 Growing Opportunities From the Emerging Economies
5.2.4 Challenges
5.2.4.1 Harmful Effects of Aromatic Solvents
5.3 Porter�s Five Forces Analysis: Aromatic Solvents Market
5.3.1 Threat 0f New Entrants
5.3.2 Threat of Substitutes
5.3.3 Bargaining Power of Buyers
5.3.4 Bargaining Power of Suppliers
5.3.5 Intensity of Competitive Rivalry
5.4 Macroeconomic Indicators
5.4.1 GDP of Major Economies in Terms of PPP
5.4.2 Trends and Forecast of Automotive Industry and Its Impact on the Aromatic Solvents Market
6 Aromatic Solvents Market, By Type (Page No. - 35)
6.1 Introduction
6.2 Toluene
6.3 Xylene
6.3.1 Para-Xylene
6.3.2 Mixed Xylene
6.4 Ethylbenzene
7 Aromatic Solvents Market, By Application (Page No. - 43)
7.1 Introduction
7.2 Applications of Toluene Solvents
7.2.1 Paints & Coatings
7.2.2 Adhesives
7.2.3 Printing Inks
7.2.4 Others
7.3 Applications of Xylene Solvents
7.3.1 Paints & Coatings
7.3.2 Adhesives
7.3.3 Cleaning & Degreasing
7.3.4 Others
7.4 Applications of Ethylbenzene Solvents
7.4.1 Paints & Coatings
7.4.2 Cleaning & Degreasing
7.4.3 Others
8 Aromatic Solvents Market, By Region (Page No. - 58)
8.1 Introduction
8.2 APAC
8.3 Europe
8.4 North America
8.5 Middle East & Africa
8.6 South America
9 Competitive Landscape (Page No. - 74)
9.1 Overview
9.2 Market Ranking Analysis
9.2.1 China Petroleum & Chemical Corporation
9.2.2 Exxonmobil Corporation
9.2.3 SK Global Chemical Co., Ltd.
9.3 Competitive Situations and Trends
9.3.1 Expansions
9.3.2 Agreements
9.3.3 Acquisitions
10 Company Profiles (Page No. - 80)
(Business Overview, Products Offered, Recent Developments, SWOT Analysis, MnM View)*
10.1 China Petroleum & Chemical Corporation
10.2 Exxonmobil Corporation
10.3 SK Global Chemical Co., Ltd.
10.4 Royal Dutch Shell PLC
10.5 BASF SE
10.6 Lyondellbasell Industries Holdings B.V.
10.7 China National Petroleum Corporation (CNPC)
10.8 Reliance Industries Limited (RIL)
10.9 Total S.A.
10.10 Chinese Petroleum Corporation (CPC)
*Details on Business Overview, Products Offered, Recent Developments, SWOT Analysis, MnM View Might Not Be Captured in Case of Unlisted Companies.
10.11 Other Market Players
10.11.1 Bharat Petroleum Corporation Limited
10.11.2 Chevron Phillips Chemical Co.
10.11.3 Formosa Chemicals & Fibre Corporation
10.11.4 Gotham Industries
10.11.5 Haltermann Carless
10.11.6 Indian Oil Corporation Limited
10.11.7 Pon Pure Chemicals Group
10.11.8 Recochem Inc.
10.11.9 Top Solvent Co., Ltd.
10.11.10 W.M. Barr & Company Inc.
11 Appendix (Page No. - 102)
11.1 Insights of Industry Experts
11.2 Discussion Guide
11.3 Introducing RT: Real-Time Market Intelligence
11.4 Knowledge Store: Marketsandmarkets� Subscription Portal
11.5 Available Customizations
11.6 Related Reports
11.7 Author Details
List of Tables (87 Tables)
Table 1 Top 10 Economies By GDP in PPP Terms, 2017
Table 2 GDP of Major Economies, in Terms of PPP, 2016-2023 (USD Billion)
Table 3 Aromatic Solvents Market Size, By Type, 2016�2023 (Kiloton)
Table 4 Aromatic Solvents Market Size, By Type, 2016�2023 (USD Million)
Table 5 Toluene: General Properties
Table 6 Toluene Solvents Market Size, By Region, 2016�2023 (Kiloton)
Table 7 Toluene Solvents Market Size, By Region, 2016�2023 (USD Million)
Table 8 Xylene Solvents Market Size, By Region, 2016�2023 (Kiloton)
Table 9 Xylene Solvents Market Size, By Region, 2016�2023 (USD Million)
Table 10 Para-Xylene: General Properties
Table 11 Mixed Xylene: General Properties
Table 12 Ethylbenzene: General Properties
Table 13 Ethylbenzene Solvents Market Size, By Region, 2016�2023 (Kiloton)
Table 14 Ethylbenzene Solvents Market Size, By Region, 2016�2023 (USD Million)
Table 15 Toluene Solvents Market Size, By Application, 2016�2023 (Kiloton)
Table 16 Toluene Solvents Market Size, By Application, 2016�2023 (USD Million)
Table 17 Toluene Solvents Market Size in Paints & Coatings Application, By Region, 2016�2023 (Kiloton)
Table 18 Toluene Solvents Market Size in Paints & Coatings Application, By Region, 2016�2023 (USD Million)
Table 19 Toluene Solvents Market Size in Adhesives Application, By Region, 2016�2023 (Kiloton)
Table 20 Toluene Solvents Market Size in Adhesives Application, By Region, 2016�2023 (USD Million)
Table 21 Toluene Solvents Market Size in Printing Inks Application, By Region, 2016�2023 (Kiloton)
Table 22 Toluene Solvents Market Size in Printing Inks Application, By Region, 2016�2023 (USD Million)
Table 23 Toluene Solvents Market Size in Other Applications, By Region, 2016�2023 (Kiloton)
Table 24 Toluene Solvents Market Size in Other Applications, By Region, 2016�2023 (USD Million)
Table 25 Xylene Solvents Market Size, By Application, 2016�2023 (Kiloton)
Table 26 Xylene Solvents Market Size, By Application, 2016�2023 (USD Million)
Table 27 Xylene Solvents Market Size in Paints & Coatings Application, By Region, 2016�2023 (Kiloton)
Table 28 Xylene Solvents Market Size in Paints & Coatings Application, By Region, 2016�2023 (USD Million)
Table 29 Xylene Solvents Market Size in Adhesives Application, By Region, 2016�2023 (Kiloton)
Table 30 Xylene Solvents Market Size in Adhesives Application, By Region, 2016�2023 (USD Million)
Table 31 Xylene Solvents Market Size in Cleaning & Degreasing Application, By Region, 2016�2023 (Kiloton)
Table 32 Xylene Solvents Market Size in Cleaning & Degreasing Application, By Region, 2016�2023 (USD Million)
Table 33 Xylene Solvents Market Size in Other Applications, By Region, 2016�2023 (Kiloton)
Table 34 Xylene Solvents Market Size in Other Applications, By Region, 2016�2023 (USD Million)
Table 35 Ethylbenzene Solvents Market Size, By Application, 2016�2023 (Kiloton)
Table 36 Ethylbenzene Solvents Market Size, By Application, 2016�2023 (USD Million)
Table 37 Ethylbenzene Solvents Market Size in Paints & Coatings Application, By Region, 2016�2023 (Kiloton)
Table 38 Ethylbenzene Solvents Market Size in Paints & Coatings Application, By Region, 2016�2023 (USD Million)
Table 39 Ethylbenzene Solvents Market Size in Cleaning & Degreasing Application, By Region, 2016�2023 (Kiloton)
Table 40 Ethylbenzene Solvents Market Size in Cleaning & Degreasing Application, By Region, 2016�2023 (USD Million)
Table 41 Ethylbenzene Solvents Market Size in Other Applications, By Region, 2016�2023 (Kiloton)
Table 42 Ethylbenzene Solvents Market Size in Other Applications, By Region, 2016�2023 (USD Million)
Table 43 Aromatic Solvents Market Size, By Region, 2016�2023 (Kiloton)
Table 44 Aromatic Solvents Market Size, By Region, 2016�2023 (USD Million)
Table 45 APAC: Aromatic Solvents Market Size, By Type, 2016�2023 (Kiloton)
Table 46 APAC: Aromatic Solvents Market Size, By Type, 2016�2023 (USD Million)
Table 47 APAC: Toluene Solvents Market Size, By Application, 2016�2023 (Kiloton)
Table 48 APAC: Toluene Solvents Market Size, By Application, 2016�2023 (USD Million)
Table 49 APAC: Xylene Solvents Market Size, By Application, 2016�2023 (Kiloton)
Table 50 APAC: Xylene Solvents Market Size, By Application, 2016�2023 (USD Million)
Table 51 APAC: Ethylbenzene Solvents Market Size, By Application, 2016�2023 (Kiloton)
Table 52 APAC: Ethylbenzene Solvents Market Size, By Application, 2016�2023 (USD Million)
Table 53 Europe: Aromatic Solvents Market Size, By Type, 2016�2023 (Kiloton)
Table 54 Europe: Aromatic Solvents Market Size, By Type, 2016�2023 (USD Million)
Table 55 Europe: Toluene Solvents Market Size, By Application, 2016�2023 (Kiloton)
Table 56 Europe: Toluene Solvents Market Size, By Application, 2016�2023 (USD Million)
Table 57 Europe: Xylene Solvents Market Size, By Application, 2016�2023 (Kiloton)
Table 58 Europe: Xylene Solvents Market Size, By Application, 2016�2023 (USD Million)
Table 59 Europe: Ethylbenzene Solvents Market Size, By Application, 2016�2023 (Kiloton)
Table 60 Europe: Ethylbenzene Solvents Market Size, By Application, 2016�2023 (USD Million)
Table 61 North America: Aromatic Solvents Market Size, By Type, 2016�2023 (Kiloton)
Table 62 North America: Aromatic Solvents Market Size, By Type, 2016�2023 (USD Million)
Table 63 North America: Toluene Solvents Market Size, By Application, 2016�2023 (Kiloton)
Table 64 North America: Toluene Solvents Market Size, By Application, 2016�2023 (USD Million)
Table 65 North America: Xylene Solvents Market Size, By Application, 2016�2023 (Kiloton)
Table 66 North America: Xylene Solvents Market Size, By Application, 2016�2023 (USD Million)
Table 67 North America: Ethylbenzene Solvents Market Size, By Application, 2016�2023 (Kiloton)
Table 68 North America: Ethylbenene Solvents Market Size, By Application, 2016�2023 (USD Million)
Table 69 Middle East & Africa: Aromatic Solvents Market Size, By Type, 2016�2023 (Kiloton)
Table 70 Middle East & Africa: Aromatic Solvents Market Size, By Type, 2016�2023 (USD Million)
Table 71 Middle East & Africa: Toluene Solvents Market Size, By Application, 2016�2023 (Kiloton)
Table 72 Middle East & Africa: Toluene Solvents Market Size, By Application, 2016�2023 (USD Million)
Table 73 Middle East & Africa: Xylene Solvents Market Size, By Application, 2016�2023 (Kiloton)
Table 74 Middle East & Africa: Xylene Solvents Market Size, By Application, 2016�2023 (USD Million)
Table 75 Middle East & Africa: Ethylbenzene Solvents Market Size, By Application, 2016�2023 (Kiloton)
Table 76 Middle East & Africa: Ethylbenzene Solvents Market Size, By Application, 2016�2023 (USD Million)
Table 77 South America: Aromatic Solvents Market Size, By Type, 2016�2023 (Kiloton)
Table 78 South America: Aromatic Solvents Market Size, By Type, 2016�2023 (USD Million)
Table 79 South America: Toluene Solvents Market Size, By Application, 2016�2023 (Kiloton)
Table 80 South America: Toluene Solvents Market Size, By Application, 2016�2023 (USD Million)
Table 81 South America: Xylene Solvents Market Size, By Application, 2016�2023 (Kiloton)
Table 82 South America: Xylene Solvents Market Size, By Application, 2016�2023 (USD Million)
Table 83 South America: Ethylbenzene Solvents Market Size, By Application, 2016�2023 (Kiloton)
Table 84 South America: Ethylbenzene Solvents Market Size, By Application, 2016-2023 (USD Million)
Table 85 Expansions, 2013�2018
Table 86 Agreements, 2013�2018
Table 87 Acquisitions, 2013�2018
List of Figures (33 Figures)
Figure 1 Aromatic Solvents Market Segmentation
Figure 2 Aromatic Solvents Market: Research Design
Figure 3 Aromatic Solvents Market: Data Triangulation
Figure 4 Aromatic Solvents Market to Be Driven By the Increasing Demand for Toluene Solvents
Figure 5 APAC Was the Largest Aromatic Solvents Market in 2017
Figure 6 Growing Demand for Automobiles to Drive the Aromatic Solvents Market Between 2018 and 2023
Figure 7 APAC to Be the Largest Aromatic Solvents Market
Figure 8 APAC to Be the Fastest-Growing Aromatic Solvents Market
Figure 9 Toluene Was the Largest Type of Aromatic Solvents
Figure 10 Overview of Factors Governing the Aromatic Solvents Market
Figure 11 Porter�s Five Forces Analysis: Aromatic Solvents Market
Figure 12 World Motor Vehicle Production in 2017
Figure 13 Toluene Solvents to Dominate the Aromatic Solvents Market
Figure 14 APAC to Dominate the Toluene Solvents Market
Figure 15 APAC to Dominate the Xylene Solvents Market
Figure 16 APAC to Dominate the Ethylbenzene Solvents Market
Figure 17 Expansions Was the Key Growth Strategy Adopted By the Market Players Between 2013 and 2018
Figure 18 Market Ranking of Aromatic Solvents Manufacturers, 2017
Figure 19 China Petroleum & Chemical Corporation: Company Snapshot
Figure 20 China Petroleum & Chemical Corporation: SWOT Analysis
Figure 21 Exxonmobil Corporation: Company Snapshot
Figure 22 Exxonmobil Corporation: SWOT Analysis
Figure 23 SK Global Chemical Co., Ltd.: Company Snapshot
Figure 24 SK Global Chemical Co., Ltd: SWOT Analysis
Figure 25 Royal Dutch Shell PLC: Company Snapshot
Figure 26 Royal Dutch Shell PLC: SWOT Analysis
Figure 27 BASF SE: Company Snapshot
Figure 28 BASF SE: SWOT Analysis
Figure 29 Lyondellbasell Industries Holdings B.V.: Company Snapshot
Figure 30 China National Petroleum Corporation: Company Snapshot
Figure 31 Reliance Industries Limited: Company Snapshot
Figure 32 Total S.A.: Company Snapshot
Figure 33 Chinese Petroleum Corporation: Company Snapshot


Growth opportunities and latent adjacency in Aromatic Solvents Market