Automotive Sensors Market

Automotive Sensors Market Size, Share, Statistics and Industry Growth Analysis Report by Sales Channel (OEM, Aftermarket), Type (Temperature, Pressure, Oxygen, Position, Speed, Inertial, Image, Level, Chemical Sensors), Vehicle Type (Passenger Car, LCV, HCV), Application, Region - Global Forecast to 2028

Report Code: SE 2489 Oct, 2023, by marketsandmarkets.com

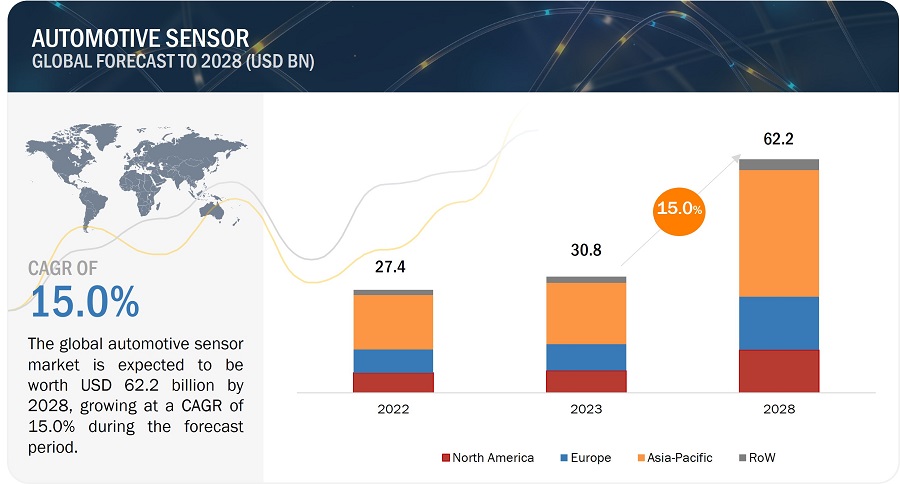
[354 Pages Report] The global automotive sensors market size is projected to grow from USD 30.8 billion in 2023 and is anticipated to be USD 62.2 billion by 2028, growing at a CAGR of 15.0% from 2023 to 2028. Growing focus on implementing vehicle authentication to ensure driver safety and comfort, Minimizing driver stress through adoption of advanced driver-assistance systems drives market growth during the forecast period. Factors such as growing adoption of EVs and HVs  to reduce CO2 emissions, increasing investments by automobile manufacturers in LiDAR technology provide market growth opportunities for the automotive sensors industry.
Automotive Sensors Market

Automotive Sensors Market

Automotive Sensors Market Forecast to 2028

To know about the assumptions considered for the study, Request for Free Sample Report

Automotive Sensor Market Dynamics

Driver: Advancements in sensor technologies to meet customer requirements

Sensors have become more compact, energy-efficient, and cost-effective, enabling seamless integration into various applications. Innovations, such as solid-state LiDAR, CMOS image sensors with enhanced resolution and low-light capabilities, and susceptible microelectromechanical systems (MEMS) accelerometers, have redefined the data collection and analysis landscape. These advancements have empowered businesses to gather real-time insights with unprecedented accuracy, driving efficiency gains, process optimization, and developing cutting-edge products and services that cater to evolving customer demands. The rise of electric and hybrid vehicles requires sensors to monitor battery health, temperature, charging status, and other critical parameters for optimal performance and safety. The demand for in-car infotainment, navigation, and connectivity features necessitates sensors, such as GPS and accelerometers, to provide accurate navigation data and enhance user experience.

Restraint: High cost of LiDAR automotive sensors

Automotive sensors come with a relatively high price tag, which can limit their widespread use. The cost is driven up due to the expensive raw materials, complex manufacturing processes, and increased demand for these sensors. This makes developing and implementing advanced sensor technologies difficult, especially in price-sensitive markets where the high cost can negatively impact adoption rates. Sensors are essential in vehicles for various functions, including safety, engine management, and comfort features. This diversity drives up costs due to the need to manufacture and integrate multiple sensor types within a single vehicle. Developing advanced sensor technologies demands substantial research, testing, and prototyping investment. Costs are incurred in exploring innovative sensor designs, materials, and functionalities to meet the evolving demands of the automotive industry. Rapid technological advancements lead to frequent updates and iterations of sensor designs. This ongoing innovation can inflate costs as manufacturers strive to stay at the forefront of sensor capabilities.

LiDAR sensors have become indispensable for advanced driver assistance systems (ADAS) and autonomous vehicles due to their accurate 3D mapping and object detection capabilities. However, their integration into the automotive industry has been limited due to the high cost of production. The automotive industry relies on mass production, whereas LiDAR sensors are typically manufactured at lower volumes, resulting in higher unit costs. Extensive investment in research and development, customization for automotive use, compliance with regulatory requirements, and adherence to performance standards all contribute to elevated expenses. Despite these barriers, industry efforts and innovations, such as solid-state LiDAR technology and increasing competition, are gradually driving cost reductions, promising more accessible LiDAR solutions for a broader spectrum of vehicles and applications in the future.

Opportunity: Rising demand for automotive aftermarket services

Aftermarket opportunities in the automotive sensors market referred to the potential for selling and installing sensor-based products and solutions in vehicles not equipped initially with those sensors by the manufacturer. This growth is driven by increased demand for safety features, the rising popularity of aftermarket car modifications, and the growing popularity of electric vehicles. Some specific aftermarket opportunities in the automotive sensor market are Blind spot monitoring systems, Lane departure warning systems, Parking sensors, Battery monitoring systems, and Solar charging systems. Older vehicles lack the advanced safety features that are now becoming standard in newer models. Aftermarket sensors can be installed to add features, such as lane departure warning, blind-spot detection, and collision avoidance systems. Retrofitting telematics devices can add connectivity features to older vehicles, enabling features, such as remote diagnostics, vehicle tracking, and mobile app integration. As Technology advances and consumer demand increases, the aftermarket automotive sensors market continues to grow as a viable business opportunity

Challenge: Need for high-performance sensors

The increasing automation of vehicles has led to a significant rise in the need for high-performance sensors. These sensors must possess a high level of sophistication to gather and analyze data rapidly and precisely. However, this demand has put a considerable burden on sensor manufacturers who are grappling to meet the requirements. The development of high-performance sensors is a challenge for sensor manufacturers. These sensors must be able to collect and process data quickly and accurately while being reliable and durable. In addition, it must operate in various conditions, including extreme temperatures, vibrations, and dust. They must be able to withstand the harsh environment of the automotive industry. Sensor manufacturers are working to develop new technologies that can meet these challenges. Sensor manufacturers are investing in research and development to meet this demand.

Automotive Sensors Market Ecosystem

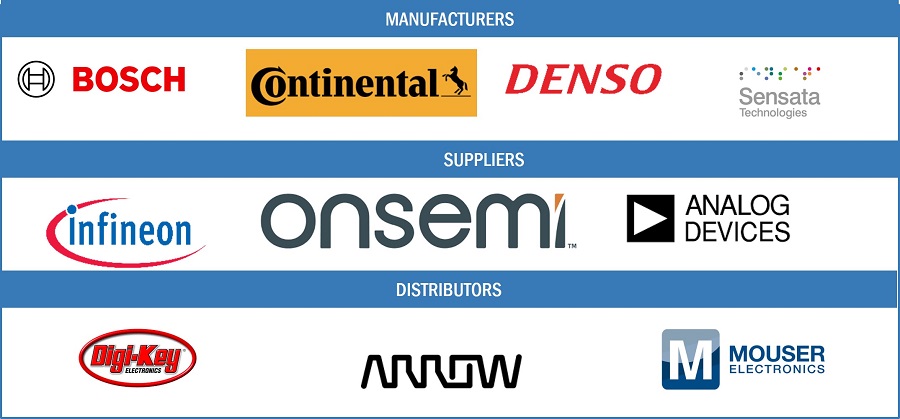
The automotive sensors market is competitive. It is marked by the presence of a few tier-1 companies, such as Robert Bosch GmbH (Germany), ON Semiconductor (US), OMNIVISION (US), TE Connectivity (Germany), and Continental AG (Germany),. These companies have created a competitive ecosystem by investing in research and development activities to launch highly efficient and reliable automotive sensors.
Automotive Sensors Market by Ecosystem

Original equipment manufacturer (OEM) segment to witness the highest growth during the forecast period

The original equipment manufacturer (OEM) refers to the manufacturers of original parts assembled and installed during the construction of a new vehicle. OEMs adopt the latest, mature products to meet the new AI and IoT technology-based sensor requirements. The automotive sensor manufacturers are highly focused on providing advanced sensors for vehicle safety and control applications. Automotive manufacturers are obliged to install automotive sensors during the manufacturing process due to government mandates regarding vehicle and road safety, fuel efficiency, and emission control worldwide. As a result, the market for technologically advanced automotive sensors is expected to proliferate, particularly in the context of autonomous vehicles.

Position sensors segment to hold the largest share of market between 2023 and 2028.

The growth of the position sensors segment can be attributed to the rising demand for autonomous cars and autopilot applications. Advanced technologies are increasingly being adopted in passenger and commercial cars because of the improving standard of living and rising consumer preference for better safety standards and comfort. Position sensors have become integral to vehicles, from vehicle seats and pedals to gear shifters. They ensure the safety and proper functioning of all vehicle components. Thus, innovation in automotive technology has increased the use of position sensors in vehicles.

Light commercial vehicle (LCV) segment to grow at  second fastest CAGR during the forecast period

The rising focus of automobile manufacturers on adding safety features, such as ABS and EBD, along with infotainment systems, in LCVs helps the automotive sensors market flourish in this vehicle segment. The cyclic growth in the sales of LCVs due to the surging demand for goods and carriage vehicles is further driving the sales of LCVs. This increase in the sales of LCVs is expected to impact the automotive sensor market positively.

Powertrain systems segment held the largest share of the automotive sensor market during the forecast period

The powertrain system of any vehicle defines its performance, comfort, and safety. Powertrain systems/components manufacturers have been adopting hybrid powertrain systems to reduce fuel consumption. The need for sensors in powertrain systems is driven by governments and automobile manufacturers worldwide' strong focus on lowering emissions, improving fuel economy, meeting onboard diagnostic requirements, and offering best-in-class drivability.

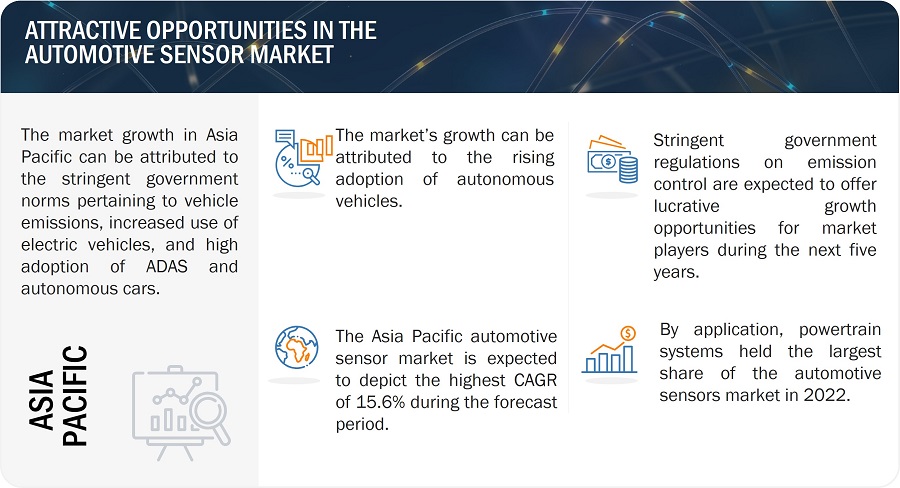
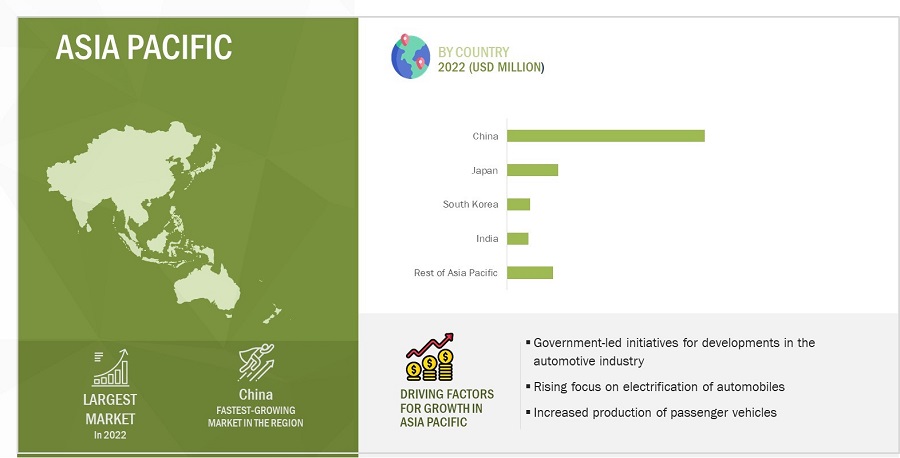
Asia Pacific to grow at the fastest CAGR during the forecast period.

Government initiatives are pivotal in fostering sensor adoption and innovation. In Japan, the government actively promotes autonomous driving technology, stimulating the demand for sensors related to advanced driver assistance systems (ADAS) and autonomous vehicles. The strong push toward electric vehicles, backed by substantial government incentives, propels the demand for sensors related to EV batteries and charging infrastructure in China. Additionally, South Korea's focus on fifth-generation (5G) and sixth-generation (6G) network technologies catalyzes the development of connected vehicles, further boosting the market.

The region's growing middle-class population and youthful demographics contribute significantly to the surge in automobile demand, spurring innovation and adoption of sensor technologies across countries like India and China. As Asia Pacific continues to lead the global automotive industry in adopting advanced technologies and fostering a conducive regulatory environment, it is poised to be the largest automotive sensors market size in the coming years.
Automotive Sensors Market by Region

Automotive Sensors Market Statistics by Region

To know about the assumptions considered for the study, download the pdf brochure

Automotive Sensors Market Key Players

The automotive sensor companies is dominated by globally established players such as Robert Bosch GmbH (Germany), ON Semiconductor (US), OMNIVISION (US), TE Connectivity (Germany), Continental AG (Germany), Infineon Technologies AG (Germany), NXP Semiconductors (Netherlands), Denso Corporation (Japan), Panasonic (Japan), Allegro MicroSystems, Inc. (US), Sensata Technologies,Inc (US), BorgWarner, Inc. (US), Analog Devices, Inc. (US), ELMOS Semiconductor SE (Germany), Aptiv. (Ireland), CTS Corporation (US), Autoliv, Inc. (Sweden), STMicroelectronics (Switzerland), ZF Friedrichshafen AG (Germany), Quanergy Solutions, Inc. (US), Innoviz Technologies Ltd (Israel), Valeo S.A. (France), Magna International Inc. (Canada), Melexis (Belgium), and Amphenol Advanced Sensors (US). These players have adopted product launches/developments, contracts, collaborations, agreements, and acquisitions for growth in the market.

Get online access to the report on the World's First Market Intelligence Cloud

  • Easy to Download Historical Data & Forecast Numbers
  • Company Analysis Dashboard for high growth potential opportunities
  • Research Analyst Access for customization & queries
  • Competitor Analysis with Interactive dashboard
  • Latest News, Updates & Trend analysis
Request Sample

Scope of the Report

Report Metric

Details

Estimated Value

USD 30.8 billion

Expected Value 

USD 62.2 billion

Growth Rate

CAGR of 15.0%

Market size available for years

2019–2028

Base year considered

2022

Forecast period

2023–2028

Forecast units

Value (USD Million/Billion) and Volume (Million)

Segments Covered

By Sales Channel, By Sensor Types, By Vehicle Types, By Application, and By Region

Region covered

North America, Europe, Asia Pacific, and the Rest of the World

Companies covered

The key players in the automotive sensor market are Robert Bosch GmbH (Germany), ON Semiconductor (US), OMNIVISION (US), TE Connectivity (Germany), Continental AG (Germany), Infineon Technologies AG (Germany), NXP Semiconductors (Netherlands), Denso Corporation (Japan), Panasonic (Japan), Allegro MicroSystems, Inc. (US), Sensata Technologies,Inc (US), BorgWarner, Inc. (US), Analog Devices, Inc. (US), ELMOS Semiconductor SE (Germany), Aptiv. (Ireland), CTS Corporation (US), Autoliv, Inc. (Sweden), STMicroelectronics (Switzerland), ZF Friedrichshafen AG (Germany), Quanergy Solutions, Inc. (US), Innoviz Technologies Ltd (Israel), Valeo S.A. (France), Magna International Inc. (Canada), Melexis (Belgium), and Amphenol Advanced Sensors (US).

Automotive Sensors Market Highlights

The study categorizes the automotive sensor market-based sales channel, sensor types, vehicle types, application, and region.

Segment

Subsegment

By Sales Channel

  • Original Equipment Manufacturers (OEMs)
  • Aftermarkets

By Sensor Types

  • Temperature Sensors
  • Pressure Sensors
  • Oxygen Sensors
  • NOx Sensors
  • Position Sensors
  • Speed Sensors
  • Inertial Sensors
  • Image Sensors
  • Level Sensors
  • Chemical Sensors
  • Radar Sensors
  • Ultrasonic Sensors
  • LiDAR Sensors
  • Current Sensors
  • Other Sensor Types

By Vehicle Types

  • Passenger Car
  • Light Commercial Vehicle (LCV)
  • Heavy Commercial Vehicle (HCV)

By Application

  • Powertrain Systems
  • Chassis
  • Exhaust Systems
  • Safety & Control Systems
  • Vehicle Body Electronics
  • Telematics Systems
  • Driver Assistance & Automation
  • Other Applications

By Region

  • North America
    • US
    • Canada
    • Mexico
  • Europe
    • Germany
    • UK
    • France
    • Spain
    • Italy
    • Rest of Europe
  • Asia Pacific (APAC)
    • China
    • Japan
    • South Korea
    • India
    • Rest of Asia Pacific
  • Rest of the World (RoW)
    • Middle East & Africa
    • South America

Recent Developments

  • In May 2023, ON Semiconductor (US) launched its Hyperlux automotive image sensor family, featuring industry-leading 150dB ultra-high dynamic range (HDR) and LED flicker mitigation (LFM).
  • In June 2022, Allegro MicroSystems, Inc. (US) launched magnetic position sensors, A33110 and A33115, designed for advanced driver assistance systems (ADAS) applications..
  • In May 2022, Infineon Technologies AG (Germany) launched the XENSIV 60 GHz radar sensor for automotive applications.

Frequently Asked Questions (FAQs):

To speak to our analyst for a discussion on the above findings, click Speak to Analyst

TABLE OF CONTENTS
 
1 INTRODUCTION (Page No. - 42)
    1.1 STUDY OBJECTIVES 
    1.2 MARKET DEFINITION 
    1.3 STUDY SCOPE 
           1.3.1 MARKETS COVERED
                    FIGURE 1 AUTOMOTIVE SENSORS MARKET SEGMENTATION
           1.3.2 INCLUSIONS AND EXCLUSIONS
           1.3.3 YEARS CONSIDERED
           1.3.4 REGIONAL SCOPE
    1.4 CURRENCY CONSIDERED 
           TABLE 1 CURRENCY CONVERSION RATES
    1.5 UNITS CONSIDERED 
    1.6 LIMITATIONS 
    1.7 STAKEHOLDERS 
    1.8 SUMMARY OF CHANGES 
           1.8.1 RECESSION IMPACT
 
2 RESEARCH METHODOLOGY (Page No. - 47)
    2.1 RESEARCH DATA 
           FIGURE 2 AUTOMOTIVE SENSOR MARKET: RESEARCH DESIGN
           2.1.1 SECONDARY AND PRIMARY RESEARCH
           2.1.2 SECONDARY DATA
                    2.1.2.1 List of key secondary sources
                    2.1.2.2 Key data from secondary sources
           2.1.3 PRIMARY DATA
                    2.1.3.1 List of key primary interview participants
                    2.1.3.2 Key data from primary sources
                    2.1.3.3 Key industry insights
                    2.1.3.4 Breakdown of primaries
    2.2 MARKET SIZE ESTIMATION 
           FIGURE 3 MARKET: RESEARCH FLOW
           FIGURE 4 MARKET SIZE ESTIMATION METHODOLOGY (SUPPLY SIDE): REVENUES GENERATED BY COMPANIES FROM SALES OF AUTOMOTIVE SENSORS
           FIGURE 5 MARKET SIZE ESTIMATION METHODOLOGY: BOTTOM-UP (DEMAND SIDE): DEMAND FOR AUTOMOTIVE SENSORS IN DIFFERENT APPLICATIONS
           2.2.1 BOTTOM-UP APPROACH
                    2.2.1.1 Approach to arrive at market size through bottom-up analysis (demand side)
                               FIGURE 6 MARKET SIZE ESTIMATION: BOTTOM-UP APPROACH
           2.2.2 TOP-DOWN APPROACH
                    2.2.2.1 Approach to arrive at market size through top-down analysis (supply side)
                               FIGURE 7 MARKET SIZE ESTIMATION: TOP-DOWN APPROACH
    2.3 MARKET BREAKDOWN AND DATA TRIANGULATION 
           FIGURE 8 MARKET: DATA TRIANGULATION
    2.4 RESEARCH ASSUMPTIONS 
           FIGURE 9 MARKET: RESEARCH ASSUMPTIONS
    2.5 PARAMETERS CONSIDERED TO ANALYZE RECESSION IMPACT 
    2.6 RISK ASSESSMENT 
    2.7 RESEARCH LIMITATIONS 
           FIGURE 10 AUTOMOTIVE SENSORS MARKET: RESEARCH LIMITATIONS
 
3 EXECUTIVE SUMMARY (Page No. - 60)
    FIGURE 11 OEM SEGMENT TO LEAD MARKET DURING FORECAST PERIOD
    FIGURE 12 POSITION SENSORS TO HOLD LARGEST SHARE OF MARKET IN 2023
    FIGURE 13 PASSENGER CAR SEGMENT TO DOMINATE MARKET THROUGHOUT FORECAST PERIOD
    FIGURE 14 SAFETY & CONTROL SYSTEMS TO EXHIBIT HIGHEST CAGR IN MARKET, BY APPLICATION, FROM 2023 TO 2028
    FIGURE 15 ASIA PACIFIC TO RECORD HIGHEST CAGR IN MARKET DURING FORECAST PERIOD
 
4 PREMIUM INSIGHTS (Page No. - 65)
    4.1 MAJOR GROWTH OPPORTUNITIES FOR PLAYERS IN AUTOMOTIVE SENSORS MARKET 
           FIGURE 16 GROWING USE OF AUTOMOTIVE SENSORS IN POWERTRAIN SYSTEMS TO DRIVE MARKET
    4.2 MARKET, BY SENSOR TYPE 
           FIGURE 17 LIDAR SENSORS TO EXHIBIT HIGHEST CAGR DURING FORECAST PERIOD
    4.3 MARKET IN ASIA PACIFIC, BY COUNTRY AND VEHICLE TYPE 
           FIGURE 18 CHINA AND PASSENGER CAR SEGMENT TO ACCOUNT FOR LARGEST SHARE IN 2023
    4.4 MARKET, BY SALES CHANNEL 
           FIGURE 19 ORIGINAL EQUIPMENT MANUFACTURER (OEM) TO HOLD LARGER SHARE OF AUTOMOTIVE SENSOR MARKET IN 2023 AND 2028
    4.5 MARKET, BY COUNTRY 
           FIGURE 20 SPAIN TO RECORD HIGHEST CAGR IN GLOBAL AUTOMOTIVE SENSORS MARKET DURING FORECAST PERIOD
 
5 MARKET OVERVIEW (Page No. - 69)
    5.1 INTRODUCTION 
    5.2 MARKET DYNAMICS 
           FIGURE 21 AUTOMOTIVE SENSORS MARKET: DRIVERS, RESTRAINTS, OPPORTUNITIES, AND CHALLENGES
           5.2.1 DRIVERS
                    5.2.1.1 Growing inclination of consumers toward alternative fuel vehicles to reduce GHG emissions
                    5.2.1.2 Increasing focus on vehicle authentication to ensure driver safety and comfort
                    5.2.1.3 Minimizing driver stress through adoption of advanced driver-assistance systems
                    5.2.1.4 Government incentives and grants to support R&D in automotive sensor technology
                    5.2.1.5 Advancements in sensor technologies to meet customer requirements
                               FIGURE 22 AUTOMOTIVE SENSOR MARKET: IMPACT OF DRIVERS
           5.2.2 RESTRAINTS
                    5.2.2.1 Shortage of aftermarket service professionals in emerging economies
                    5.2.2.2 High cost of LiDAR automotive sensors
                               FIGURE 23 AUTOMOTIVE SENSOR MARKET: IMPACT OF RESTRAINTS
           5.2.3 OPPORTUNITIES
                    5.2.3.1 Increasing investments by automobile manufacturers in LiDAR technology
                    5.2.3.2 Growing adoption of EVs and HEVs to reduce CO2 emissions
                    5.2.3.3 Increasingly stringent emission regulations
                    5.2.3.4 Rising demand for automotive aftermarket services
                               FIGURE 24 AUTOMOTIVE SENSOR MARKET: IMPACT OF OPPORTUNITIES
           5.2.4 CHALLENGES
                    5.2.4.1 Safety and security threats in autonomous vehicles
                    5.2.4.2 Need for high-performance sensors
                    5.2.4.3 Reliance on associated technologies to ensure functional accuracy
                               FIGURE 25 AUTOMOTIVE SENSOR MARKET: IMPACT OF CHALLENGES
    5.3 VALUE CHAIN ANALYSIS 
           FIGURE 26 AUTOMOTIVE SENSOR MARKET: VALUE CHAIN ANALYSIS
    5.4 TRENDS/DISRUPTIONS IMPACTING CUSTOMER BUSINESS 
           FIGURE 27 REVENUE SHIFT AND NEW REVENUE POCKETS FOR PLAYERS IN AUTOMOTIVE SENSOR MARKET
    5.5 ECOSYSTEM MAPPING 
           FIGURE 28 AUTOMOTIVE SENSOR ECOSYSTEM MAPPING
           FIGURE 29 KEY PLAYERS IN AUTOMOTIVE SENSOR ECOSYSTEM
           TABLE 2 LIST OF AUTOMOTIVE SENSOR MANUFACTURERS AND SUPPLIERS
    5.6 PORTER’S FIVE FORCES ANALYSIS 
           TABLE 3 MARKET: PORTER’S FIVE FORCES ANALYSIS
           FIGURE 30 PORTER’S FIVE FORCES ANALYSIS
           5.6.1 THREAT OF NEW ENTRANTS
           5.6.2 THREAT OF SUBSTITUTES
           5.6.3 BARGAINING POWER OF SUPPLIERS
           5.6.4 BARGAINING POWER OF BUYERS
           5.6.5 INTENSITY OF COMPETITIVE RIVALRY
    5.7 CASE STUDY ANALYSIS 
           5.7.1 DEVELOPMENT OF AUTOMOTIVE SENSOR CHIP FOR ELECTRIC VEHICLES TO RELAY INFORMATION
           5.7.2 INTEGRATION OF SENSORS IN PRINTED CIRCUIT BOARDS TO WITHSTAND EXTREME TEMPERATURES AND SENSE ROAD CONDITIONS
           5.7.3 INTRODUCTION OF PRESSURE SENSOR FOR HIGH-PERFORMANCE APPLICATIONS
           5.7.4 IMPLEMENTATION OF RAIN SENSORS TO ADJUST WIPER SPEED BASED ON RAINFALL INTENSITY
           5.7.5 ADOPTION OF IMAGE SENSORS TO ENHANCE STORAGE EFFICIENCY AND TRACEABILITY
    5.8 TECHNOLOGY ANALYSIS 
           5.8.1 TIME-OF-FLIGHT (TOF) SENSORS
           5.8.2 MAGNETIC SENSORS
           5.8.3 ADVANCED DRIVER-ASSISTANCE SYSTEMS (ADAS)
           5.8.4 ELECTRONIC STABILITY CONTROL (ESC) SYSTEMS
           5.8.5 AUTONOMOUS VEHICLES
           5.8.6 AIRBAG SYSTEMS
    5.9 PRICING ANALYSIS 
           TABLE 4 AVERAGE SELLING PRICE TREND OF AUTOMOTIVE SENSORS, BY SENSOR TYPE
           5.9.1 AVERAGE SELLING PRICE TREND, BY REGION
                    FIGURE 31 AVERAGE SELLING PRICE TREND OF SPEED SENSORS, BY REGION
                    FIGURE 32 AVERAGE SELLING PRICE TREND OF TEMPERATURE SENSORS, BY REGION
                    FIGURE 33 AVERAGE SELLING PRICE TREND OF PRESSURE SENSORS, BY REGION
           5.9.2 AVERAGE SELLING PRICE TREND OF SENSOR TYPES PROVIDED BY KEY PLAYERS
                    FIGURE 34 AVERAGE SELLING PRICE TREND OF DIFFERENT SENSORS OFFERED BY KEY PLAYERS
    5.10 TRADE ANALYSIS 
           5.10.1 IMPORT SCENARIO
                    FIGURE 35 IMPORT DATA, BY COUNTRY, 2018–2022 (USD MILLION)
           5.10.2 EXPORT SCENARIO
                    FIGURE 36 EXPORT DATA, BY COUNTRY, 2018–2022 (USD MILLION)
    5.11 PATENT ANALYSIS, 2019–2023 
           FIGURE 37 PATENTS GRANTED WORLDWIDE FROM 2013 TO 2023
           TABLE 5 TOP 20 PATENT OWNERS FROM 2013 TO 2023
           FIGURE 38 TOP 10 COMPANIES WITH HIGHEST NUMBER OF PATENT APPLICATIONS FROM 2013 TO 2023
    5.12 TARIFFS AND REGULATORY LANDSCAPE 
           5.12.1 TARIFFS
                    TABLE 6 MFN TARIFFS FOR PRODUCTS COVERED UNDER HS CODE 903290 EXPORTED BY US
                    TABLE 7 MFN TARIFFS FOR PRODUCTS COVERED UNDER HS CODE 903290 EXPORTED BY CHINA
           5.12.2 REGULATORY COMPLIANCE
                    5.12.2.1 Regulations
                    5.12.2.2 Standards
                    5.12.2.3 Regulatory bodies, government agencies, and other organizations
                                TABLE 8 NORTH AMERICA: REGULATORY BODIES, GOVERNMENT AGENCIES, AND OTHER ORGANIZATIONS
                                TABLE 9 EUROPE: REGULATORY BODIES, GOVERNMENT AGENCIES, AND OTHER ORGANIZATIONS
                                TABLE 10 ASIA PACIFIC: REGULATORY BODIES, GOVERNMENT AGENCIES, AND OTHER ORGANIZATIONS
                                TABLE 11 ROW: REGULATORY BODIES, GOVERNMENT AGENCIES, AND OTHER ORGANIZATIONS
    5.13 KEY CONFERENCES AND EVENTS, 2023–2024 
           TABLE 12 MARKET: DETAILED LIST OF CONFERENCES AND EVENTS
    5.14 KEY STAKEHOLDERS AND BUYING CRITERIA 
           5.14.1 KEY STAKEHOLDERS IN BUYING PROCESS
                    FIGURE 39 INFLUENCE OF STAKEHOLDERS ON BUYING PROCESS FOR TOP 3 APPLICATIONS
                    TABLE 13 INFLUENCE OF STAKEHOLDERS ON BUYING PROCESS FOR TOP 3 APPLICATIONS (%)
           5.14.2 BUYING CRITERIA
                    FIGURE 40 KEY BUYING CRITERIA FOR TOP 3 APPLICATIONS
                    TABLE 14 KEY BUYING CRITERIA FOR TOP 3 APPLICATIONS
 
6 AUTOMOTIVE SENSOR MARKET, BY SALES CHANNEL (Page No. - 109)
    6.1 INTRODUCTION 
           FIGURE 41 AUTOMOTIVE SENSORS MARKET, BY SALES CHANNEL
           FIGURE 42 OEM SEGMENT TO DOMINATE MARKET THROUGHOUT FORECAST PERIOD
           TABLE 15 MARKET, BY SALES CHANNEL, 2019–2022 (USD MILLION)
           TABLE 16 MARKET, BY SALES CHANNEL, 2023–2028 (USD MILLION)
           TABLE 17 MARKET, BY SALES CHANNEL, 2019–2022 (MILLION UNITS)
           TABLE 18 MARKET, BY SALES CHANNEL, 2023–2028 (MILLION UNITS)
    6.2 OEM 
           6.2.1 GOVERNMENT MANDATES REGARDING VEHICLE AND ROAD SAFETY TO LEAD TO HIGH ADOPTION OF ADVANCED SENSOR TECHNOLOGIES BY OEMS
                    TABLE 19 OEM: MARKET, BY SENSOR TYPE, 2019–2022 (USD MILLION)
                    TABLE 20 OEM: MARKET, BY SENSOR TYPE, 2023–2028 (USD MILLION)
                    TABLE 21 OEM: MARKET, BY SENSOR TYPE, 2019–2022 (MILLION UNITS)
                    TABLE 22 OEM: MARKET, BY SENSOR TYPE, 2023–2028 (MILLION UNITS)
    6.3 AFTERMARKET 
           6.3.1 RISING USE OF AUTOMOTIVE SENSORS BY DIY ENTHUSIASTS TO DRIVE SEGMENTAL GROWTH
                    TABLE 23 AFTERMARKET: MARKET, BY SENSOR TYPE, 2019–2022 (USD MILLION)
                    TABLE 24 AFTERMARKET: MARKET, BY SENSOR TYPE, 2023–2028 (USD MILLION)
                    TABLE 25 AFTERMARKET: MARKET, BY SENSOR TYPE, 2019–2022 (MILLION UNITS)
                    TABLE 26 AFTERMARKET: MARKET, BY SENSOR TYPE, 2023–2028 (MILLION UNITS)
 
7 AUTOMOTIVE SENSORS MARKET, BY SENSOR TYPE (Page No. - 118)
    7.1 INTRODUCTION 
           FIGURE 43 MARKET, BY SENSOR TYPE
           FIGURE 44 LIDAR SENSORS TO RECORD HIGHEST CAGR DURING FORECAST PERIOD
           TABLE 27 MARKET, BY SENSOR TYPE, 2019–2022 (USD MILLION)
           TABLE 28 MARKET, BY SENSOR TYPE, 2023–2028 (USD MILLION)
           TABLE 29 MARKET, BY SENSOR TYPE, 2019–2022 (MILLION UNITS)
           TABLE 30 MARKET, BY SENSOR TYPE, 2023–2028 (MILLION UNITS)
    7.2 TEMPERATURE SENSORS 
           7.2.1 GROWING USE IN ENGINE/POWERTRAIN MANAGEMENT AND HVAC SYSTEMS OF AUTOMOBILES TO DRIVE MARKET
                    TABLE 31 TEMPERATURE SENSORS: MARKET, BY REGION, 2019–2022 (USD MILLION)
                    TABLE 32 TEMPERATURE SENSORS: MARKET, BY REGION, 2023–2028 (USD MILLION)
                    TABLE 33 TEMPERATURE SENSORS: MARKET, BY REGION, 2019–2022 (MILLION UNITS)
                    TABLE 34 TEMPERATURE SENSORS: MARKET, BY REGION, 2023–2028 (MILLION UNITS)
                    TABLE 35 TEMPERATURE SENSORS: MARKET, BY SALES CHANNEL, 2019–2022 (USD MILLION)
                    TABLE 36 TEMPERATURE SENSORS: MARKET, BY SALES CHANNEL, 2023–2028 (USD MILLION)
                    TABLE 37 TEMPERATURE SENSORS: MARKET, BY SALES CHANNEL, 2019–2022 (MILLION UNITS)
                    TABLE 38 TEMPERATURE SENSORS: MARKET, BY SALES CHANNEL, 2023–2028 (MILLION UNITS)
    7.3 PRESSURE SENSORS 
           7.3.1 RISING UTILIZATION IN AUTOMOTIVE SYSTEMS SUCH AS HVAC, SAFETY AND CONTROL, AND TIRE PRESSURE MONITORING SYSTEMS TO FUEL MARKET GROWTH
                    TABLE 39 PRESSURE SENSORS: AUTOMOTIVE SENSORS MARKET, BY REGION, 2019–2022 (USD MILLION)
                    TABLE 40 PRESSURE SENSORS: MARKET, BY REGION, 2023–2028 (USD MILLION)
                    TABLE 41 PRESSURE SENSORS: MARKET, BY REGION, 2019–2022 (MILLION UNITS)
                    TABLE 42 PRESSURE SENSORS: MARKET, BY REGION, 2023–2028 (MILLION UNITS)
                    TABLE 43 PRESSURE SENSORS: MARKET, BY SALES CHANNEL, 2019–2022 (USD MILLION)
                    TABLE 44 PRESSURE SENSORS: MARKET, BY SALES CHANNEL, 2023–2028 (USD MILLION)
                    TABLE 45 PRESSURE SENSORS: MARKET, BY SALES CHANNEL, 2019–2022 (MILLION UNITS)
                    TABLE 46 PRESSURE SENSORS: MARKET, BY SALES CHANNEL, 2023–2028 (MILLION UNITS)
    7.4 OXYGEN SENSORS 
           7.4.1 INCREASING IMPLEMENTATION OF O2 SENSORS TO MEASURE PROPORTION OF OXYGEN IN AIR-FUEL MIXTURES TO CONTRIBUTE TO MARKET GROWTH
                    TABLE 47 OXYGEN SENSORS: MARKET, BY REGION, 2019–2022 (USD MILLION)
                    TABLE 48 OXYGEN SENSORS: MARKET, BY REGION, 2023–2028 (USD MILLION)
                    TABLE 49 OXYGEN SENSORS: MARKET, BY REGION, 2019–2022 (MILLION UNITS)
                    TABLE 50 OXYGEN SENSORS: MARKET, BY REGION, 2023–2028 (MILLION UNITS)
                    TABLE 51 OXYGEN SENSORS: MARKET, BY SALES CHANNEL, 2019–2022 (USD MILLION)
                    TABLE 52 OXYGEN SENSORS: MARKET, BY SALES CHANNEL, 2023–2028 (USD MILLION)
                    TABLE 53 OXYGEN SENSORS: MARKET, BY SALES CHANNEL, 2019–2022 (MILLION UNITS)
                    TABLE 54 OXYGEN SENSORS: AUTOMOTIVE SENSORS MARKET, BY SALES CHANNEL, 2023–2028 (MILLION UNITS)
    7.5 NITROGEN OXIDE (NOX) SENSORS 
           7.5.1 GROWING DEPLOYMENT OF NOX SENSORS TO DETECT NITROGEN OXIDE LEVELS IN AUTOMOBILE EMISSIONS TO SUPPORT MARKET GROWTH
                    TABLE 55 NOX SENSORS: MARKET, BY REGION, 2019–2022 (USD MILLION)
                    TABLE 56 NOX SENSORS: MARKET, BY REGION, 2023–2028 (USD MILLION)
                    TABLE 57 NOX SENSORS: MARKET, BY REGION, 2019–2022 (MILLION UNITS)
                    TABLE 58 NOX SENSORS: MARKET, BY REGION, 2023–2028 (MILLION UNITS)
                    TABLE 59 NOX SENSORS: MARKET, BY SALES CHANNEL, 2019–2022 (USD MILLION)
                    TABLE 60 NOX SENSORS: MARKET, BY SALES CHANNEL, 2023–2028 (USD MILLION)
                    TABLE 61 NOX SENSORS: MARKET, BY SALES CHANNEL, 2019–2022 (MILLION UNITS)
                    TABLE 62 NOX SENSORS: MARKET, BY SALES CHANNEL, 2023–2028 (MILLION UNITS)
    7.6 POSITION SENSORS 
           7.6.1 INCREASING FOCUS OF AUTOMAKERS ON DEVELOPING VEHICLES WITH ENHANCED COMFORT AND IMPROVED FUEL EFFICIENCY TO DRIVE MARKET
                    FIGURE 45 ASIA PACIFIC TO LEAD AUTOMOTIVE SENSORS MARKET FOR POSITION SENSORS DURING FORECAST PERIOD
                    TABLE 63 POSITION SENSORS: MARKET, BY REGION, 2019–2022 (USD MILLION)
                    TABLE 64 POSITION SENSORS: MARKET, BY REGION, 2023–2028 (USD MILLION)
                    TABLE 65 POSITION SENSORS: MARKET, BY REGION, 2019–2022 (MILLION UNITS)
                    TABLE 66 POSITION SENSORS: AUTOMOTIVE SENSOR MARKET, BY REGION, 2023–2028 (MILLION UNITS)
                    TABLE 67 POSITION SENSORS: MARKET, BY SALES CHANNEL, 2019–2022 (USD MILLION)
                    TABLE 68 POSITION SENSORS: MARKET, BY SALES CHANNEL, 2023–2028 (USD MILLION)
                    TABLE 69 POSITION SENSORS: MARKET, BY SALES CHANNEL, 2019–2022 (MILLION UNITS)
                    TABLE 70 POSITION SENSORS: MARKET, BY SALES CHANNEL, 2023–2028 (MILLION UNITS)
    7.7 SPEED SENSORS 
           7.7.1 ELEVATING ADOPTION OF SPEED SENSORS TO MEASURE ENGINE CAMSHAFT AND VEHICLE SPEED TO DRIVE MARKET
                    TABLE 71 SPEED SENSORS: MARKET, BY REGION, 2019–2022 (USD MILLION)
                    TABLE 72 SPEED SENSORS: MARKET, BY REGION, 2023–2028 (USD MILLION)
                    TABLE 73 SPEED SENSORS: MARKET, BY REGION, 2019–2022 (MILLION UNITS)
                    TABLE 74 SPEED SENSORS: MARKET, BY REGION, 2023–2028 (MILLION UNITS)
                    TABLE 75 SPEED SENSORS: MARKET, BY SALES CHANNEL, 2019–2022 (USD MILLION)
                    TABLE 76 SPEED SENSORS: MARKET, BY SALES CHANNEL, 2023–2028 (USD MILLION)
                    TABLE 77 SPEED SENSORS: MARKET, BY SALES CHANNEL, 2019–2022 (MILLION UNITS)
                    TABLE 78 SPEED SENSORS: AUTOMOTIVE SENSORS MARKET, BY SALES CHANNEL, 2023–2028 (MILLION UNITS)
    7.8 INERTIAL SENSORS 
           7.8.1 INTEGRATION OF INERTIAL SENSORS IN ACCELEROMETERS AND GYROSCOPES TO SUPPORT MARKET GROWTH
                    7.8.1.1 Accelerometers
                    7.8.1.2 Gyroscopes
                               TABLE 79 INERTIAL SENSORS: MARKET, BY REGION, 2019–2022 (USD MILLION)
                               TABLE 80 INERTIAL SENSORS: MARKET, BY REGION, 2023–2028 (USD MILLION)
                               TABLE 81 INERTIAL SENSORS: MARKET, BY REGION, 2019–2022 (MILLION UNITS)
                               TABLE 82 INERTIAL SENSORS: MARKET, BY REGION, 2023–2028 (MILLION UNITS)
                               TABLE 83 INERTIAL SENSORS: MARKET, BY SALES CHANNEL, 2019–2022 (USD MILLION)
                               TABLE 84 INERTIAL SENSORS: MARKET, BY SALES CHANNEL, 2023–2028 (USD MILLION)
                               TABLE 85 INERTIAL SENSORS: MARKET, BY SALES CHANNEL, 2019–2022 (MILLION UNITS)
                               TABLE 86 INERTIAL SENSORS: AUTOMOTIVE SENSORS MARKET, BY SALES CHANNEL, 2023–2028 (MILLION UNITS)
    7.9 IMAGE SENSORS 
           7.9.1 EXTENSIVE USE OF IMAGE SENSORS IN ADVANCED DRIVER-ASSISTANCE SYSTEMS TO BOOST DEMAND
                    7.9.1.1 Complementary metal-oxide-semiconductor (CMOS)
                    7.9.1.2 Charge-coupled device (CCD)
                               TABLE 87 IMAGE SENSORS: AUTOMOTIVE SENSOR MARKET, BY REGION, 2019–2022 (USD MILLION)
                               TABLE 88 IMAGE SENSORS: MARKET, BY REGION, 2023–2028 (USD MILLION)
                               TABLE 89 IMAGE SENSORS: MARKET, BY REGION, 2019–2022 (MILLION UNITS)
                               TABLE 90 IMAGE SENSORS: MARKET, BY REGION, 2023–2028 (MILLION UNITS)
                               TABLE 91 IMAGE SENSORS: MARKET, BY SALES CHANNEL, 2019–2022 (USD MILLION)
                               TABLE 92 IMAGE SENSORS: MARKET, BY SALES CHANNEL, 2023–2028 (USD MILLION)
                               TABLE 93 IMAGE SENSORS: MARKET, BY SALES CHANNEL, 2019–2022 (MILLION UNITS)
                               TABLE 94 IMAGE SENSORS: AUTOMOTIVE SENSORS MARKET, BY SALES CHANNEL, 2023–2028 (MILLION UNITS)
    7.10 LEVEL SENSORS 
           7.10.1 RISING DEPLOYMENT OF LEVEL SENSORS TO MONITOR AND MANAGE FUEL, ENGINE OIL, AND COOLANT LEVELS TO SUPPORT MARKET GROWTH
                    TABLE 95 LEVEL SENSORS: AUTOMOTIVE SENSOR MARKET, BY REGION, 2019–2022 (USD MILLION)
                    TABLE 96 LEVEL SENSORS: MARKET, BY REGION, 2023–2028 (USD MILLION)
                    TABLE 97 LEVEL SENSORS: MARKET, BY REGION, 2019–2022 (MILLION UNITS)
                    TABLE 98 LEVEL SENSORS: MARKET, BY REGION, 2023–2028 (MILLION UNITS)
                    TABLE 99 LEVEL SENSORS: MARKET, BY SALES CHANNEL, 2019–2022 (USD MILLION)
                    TABLE 100 LEVEL SENSORS: MARKET, BY SALES CHANNEL, 2023–2028 (USD MILLION)
                    TABLE 101 LEVEL SENSORS: MARKET, BY SALES CHANNEL, 2019–2022 (MILLION UNITS)
                    TABLE 102 LEVEL SENSORS: AUTOMOTIVE SENSORS MARKET, BY SALES CHANNEL, 2023–2028 (MILLION UNITS)
    7.11 CHEMICAL SENSORS 
           7.11.1 INCREASING ADOPTION OF CHEMICAL SENSORS TO ADHERE TO STRINGENT EMISSION STANDARDS TO SUPPORT SEGMENTAL GROWTH
                    TABLE 103 CHEMICAL SENSORS: AUTOMOTIVE SENSOR MARKET, BY REGION, 2019–2022 (USD MILLION)
                    TABLE 104 CHEMICAL SENSORS: MARKET, BY REGION, 2023–2028 (USD MILLION)
                    TABLE 105 CHEMICAL SENSORS: MARKET, BY REGION, 2019–2022 (MILLION UNITS)
                    TABLE 106 CHEMICAL SENSORS: MARKET, BY REGION, 2023–2028 (MILLION UNITS)
                    TABLE 107 CHEMICAL SENSORS: MARKET, BY SALES CHANNEL, 2019–2022 (USD MILLION)
                    TABLE 108 CHEMICAL SENSORS: MARKET, BY SALES CHANNEL, 2023–2028 (USD MILLION)
                    TABLE 109 CHEMICAL SENSORS: MARKET, BY SALES CHANNEL, 2019–2022 (MILLION UNITS)
                    TABLE 110 CHEMICAL SENSORS: AUTOMOTIVE SENSORS MARKET, BY SALES CHANNEL, 2023–2028 (MILLION UNITS)
    7.12 RADAR SENSORS 
           7.12.1 INSTALLATION OF RADAR SENSORS IN AUTONOMOUS VEHICLES TO RECOGNIZE SURROUNDINGS TO CONTRIBUTE TO MARKET GROWTH
                    TABLE 111 RADAR SENSORS: MARKET, BY REGION, 2019–2022 (USD MILLION)
                    TABLE 112 RADAR SENSORS: MARKET, BY REGION, 2023–2028 (USD MILLION)
                    TABLE 113 RADAR SENSORS: MARKET, BY REGION, 2019–2022 (MILLION UNITS)
                    TABLE 114 RADAR SENSORS: MARKET, BY REGION, 2023–2028 (MILLION UNITS)
                    TABLE 115 RADAR SENSORS: MARKET, BY SALES CHANNEL, 2019–2022 (USD MILLION)
                    TABLE 116 RADAR SENSORS: MARKET, BY SALES CHANNEL, 2023–2028 (USD MILLION)
                    TABLE 117 RADAR SENSORS: MARKET, BY SALES CHANNEL, 2019–2022 (MILLION UNITS)
                    TABLE 118 RADAR SENSORS: AUTOMOTIVE SENSORS MARKET, BY SALES CHANNEL, 2023–2028 (MILLION UNITS)
    7.13 ULTRASONIC SENSORS 
           7.13.1 INCREASING IMPORTANCE OF PARKING ASSISTANCE, BLIND-SPOT DETECTION, AND COLLISION AVOIDANCE SYSTEMS TO BOOST DEMAND FOR ULTRASONIC SENSORS
                    TABLE 119 ULTRASONIC SENSORS: MARKET, BY REGION, 2019–2022 (USD MILLION)
                    TABLE 120 ULTRASONIC SENSORS: MARKET, BY REGION, 2023–2028 (USD MILLION)
                    TABLE 121 ULTRASONIC SENSORS: MARKET, BY REGION, 2019–2022 (MILLION UNITS)
                    TABLE 122 ULTRASONIC SENSORS: MARKET, BY REGION, 2023–2028 (MILLION UNITS)
                    TABLE 123 ULTRASONIC SENSORS: MARKET, BY SALES CHANNEL, 2019–2022 (USD MILLION)
                    TABLE 124 ULTRASONIC SENSORS: MARKET, BY SALES CHANNEL, 2023–2028 (USD MILLION)
                    TABLE 125 ULTRASONIC SENSORS: MARKET, BY SALES CHANNEL, 2019–2022 (MILLION UNITS)
                    TABLE 126 ULTRASONIC SENSORS: AUTOMOTIVE SENSORS MARKET, BY SALES CHANNEL, 2023–2028 (MILLION UNITS)
    7.14 LIDAR SENSORS 
           7.14.1 RISING UTILIZATION OF LIDAR SENSORS TO DETECT OBSTACLES TO ENSURE SMOOTH AND SAFE RIDE TO DRIVE MARKET
                    TABLE 127 LIDAR SENSORS: AUTOMOTIVE SENSOR MARKET, BY REGION, 2019–2022 (USD MILLION)
                    TABLE 128 LIDAR SENSORS: MARKET, BY REGION, 2023–2028 (USD MILLION)
                    TABLE 129 LIDAR SENSORS: MARKET, BY REGION, 2019–2022 (MILLION UNITS)
                    TABLE 130 LIDAR SENSORS: MARKET, BY REGION, 2023–2028 (MILLION UNITS)
                    TABLE 131 LIDAR SENSORS: MARKET, BY SALES CHANNEL, 2019–2022 (USD MILLION)
                    TABLE 132 LIDAR SENSORS: MARKET, BY SALES CHANNEL, 2023–2028 (USD MILLION)
                    TABLE 133 LIDAR SENSORS: MARKET, BY SALES CHANNEL, 2019–2022 (MILLION UNITS)
                    TABLE 134 LIDAR SENSORS: MARKET, BY SALES CHANNEL, 2023–2028 (MILLION UNITS)
    7.15 CURRENT SENSORS 
           7.15.1 INTEGRATION OF CURRENT SENSORS INTO BATTERY MANAGEMENT SYSTEMS TO FUEL MARKET GROWTH
                    TABLE 135 CURRENT SENSORS: AUTOMOTIVE SENSORS MARKET, BY REGION, 2019–2022 (USD MILLION)
                    TABLE 136 CURRENT SENSORS: MARKET, BY REGION, 2023–2028 (USD MILLION)
                    TABLE 137 CURRENT SENSORS: MARKET, BY REGION, 2019–2022 (MILLION UNITS)
                    TABLE 138 CURRENT SENSORS: MARKET, BY REGION, 2023–2028 (MILLION UNITS)
                    TABLE 139 CURRENT SENSORS: MARKET, BY SALES CHANNEL, 2019–2022 (USD MILLION)
                    TABLE 140 CURRENT SENSORS: MARKET, BY SALES CHANNEL, 2023–2028 (USD MILLION)
                    TABLE 141 CURRENT SENSORS: MARKET, BY SALES CHANNEL, 2019–2022 (MILLION UNITS)
                    TABLE 142 CURRENT SENSORS: MARKET, BY SALES CHANNEL, 2023–2028 (MILLION UNITS)
    7.16 OTHER SENSOR TYPES 
           7.16.1 RAIN SENSORS
           7.16.2 RELATIVE HUMIDITY SENSORS
           7.16.3 PROXIMITY SENSORS
           7.16.4 PARTICULATE MATTER SENSORS
                    TABLE 143 OTHER SENSOR TYPES: MARKET, BY REGION, 2019–2022 (USD MILLION)
                    TABLE 144 OTHER SENSOR TYPES: MARKET, BY REGION, 2023–2028 (USD MILLION)
                    TABLE 145 OTHER SENSOR TYPES: MARKET, BY REGION, 2019–2022 (MILLION UNITS)
                    TABLE 146 OTHER SENSOR TYPES: MARKET, BY REGION, 2023–2028 (MILLION UNITS)
                    TABLE 147 OTHER SENSOR TYPES: MARKET, BY SALES CHANNEL, 2019–2022 (USD MILLION)
                    TABLE 148 OTHER SENSOR TYPES: MARKET, BY SALES CHANNEL, 2023–2028 (USD MILLION)
                    TABLE 149 OTHER SENSOR TYPES: AUTOMOTIVE SENSORS MARKET, BY SALES CHANNEL, 2019–2022 (MILLION UNITS)
                    TABLE 150 OTHER SENSOR TYPES: AUTOMOTIVE SENSOR MARKET, BY SALES CHANNEL, 2023–2028 (MILLION UNITS)
 
8 AUTOMOTIVE SENSOR MARKET, BY VEHICLE TYPE (Page No. - 170)
    8.1 INTRODUCTION 
           FIGURE 46 AUTOMOTIVE SENSOR MARKET, BY VEHICLE TYPE
           FIGURE 47 PASSENGER CAR SEGMENT TO RECORD HIGHEST CAGR IN AUTOMOTIVE SENSORS MARKET DURING FORECAST PERIOD
           TABLE 151 MARKET, BY VEHICLE TYPE, 2019–2022 (USD MILLION)
           TABLE 152 MARKET, BY VEHICLE TYPE, 2023–2028 (USD MILLION)
           TABLE 153 MARKET, BY VEHICLE TYPE, 2019–2022 (MILLION UNITS)
           TABLE 154 MARKET, BY VEHICLE TYPE, 2023–2028 (MILLION UNITS)
    8.2 PASSENGER CAR 
           8.2.1 INSTALLATION OF GPS, CAMERAS, AND INFOTAINMENT SYSTEMS IN PASSENGER CARS TO DRIVE SEGMENTAL GROWTH
                    TABLE 155 PASSENGER CAR: MARKET, BY APPLICATION, 2019–2022 (USD MILLION)
                    TABLE 156 PASSENGER CAR: MARKET, BY APPLICATION, 2023–2028 (USD MILLION)
                    TABLE 157 PASSENGER CAR: MARKET, BY APPLICATION, 2019–2022 (MILLION UNITS)
                    TABLE 158 PASSENGER CAR: MARKET, BY APPLICATION, 2023–2028 (MILLION UNITS)
                    FIGURE 48 ASIA PACIFIC TO EXHIBIT HIGHEST CAGR IN AUTOMOTIVE SENSORS MARKET FOR PASSENGER CARS DURING FORECAST PERIOD
                    TABLE 159 PASSENGER CAR: MARKET, BY REGION, 2019–2022 (USD MILLION)
                    TABLE 160 PASSENGER CAR: MARKET, BY REGION, 2023–2028 (USD MILLION)
                    TABLE 161 PASSENGER CAR: MARKET, BY REGION, 2019–2022 (MILLION UNITS)
                    TABLE 162 PASSENGER CAR: AUTOMOTIVE SENSOR MARKET, BY REGION, 2023–2028 (MILLION UNITS)
    8.3 LCV 
           8.3.1 SURGING DEMAND FOR LIGHT COMMERCIAL VEHICLES TO DRIVE MARKET GROWTH
                    TABLE 163 LCV: AUTOMOTIVE SENSORS MARKET, BY APPLICATION, 2019–2022 (USD MILLION)
                    TABLE 164 LCV: MARKET, BY APPLICATION, 2023–2028 (USD MILLION)
                    TABLE 165 LCV: MARKET, BY APPLICATION, 2019–2022 (MILLION UNITS)
                    TABLE 166 LCV: MARKET, BY APPLICATION, 2023–2028 (MILLION UNITS)
                    TABLE 167 LCV: MARKET, BY REGION, 2019–2022 (USD MILLION)
                    TABLE 168 LCV: MARKET, BY REGION, 2023–2028 (USD MILLION)
                    TABLE 169 LCV: MARKET, BY REGION, 2019–2022 (MILLION UNITS)
                    TABLE 170 LCV: AUTOMOTIVE SENSOR MARKET, BY REGION, 2023–2028 (MILLION UNITS)
    8.4 HCV 
           8.4.1 RISING DEMAND FOR FUEL-EFFICIENT VEHICLES TO DRIVE SEGMENTAL GROWTH
                    TABLE 171 HCV: AUTOMOTIVE SENSORS MARKET, BY APPLICATION, 2019–2022 (USD MILLION)
                    TABLE 172 HCV: MARKET, BY APPLICATION, 2023–2028 (USD MILLION)
                    TABLE 173 HCV: MARKET, BY APPLICATION, 2019–2022 (MILLION UNITS)
                    TABLE 174 HCV: MARKET, BY APPLICATION, 2023–2028 (MILLION UNITS)
                    TABLE 175 HCV: MARKET, BY REGION, 2019–2022 (USD MILLION)
                    TABLE 176 HCV: MARKET, BY REGION, 2023–2028 (USD MILLION)
                    TABLE 177 HCV: MARKET, BY REGION, 2019–2022 (MILLION UNITS)
                    TABLE 178 HCV: AUTOMOTIVE SENSOR MARKET, BY REGION, 2023–2028 (MILLION UNITS)
 
9 AUTOMOTIVE SENSOR MARKET, BY APPLICATION (Page No. - 185)
    9.1 INTRODUCTION 
           FIGURE 49 AUTOMOTIVE SENSOR MARKET, BY APPLICATION
           FIGURE 50 SAFETY & CONTROL SYSTEMS TO REGISTER HIGHEST CAGR FROM 2023 TO 2028
           TABLE 179 AUTOMOTIVE SENSORS MARKET, BY APPLICATION, 2019–2022 (USD MILLION)
           TABLE 180 MARKET, BY APPLICATION, 2023–2028 (USD MILLION)
           TABLE 181 MARKET, BY APPLICATION, 2019–2022 (MILLION UNITS)
           TABLE 182 MARKET, BY APPLICATION, 2023–2028 (MILLION UNITS)
    9.2 POWERTRAIN SYSTEMS 
           9.2.1 NEED TO IMPROVE FUEL EFFICIENCY TO DRIVE INNOVATIONS IN POWERTRAIN SYSTEMS
                    FIGURE 51 PASSENGER CAR SEGMENT TO LEAD AUTOMOTIVE SENSOR MARKET FOR POWERTRAIN SYSTEMS DURING FORECAST PERIOD
                    TABLE 183 POWERTRAIN SYSTEMS: MARKET, BY VEHICLE TYPE, 2019–2022 (USD MILLION)
                    TABLE 184 POWERTRAIN SYSTEMS: MARKET, BY VEHICLE TYPE, 2023–2028 (USD MILLION)
                    TABLE 185 POWERTRAIN SYSTEMS: MARKET, BY VEHICLE TYPE, 2019–2022 (MILLION UNITS)
                    TABLE 186 POWERTRAIN SYSTEMS: MARKET, BY VEHICLE TYPE, 2023–2028 (MILLION UNITS)
    9.3 CHASSIS 
           9.3.1 DEPLOYMENT OF AUTOMOTIVE SENSORS IN CHASSIS TO IMPROVE VEHICLE SAFETY AND STABILITY
                    TABLE 187 CHASSIS: AUTOMOTIVE SENSORS MARKET, BY VEHICLE TYPE, 2019–2022 (USD MILLION)
                    TABLE 188 CHASSIS: MARKET, BY VEHICLE TYPE, 2023–2028 (USD MILLION)
                    TABLE 189 CHASSIS: MARKET, BY VEHICLE TYPE, 2019–2022 (MILLION UNITS)
                    TABLE 190 CHASSIS: MARKET, BY VEHICLE TYPE, 2023–2028 (MILLION UNITS)
    9.4 EXHAUST SYSTEMS 
           9.4.1 STRINGENT EMISSION STANDARDS TO DRIVE DEMAND FOR EXHAUST SYSTEMS
                    TABLE 191 EXHAUST SYSTEMS: AUTOMOTIVE SENSOR MARKET, BY VEHICLE TYPE, 2019–2022 (USD MILLION)
                    TABLE 192 EXHAUST SYSTEMS: MARKET, BY VEHICLE TYPE, 2023–2028 (USD MILLION)
                    TABLE 193 EXHAUST SYSTEMS: MARKET, BY VEHICLE TYPE, 2019–2022 (MILLION UNITS)
                    TABLE 194 EXHAUST SYSTEMS: MARKET, BY VEHICLE TYPE, 2023–2028 (MILLION UNITS)
    9.5 SAFETY & CONTROL SYSTEMS 
           9.5.1 INCREASED FOCUS ON VEHICLE AND PASSENGER SAFETY TO DRIVE MARKET
                    FIGURE 52 PASSENGER CAR SEGMENT TO DOMINATE AUTOMOTIVE SENSOR MARKET FOR SAFETY & CONTROL SYSTEMS DURING FORECAST PERIOD
                    TABLE 195 SAFETY & CONTROL SYSTEMS: AUTOMOTIVE SENSORS MARKET, BY VEHICLE TYPE, 2019–2022 (USD MILLION)
                    TABLE 196 SAFETY & CONTROL SYSTEMS: MARKET, BY VEHICLE TYPE, 2023–2028 (USD MILLION)
                    TABLE 197 SAFETY & CONTROL SYSTEMS: MARKET, BY VEHICLE TYPE, 2019–2022 (MILLION UNITS)
                    TABLE 198 SAFETY & CONTROL SYSTEMS: MARKET, BY VEHICLE TYPE, 2023–2028 (MILLION UNITS)
    9.6 VEHICLE BODY ELECTRONICS 
           9.6.1 INTEGRATION OF ADVANCED ELECTRONIC COMPONENTS IN VEHICLES TO SUPPORT SEGMENTAL GROWTH
                    TABLE 199 VEHICLE BODY ELECTRONICS: AUTOMOTIVE SENSORS MARKET, BY VEHICLE TYPE, 2019–2022 (USD MILLION)
                    TABLE 200 VEHICLE BODY ELECTRONICS: MARKET, BY VEHICLE TYPE, 2023–2028 (USD MILLION)
                    TABLE 201 VEHICLE BODY ELECTRONICS: MARKET, BY VEHICLE TYPE, 2019–2022 (MILLION UNITS)
                    TABLE 202 VEHICLE BODY ELECTRONICS: MARKET, BY VEHICLE TYPE, 2023–2028 (MILLION UNITS)
    9.7 TELEMATICS SYSTEMS 
           9.7.1 STRINGENT GOVERNMENT NORMS REGARDING PASSENGER SAFETY AND SECURITY TO PROMOTE ADOPTION OF TELEMATICS SYSTEMS
                    TABLE 203 TELEMATICS SYSTEMS: AUTOMOTIVE SENSOR MARKET, BY VEHICLE TYPE, 2019–2022 (USD MILLION)
                    TABLE 204 TELEMATICS SYSTEMS: MARKET, BY VEHICLE TYPE, 2023–2028 (USD MILLION)
                    TABLE 205 TELEMATICS SYSTEMS: MARKET, BY VEHICLE TYPE, 2019–2022 (MILLION UNITS)
                    TABLE 206 TELEMATICS SYSTEMS: MARKET, BY VEHICLE TYPE, 2023–2028 (MILLION UNITS)
    9.8 DRIVER ASSISTANCE & AUTOMATION 
           9.8.1 INCREASED ADOPTION OF ADVANCED TECHNOLOGIES TO IMPROVE PASSENGER AND ROAD SAFETY TO SUPPORT MARKET GROWTH
                    TABLE 207 DRIVER ASSISTANCE & AUTOMATION: AUTOMOTIVE SENSORS MARKET, BY VEHICLE TYPE, 2019–2022 (USD MILLION)
                    TABLE 208 DRIVER ASSISTANCE & AUTOMATION: MARKET, BY VEHICLE TYPE, 2023–2028 (USD MILLION)
                    TABLE 209 DRIVER ASSISTANCE & AUTOMATION: MARKET, BY VEHICLE TYPE, 2019–2022 (MILLION UNITS)
                    TABLE 210 DRIVER ASSISTANCE & AUTOMATION: MARKET, BY VEHICLE TYPE, 2023–2028 (MILLION UNITS)
    9.9 OTHER APPLICATIONS 
           TABLE 211 OTHER APPLICATIONS: MARKET, BY VEHICLE TYPE, 2019–2022 (USD MILLION)
           TABLE 212 OTHER APPLICATIONS: MARKET, BY VEHICLE TYPE, 2023–2028 (USD MILLION)
           TABLE 213 OTHER APPLICATIONS: MARKET, BY VEHICLE TYPE, 2019–2022 (MILLION UNITS)
           TABLE 214 OTHER APPLICATIONS: MARKET, BY VEHICLE TYPE, 2023–2028 (MILLION UNITS)
 
10 AUTOMOTIVE SENSOR MARKET, BY REGION (Page No. - 205)
     10.1 INTRODUCTION 
             FIGURE 53 AUTOMOTIVE SENSOR MARKET, BY REGION
             FIGURE 54 ASIA PACIFIC TO REGISTER HIGHEST CAGR IN AUTOMOTIVE SENSORS MARKET DURING FORECAST PERIOD
             TABLE 215 MARKET, BY REGION, 2019–2022 (USD MILLION)
             TABLE 216 MARKET, BY REGION, 2023–2028 (USD MILLION)
             TABLE 217 MARKET, BY REGION, 2019–2022 (MILLION UNITS)
             TABLE 218 MARKET, BY REGION, 2023–2028 (MILLION UNITS)
     10.2 NORTH AMERICA 
             10.2.1 NORTH AMERICA: RECESSION IMPACT
                        FIGURE 55 NORTH AMERICA: AUTOMOTIVE SENSORS MARKET SNAPSHOT
                        TABLE 219 NORTH AMERICA: MARKET, BY SENSOR TYPE, 2019–2022 (USD MILLION)
                        TABLE 220 NORTH AMERICA: MARKET, BY SENSOR TYPE, 2023–2028 (USD MILLION)
                        TABLE 221 NORTH AMERICA: MARKET, BY SENSOR TYPE, 2019–2022 (MILLION UNITS)
                        TABLE 222 NORTH AMERICA: MARKET, BY SENSOR TYPE, 2023–2028 (MILLION UNITS)
                        FIGURE 56 US TO LEAD NORTH AMERICAN AUTOMOTIVE SENSOR MARKET DURING FORECAST PERIOD
                        TABLE 223 NORTH AMERICA: MARKET, BY COUNTRY, 2019–2022 (USD MILLION)
                        TABLE 224 NORTH AMERICA: MARKET, BY COUNTRY, 2023–2028 (USD MILLION)
                        TABLE 225 NORTH AMERICA: MARKET, BY COUNTRY, 2019–2022 (MILLION UNITS)
                        TABLE 226 NORTH AMERICA: MARKET, BY COUNTRY, 2023–2028 (MILLION UNITS)
                        TABLE 227 NORTH AMERICA: MARKET, BY VEHICLE TYPE, 2019–2022 (USD MILLION)
                        TABLE 228 NORTH AMERICA: MARKET, BY VEHICLE TYPE, 2023–2028 (USD MILLION)
                        TABLE 229 NORTH AMERICA: MARKET, BY VEHICLE TYPE, 2019–2022 (MILLION UNITS)
                        TABLE 230 NORTH AMERICA: AUTOMOTIVE SENSOR MARKET, BY VEHICLE TYPE, 2023–2028 (MILLION UNITS)
             10.2.2 US
                        10.2.2.1 Increased demand for autonomous and electric vehicles to drive market
             10.2.3 CANADA
                        10.2.3.1 Government-led initiatives to reduce vehicular emissions to boost demand for automotive sensors
             10.2.4 MEXICO
                        10.2.4.1 Rising number of free-trade agreements with other countries to create opportunities for market players
     10.3 EUROPE 
             10.3.1 EUROPE: RECESSION IMPACT
                        FIGURE 57 EUROPE: AUTOMOTIVE SENSORS MARKET SNAPSHOT
                        TABLE 231 EUROPE: MARKET, BY SENSOR TYPE, 2019–2022 (USD MILLION)
                        TABLE 232 EUROPE: MARKET, BY SENSOR TYPE, 2023–2028 (USD MILLION)
                        TABLE 233 EUROPE: MARKET, BY SENSOR TYPE, 2019–2022 (MILLION UNITS)
                        TABLE 234 EUROPE: MARKET, BY SENSOR TYPE, 2023–2028 (MILLION UNITS)
                        FIGURE 58 GERMANY TO COMMAND EUROPEAN AUTOMOTIVE SENSOR MARKET THROUGHOUT FORECAST PERIOD
                        TABLE 235 EUROPE: MARKET, BY COUNTRY, 2019–2022 (USD MILLION)
                        TABLE 236 EUROPE: MARKET, BY COUNTRY, 2023–2028 (USD MILLION)
                        TABLE 237 EUROPE: MARKET, BY COUNTRY, 2019–2022 (MILLION UNITS)
                        TABLE 238 EUROPE: MARKET, BY COUNTRY, 2023–2028 (MILLION UNITS)
                        TABLE 239 EUROPE: MARKET, BY VEHICLE TYPE, 2019–2022 (USD MILLION)
                        TABLE 240 EUROPE: MARKET, BY VEHICLE TYPE, 2023–2028 (USD MILLION)
                        TABLE 241 EUROPE: MARKET, BY VEHICLE TYPE, 2019–2022 (MILLION UNITS)
                        TABLE 242 EUROPE: AUTOMOTIVE SENSOR MARKET, BY VEHICLE TYPE, 2023–2028 (MILLION UNITS)
             10.3.2 GERMANY
                        10.3.2.1 Large presence of major automobile OEMs to drive market
             10.3.3 UK
                        10.3.3.1 Rising implementation of automotive sensors in luxury cars to fuel market growth
             10.3.4 FRANCE
                        10.3.4.1 Promotion of electric and hybrid vehicles to boost demand for automotive sensors
             10.3.5 SPAIN
                        10.3.5.1 Presence of stringent vehicular emission norms to boost demand for advanced automotive sensors
             10.3.6 ITALY
                        10.3.6.1 High demand for small city cars, sports cars, and supercars to contribute to market growth
             10.3.7 REST OF EUROPE
     10.4 ASIA PACIFIC 
             10.4.1 ASIA PACIFIC: RECESSION IMPACT
                        FIGURE 59 ASIA PACIFIC: AUTOMOTIVE SENSORS MARKET SNAPSHOT
                        TABLE 243 ASIA PACIFIC: MARKET, BY SENSOR TYPE, 2019–2022 (USD MILLION)
                        TABLE 244 ASIA PACIFIC: MARKET, BY SENSOR TYPE, 2023–2028 (USD MILLION)
                        TABLE 245 ASIA PACIFIC: MARKET, BY SENSOR TYPE, 2019–2022 (MILLION UNITS)
                        TABLE 246 ASIA PACIFIC: MARKET, BY SENSOR TYPE, 2023–2028 (MILLION UNITS)
                        FIGURE 60 CHINA TO LEAD ASIA PACIFIC AUTOMOTIVE SENSOR MARKET DURING FORECAST PERIOD
                        TABLE 247 ASIA PACIFIC:  MARKET, BY COUNTRY, 2019–2022 (USD MILLION)
                        TABLE 248 ASIA PACIFIC: MARKET, BY COUNTRY, 2023–2028 (USD MILLION)
                        TABLE 249 ASIA PACIFIC: MARKET, BY COUNTRY, 2019–2022 (MILLION UNITS)
                        TABLE 250 ASIA PACIFIC: MARKET, BY COUNTRY, 2023–2028 (MILLION UNITS)
                        TABLE 251 ASIA PACIFIC: MARKET, BY VEHICLE TYPE, 2019–2022 (USD MILLION)
                        TABLE 252 ASIA PACIFIC: MARKET, BY VEHICLE TYPE, 2023–2028 (USD MILLION)
                        TABLE 253 ASIA PACIFIC: MARKET, BY VEHICLE TYPE, 2019–2022 (MILLION UNITS)
                        TABLE 254 ASIA PACIFIC: AUTOMOTIVE SENSOR MARKET, BY VEHICLE TYPE, 2023–2028 (MILLION UNITS)
             10.4.2 CHINA
                        10.4.2.1 Growing use of LiDAR sensors in modern-day vehicles to drive market
             10.4.3 JAPAN
                        10.4.3.1 Rising focus on manufacturing technologically advanced vehicles to boost demand for automotive sensors
             10.4.4 SOUTH KOREA
                        10.4.4.1 Increasing demand for vehicle safety and comfort to fuel market growth
             10.4.5 INDIA
                        10.4.5.1 Growing interest of foreign direct investors in automotive sector to create lucrative opportunities
             10.4.6 REST OF ASIA PACIFIC
     10.5 ROW 
             10.5.1 ROW: RECESSION IMPACT
                        TABLE 255 ROW: AUTOMOTIVE SENSORS MARKET, BY SENSOR TYPE, 2019–2022 (USD MILLION)
                        TABLE 256 ROW: MARKET, BY SENSOR TYPE, 2023–2028 (USD MILLION)
                        TABLE 257 ROW: MARKET, BY SENSOR TYPE, 2019–2022 (MILLION UNITS)
                        TABLE 258 ROW: MARKET, BY SENSOR TYPE, 2023–2028 (MILLION UNITS)
                        FIGURE 61 SOUTH AMERICA TO DOMINATE AUTOMOTIVE SENSOR MARKET IN ROW DURING FORECAST PERIOD
                        TABLE 259 ROW: MARKET, BY REGION, 2019–2022 (USD MILLION)
                        TABLE 260 ROW: MARKET, BY REGION, 2023–2028 (USD MILLION)
                        TABLE 261 ROW: MARKET, BY REGION, 2019–2022 (MILLION UNITS)
                        TABLE 262 ROW: MARKET, BY REGION, 2023–2028 (MILLION UNITS)
                        TABLE 263 ROW: MARKET, BY VEHICLE TYPE, 2019–2022 (USD MILLION)
                        TABLE 264 ROW: MARKET, BY VEHICLE TYPE, 2023–2028 (USD MILLION)
                        TABLE 265 ROW: MARKET, BY VEHICLE TYPE, 2019–2022 (MILLION UNITS)
                        TABLE 266 ROW: MARKET, BY VEHICLE TYPE, 2023–2028 (MILLION UNITS)
             10.5.2 MIDDLE EAST & AFRICA
                        10.5.2.1 Rising demand for safe and fuel-efficient cars to foster market growth
             10.5.3 SOUTH AMERICA
                        10.5.3.1 Expansion of automobile OEMs into new untapped markets to boost demand
 
11 COMPETITIVE LANDSCAPE (Page No. - 247)
     11.1 OVERVIEW 
     11.2 STRATEGIES ADOPTED BY KEY PLAYERS 
             TABLE 267 OVERVIEW OF STRATEGIES DEPLOYED BY KEY AUTOMOTIVE SENSOR PROVIDERS
     11.3 REVENUE ANALYSIS 
             FIGURE 62 FIVE-YEAR REVENUE ANALYSIS OF TOP 5 PLAYERS IN AUTOMOTIVE SENSOR MARKET, 2018–2022
     11.4 MARKET SHARE ANALYSIS 
             FIGURE 63 AUTOMOTIVE SENSOR MARKET SHARE ANALYSIS, 2022
             TABLE 268 AUTOMOTIVE SENSOR MARKET: MARKET SHARE ANALYSIS, 2022
     11.5 COMPANY EVALUATION MATRIX, 2022 
             11.5.1 STARS
             11.5.2 EMERGING LEADERS
             11.5.3 PERVASIVE PLAYERS
             11.5.4 PARTICIPANTS
                        FIGURE 64 AUTOMOTIVE SENSOR MARKET: COMPANY EVALUATION MATRIX, 2022
             11.5.5 COMPANY FOOTPRINT
                        TABLE 269 COMPANY FOOTPRINT: APPLICATION
                        TABLE 270 COMPANY FOOTPRINT: REGION
                        TABLE 271 OVERALL COMPANY FOOTPRINT
     11.6 STARTUPS/SMALL AND MEDIUM-SIZED ENTERPRISES (SMES) EVALUATION MATRIX, 2022 
             11.6.1 PROGRESSIVE COMPANIES
             11.6.2 RESPONSIVE COMPANIES
             11.6.3 DYNAMIC COMPANIES
             11.6.4 STARTING BLOCKS
                        FIGURE 65 STARTUPS/SMALL AND MEDIUM-SIZED ENTERPRISES (SMES) EVALUATION MATRIX, 2022
             11.6.5 COMPETITIVE BENCHMARKING OF KEY STARTUPS/SMES
                        TABLE 272 AUTOMOTIVE SENSOR MARKET: LIST OF KEY STARTUPS/SMES
                        TABLE 273 AUTOMOTIVE SENSOR MARKET: COMPETITIVE BENCHMARKING OF KEY STARTUPS/SMES
     11.7 COMPETITIVE SCENARIOS AND TRENDS 
             11.7.1 PRODUCT LAUNCHES
                        TABLE 274 PRODUCT LAUNCHES, JANUARY 2019–JUNE 2023
             11.7.2 DEALS
                        TABLE 275 DEALS, JANUARY 2019–AUGUST 2023
             11.7.3 OTHERS
                        TABLE 276 EXPANSIONS AND INVESTMENTS, JULY 2019–AUGUST 2023
 
12 COMPANY PROFILES (Page No. - 279)
(Business Overview, Products/Solutions/Services Offered, Recent Developments, MnM view (Key strengths/Right to win, Strategic choices made, Weakness/competitive threats)*  
     12.1 KEY PLAYERS 
             12.1.1 ROBERT BOSCH GMBH
                        TABLE 277 ROBERT BOSCH GMBH: COMPANY OVERVIEW
                        FIGURE 66 ROBERT BOSCH GMBH: COMPANY SNAPSHOT
             12.1.2 ON SEMICONDUCTOR
                        TABLE 278 ON SEMICONDUCTOR: COMPANY OVERVIEW
                        FIGURE 67 ON SEMICONDUCTOR: COMPANY SNAPSHOT
             12.1.3 OMNIVISION
                        TABLE 279 OMNIVISION: COMPANY OVERVIEW
             12.1.4 TE CONNECTIVITY
                        TABLE 280 TE CONNECTIVITY: COMPANY OVERVIEW
                        FIGURE 68 TE CONNECTIVITY: COMPANY SNAPSHOT
             12.1.5 CONTINENTAL AG
                        TABLE 281 CONTINENTAL AG: COMPANY OVERVIEW
                        FIGURE 69 CONTINENTAL AG: COMPANY SNAPSHOT
             12.1.6 DENSO CORPORATION
                        TABLE 282 DENSO CORPORATION: COMPANY OVERVIEW
                        FIGURE 70 DENSO CORPORATION: COMPANY SNAPSHOT
             12.1.7 INFINEON TECHNOLOGIES AG
                        TABLE 283 INFINEON TECHNOLOGIES AG: COMPANY OVERVIEW
                        FIGURE 71 INFINEON TECHNOLOGIES AG: COMPANY SNAPSHOT
             12.1.8 NXP SEMICONDUCTORS
                        TABLE 284 NXP SEMICONDUCTORS: COMPANY OVERVIEW
                        FIGURE 72 NXP SEMICONDUCTORS: COMPANY SNAPSHOT
             12.1.9 PANASONIC
                        TABLE 285 PANASONIC: COMPANY OVERVIEW
                        FIGURE 73 PANASONIC: COMPANY SNAPSHOT
             12.1.10 ALLEGRO MICROSYSTEMS, INC.
                        TABLE 286 ALLEGRO MICROSYSTEMS, INC.: COMPANY OVERVIEW
                        FIGURE 74 ALLEGRO MICROSYSTEMS, INC.: COMPANY SNAPSHOT
     12.2 OTHER KEY PLAYERS 
             12.2.1 SENSATA TECHNOLOGIES, INC.
             12.2.2 BORGWARNER INC.
             12.2.3 ANALOG DEVICES, INC.
             12.2.4 ELMOS SEMICONDUCTOR SE
             12.2.5 APTIV.
             12.2.6 CTS CORPORATION
             12.2.7 AUTOLIV, INC.
             12.2.8 STMICROELECTRONICS
             12.2.9 ZF FRIEDRICHSHAFEN AG
             12.2.10 QUANERGY SOLUTIONS, INC.
             12.2.11 INNOVIZ TECHNOLOGIES LTD.
             12.2.12 VALEO S.A.
             12.2.13 MAGNA INTERNATIONAL INC.
             12.2.14 MELEXIS
             12.2.15 AMPHENOL ADVANCED SENSORS
*Details on Business Overview, Products/Solutions/Services Offered, Recent Developments, MnM view (Key strengths/Right to win, Strategic choices made, Weakness/competitive threats)* might not be captured in case of unlisted companies.  
 
13 APPENDIX (Page No. - 347)
     13.1 DISCUSSION GUIDE 
     13.2 KNOWLEDGESTORE: MARKETSANDMARKETS’ SUBSCRIPTION PORTAL 
     13.3 CUSTOMIZATION OPTIONS 
     13.4 RELATED REPORTS 
     13.5 AUTHOR DETAILS 
 

The study involved four major activities in estimating the size of the automotive sensor market. Exhaustive secondary research has been done to collect information on the market, peer market, and parent market. Validation of these findings, assumptions, and sizing with industry experts across the value chain through primary research has been the next step. Both top-down and bottom-up approaches have been employed to estimate the global market size. After that, market breakdown and data triangulation have been used to estimate the market sizes of segments and subsegments.

Secondary Research

Revenues of companies offering automotive sensors worldwide have been obtained based on the secondary data accessed through paid and unpaid sources. They have also been derived by analyzing the product portfolios of key companies, rated according to the performance and quality of their products.

In the secondary research process, various sources have been referred to for identifying and collecting information for this study on the automotive sensor market. Secondary sources considered for this research study include government sources; corporate filings (such as annual reports, investor presentations, and financial statements); and trade, business, and professional associations. Secondary data has been collected and analyzed to determine the overall market size, further validated through primary research.

Secondary research has been mainly used to obtain key information about the supply chain of automotive sensors to identify the key players based on their products and the prevailing industry trends in the automotive sensor market according to sensor type, sales channel, vehicle type, application, and region. It also includes information about the key developments undertaken from market- and technology-oriented perspectives.

Primary Research

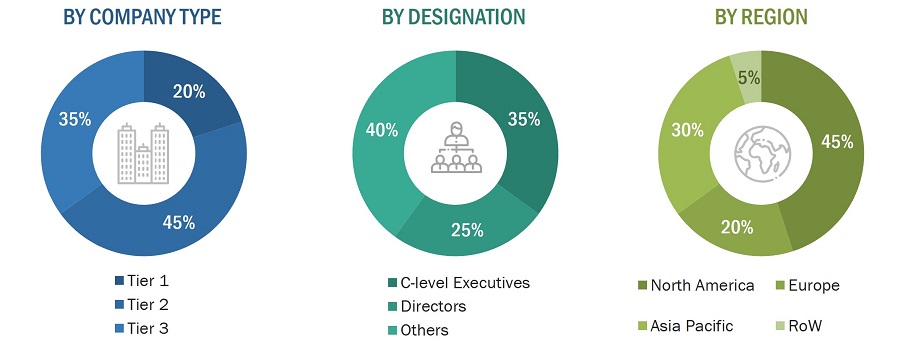
Extensive primary research has been conducted after understanding and analyzing the current scenario of the automotive sensor market through secondary research. Several primary interviews have been conducted with key opinion leaders from the demand and supply sides across four regions—North America, Europe, Asia Pacific, and RoW. Approximately 25% of primary interviews were conducted with demand and ~75% with supply side. Data was collected through questionnaires, emails, and phone interviews..
Automotive Sensors Market Size, and Share

To know about the assumptions considered for the study, download the pdf brochure

Market Size Estimation

Both top-down and bottom-up approaches have been used to estimate and validate the total size of the automotive sensor market. These methods have also been extensively used to estimate the sizes of various market subsegments. The research methodology used to estimate the market sizes includes the following:

  • Identifying the number of automotive sensors shipped at the global level.
  • Determining average selling prices of automotive sensors shipped globally.
  • Conducting multiple discussion sessions with key opinion leaders to understand different automotive sensors and their deployment in various products and applications; analyzing the break-up of the work carried out by each key company.
  • Verifying and crosschecking estimates at every level with key opinion leaders, including chief executive officers (CEO), directors, and operation managers, and finally, with the domain experts of MarketsandMarkets.
  • Analyzing various paid and unpaid sources of information such as annual reports, press releases, white papers, and databases of the company- and region-specific developments undertaken in the automotive sensor market.

Market Size Estimation Methodology-Bottom-up Approach

Automotive Sensors Market Size, and Bottom-up Approach

Market Size Estimation Methodology-Top-Down Approach

Automotive Sensors Market Size, and Top-Down Approach

Data Triangulation

After arriving at the overall size of the automotive sensor market through the process explained above, the total market has been split into several segments and subsegments. Where applicable, market breakdown and data triangulation procedures have been employed to complete the overall market engineering process and arrive at the exact statistics for all segments and subsegments. The data has been triangulated by studying various factors and trends from the demand and supply sides. The market has also been validated using top-down and bottom-up approaches.

The main objectives of this study are as follows:

  • To segment and forecast the global automotive sensor market, by sales channel, sensor type, vehicle type, and application in terms of value and volume
  • To describe and forecast the market size of various segments across major regions, namely, North America, Europe, Asia Pacific, and Rest of World (RoW), in terms of value and volume
  • To provide industry-specific information regarding the drivers, restraints, opportunities, and challenges influencing the growth of the automotive sensor market
  • To provide an overview of the supply chain of the automotive sensor ecosystem, along with the average selling prices of automotive sensors
  • To strategically analyze the ecosystem, tariffs and regulations, patent landscape, Porter’s five forces, technology trends, regulations, import and export scenarios, trade landscape, and case studies pertaining to the market under study
  • To strategically analyze micromarkets1 concerning individual growth trends, prospects, and contributions to the overall market
  • To analyze opportunities in the market for stakeholders by identifying high-growth segments
  • To provide details of the competitive landscape for market leaders
  • To analyze competitive developments such as product launches, collaborations, expansions, partnerships, agreements, acquisitions, joint ventures, and contracts in the automotive sensors market
  • To profile key players in the automotive sensor market and comprehensively analyze their market ranking based on their revenue, market share, and core competencies.

Market Definition

Automotive sensors transform (or transduce) physical variables, such as pressure or acceleration, into electrical output signals that serve as inputs for control systems. Sensors are essential components of automotive electronic control systems. Various sensors monitor and control several parameters in an automobile, such as speed, position, level, pressure, inertia, temperature, oxygen level, nitrogen oxide (NOx) level, and position. The data collected by these sensors is provided to the electronic control unit (ECU) for control actions. This data helps improve vehicle performance, passenger and road safety, comfort, and travelers' convenience.

The car dictionary defines automotive sensors as sensors that are the sensory organs of a vehicle. They are a fundamental component of electronic control systems and must record physical or chemical variables and convert them into electrical signals.

Automotive sensors are intelligent systems that control different aspects, such as temperature, coolant levels, oil pressure, and vehicle emission levels. Over the past 30 years, electronic systems for vehicles have changed significantly. With advancements in automotive technology, more automobile manufacturers are integrating automotive sensors to offer higher vehicle control and safety levels.

Stakeholders

  • Raw material suppliers
  • Original equipment manufacturers (OEMs)
  • Technology solution providers
  • Research institutes
  • Market research and consulting firms
  • Governments and financial institutions
  • Analysts and strategic business planners

Research Objectives

  • To define, describe, and forecast the automotive sensor market size, sales channel, sensor types, vehicle types, application, and region in terms of value and volume
  • To forecast the market size, in terms of value, for various segments with respect to four main regions—North America, Europe, Asia Pacific, and the Rest of the World (RoW)
  • To strategically analyze the micro markets with respect to individual growth trends, prospects, and contributions to the overall market
  • To identify the drivers, restraints, opportunities, and challenges impacting the growth of the market and submarkets
  • To analyze the automotive sensor supply chain and identify opportunities for the supply chain participants
  • To provide key technology trends and patent analysis related to the automotive sensor market
  • To provide information regarding trade data related to the automotive sensor market
  • To analyze opportunities in the market for stakeholders by identifying the high-growth segments of the automotive sensor ecosystem
  • To strategically profile the key players in the automotive sensor market and comprehensively analyze their market shares and core competencies in each segment
  • To benchmark the market players using the proprietary company evaluation matrix framework, which analyzes the market players on various parameters within the broad categories of market ranking/share and product portfolio
  • To analyze competitive developments such as product launches, alliances and partnerships, joint ventures, and mergers and acquisitions in the automotive sensor market

Available Customizations:

MarketsandMarkets offers the following customizations for this market report:

  • Further breakdown of the market in different regions at the country-level
  • Detailed analysis and profiling of additional market players (up to 5)
Custom Market Research Services

We will customize the research for you, in case the report listed above does not meet with your exact requirements. Our custom research will comprehensively cover the business information you require to help you arrive at strategic and profitable business decisions.

Request Customization

Instant Answers with GPT - Ask Now!

Ask real questions. Get complete answers !
Report Code
SE 2489
Published ON
Oct, 2023
Choose License Type
BUY NOW
  • SHARE
X
Request Customization
Speak to Analyst
Speak to Analyst
OR FACE-TO-FACE MEETING
PERSONALIZE THIS RESEARCH
  • Triangulate with your Own Data
  • Get Data as per your Format and Definition
  • Gain a Deeper Dive on a Specific Application, Geography, Customer or Competitor
  • Any level of Personalization
REQUEST A FREE CUSTOMIZATION
LET US HELP YOU!
  • What are the Known and Unknown Adjacencies Impacting the Automotive Sensors Market
  • What will your New Revenue Sources be?
  • Who will be your Top Customer; what will make them switch?
  • Defend your Market Share or Win Competitors
  • Get a Scorecard for Target Partners
CUSTOMIZED WORKSHOP REQUEST
+1-888-600-6441
  • Call Us
  • +1-888-600-6441 (Corporate office hours)
  • +1-888-600-6441 (US/Can toll free)
  • +44-800-368-9399 (UK office hours)
CONNECT WITH US
ABOUT TRUST ONLINE
©2024 MarketsandMarkets Research Private Ltd. All rights reserved
DMCA.com Protection Status Website Feedback