Automotive Test Equipment Market

Automotive Test Equipment Market by Product (Engine, Chassis, and Transmission Dynamometer, Vehicle Emission, Wheel Alignment, & Fuel Injection Pump Tester), End Market, Vehicle, Application, Advance Technology, and Region - Global Forecast to 2025

Report Code: AT 2774 Jul, 2020, by marketsandmarkets.com

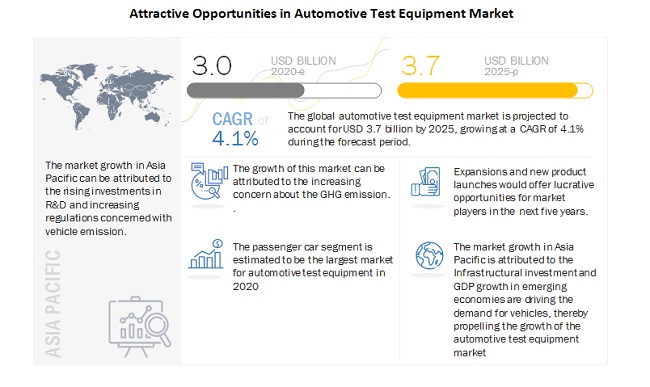
[253 Pages Report] The global automotive test equipment market size was valued at USD 3.0 billion in 2020 and is expected to reach USD 3.7 billion by 2025, at a CAGR of 4.1% during the forecast period 2020-2025. The automobile industry has witnessed a continuous increase in the integration of electronics architecture in vehicles. The rising demand for safety and comfort features has led to huge innovations and R&D efforts from OEMs and automotive suppliers for the testing of electronics components and compliance with government regulations. Moreover, the overall weight of the vehicles has increased due to the integration of electronic features. The regulations about vehicular fuel consumption and emissions will boost the demand for market.

The COVID-19 pandemic has led to the suspension of vehicle production and supply disruptions, which have brought the automotive industry to a halt. Lower vehicle sales will be a major concern for automotive OEMs for the next few quarters. According to experts, there is a slim chance of vehicle sale recovery in 2020. However, the automotive test equipment might experience an increased growth rate, which can be attributed to the increasing regulations concerned with the GHG emission from the vehicles. The increasing energy conservation movement/regulations concerned with automobiles will also impact the automotive test equipment market positively.
Automotive Test Equipment Market

To know about the assumptions considered for the study, Request for Free Sample Report

COVID-19 impact on Automotive Test Equipment market:

Major automotive test equipment providers such as Bosch, Continental, etc. have announced the suspension of production due to the lowered demand, supply chain bottlenecks, and to protect the safety of their employees in France, Germany, Italy, and Spain during the COVID-19 pandemic. As a result, the demand for automotive testing equipment is expected to decline in 2020. Manufacturers are likely to adjust production to prevent bottlenecks and plan production according to demand from OEMs and tier 1 manufacturers.

Major automotive test equipment providers lost revenue in Q1 2020. As the resumption of vehicle production is not likely in the immediate future due to the severity of the pandemic, especially in the US and major European countries, tier 1 players suspect a further decline in revenue in the remaining quarters of 2020. For instance, Continental has witnessed a decrease in operations due to the COVID-19 pandemic. As of April 2020, the increased outbreak of the virus has forced the company to temporarily cease production in more than 40 percent of its 249 production locations across the world. For the first quarter of 2020, Continental had estimated sales at USD 4.5 billion compared to USD 5.3 billion in 2019 during the same period. The impact of COVID-19, along with other factors, has resulted in a loss of approximately USD 800 million for the company. As per the IMF report, the year-on-year decline in the GDP of the US is estimated to be 5.9%, while 6.2% and 6.6% for Canada and Mexico respectively for the year 2020. This decline in GDP is expected to affect the future performance of the company significantly, as the North America region contributes to 26% of the company revenue. The major countries in Asia, such as China and India, are also expected to experience a year-on-year decline in GDP of 1.2% and 1.9%. As Asia contributes to 22% of the company’s sales, the impact of COVID-19 on Continental AG is expected to continue for the coming years, and its impact expected to be significantly large.

Market Dynamics:

Driver: Rise in stringent emissions norms to prevent environmental impact

The trend is to develop test equipment and its implementation to detect the emission levels in accordance with the law. The permissible NOx emissions from a diesel vehicle have dipped 10 times through 6 legislations (Euro 1 to Euro 6). There are emission standards that every vehicle must follow. The vehicle emission test system is used to test whether the vehicle follows the required standards of the industry. Moreover, test equipment and related software can help in detecting the emission level of passenger cars and improve fuel efficiency at the same time.

Also, the US Department of Transportation’s National Highway Traffic Safety Administration (NHSA) established a national program comprising new standards intended to reduce Greenhouse Gas (GHG) emissions and improve the fuel economy. The Environmental Protection Agency (EPA) has also set GHG emissions standards under the Clean Air Act to reduce the emission of greenhouse gases. The stringent Euro 6 norms, introduced by the European Union (EU), aim to make cars cleaner by lowering the exhaust emission of harmful gases such as nitrogen oxide (NOx), carbon monoxide (CO), and hydrocarbons. The new Euro 6 norms have different standards for petrol and diesel cars. These factors are fueling the growth of the automotive test equipment market, globally.

Restraint: Lack of R&D facilities for automotive test equipment

Numerous stringent emission norms and regulations mandated across the world have compelled OEMs to test their vehicles efficiently to ensure that they meet these norms. Modern vehicles such as hybrid cars with hybrid powertrains require different types of test equipment, such as mobile-based equipment and others. A limited number of companies, such as Ricardo (UK), Intertek (UK), and Horiba (Japan), provide testing solutions for hybrid cars. Various automobile manufacturers outsource these testing services, and this increases the overall price of the vehicle, which, in turn, affects vehicle sales. The testing of hybrid cars requires advanced research, as these cars need different types of test equipment. The lack of R&D facilities for automotive testing would result in less advanced and innovative products and hamper the quality of testing the vehicle.

Opportunity: Growing demand for onboard diagnostic tools

The demand for OBD testing has increased in recent years, owing to the self-diagnostic capability of OBD equipment. OBD provides complete control over the engine. In addition to detecting vehicle faults, OBD tools also offer emission control by providing early warnings about potential component failure. The troubleshooting properties of OBD-II allow users or technicians to detect vehicle faults. With the help of OBD tools, the user can read the status of the engine and diagnose the problem himself, rather than going to the auto shop to detect the problem.

Consumers tend to prefer application-based wireless devices, such as smartphones. Testing tool developers have developed various applications to work with OBD-II systems. For instance, Actron (US), a company that provides repair and diagnostic equipment, has released an application called Torque Pro for mobile devices that will allow users to perform vehicle diagnostics using their mobile phones. This application works wirelessly by connecting to the OBD-II serial port using Bluetooth technology. Torque Pro is also used to monitor the performance of the vehicle.

Challenge: Maintaining a balance between high cost & performance of test equipment

The dilemma faced by the automotive industry is between technological innovation and cost reduction. Technologies such as advance test equipment used for electric or hybrid vehicle testing come with an additional price tag compared to the conventional test equipment. Any technology takes time to become popular for its manufacturers to experience economies of scale. In the emerging economies, entry-level passenger cars are in demand, and automotive manufacturers need to provide their product at competitive prices. In this case, offering costly test equipment can be a hindrance. There is always a tradeoff between the incurring cost on product innovation and cost reduction by manufacturing conventional products. The challenge, therefore, is to come up with such automotive test equipment that are efficient and economical at the same time.
Connected Market

Passenger cars estimated to account for the largest market size during the forecast period

The passenger car segment is estimated to be the largest market for automotive test equipment in 2020. The increasing purchasing power of customers and the growing demand for passenger vehicles in emerging and developed countries have contributed to the growth of the automotive test equipment market for passenger vehicles. Also, the increasing stringency of mandates related to emissions and vehicle safety performance in several countries has inflated the demand for automotive test equipment.

Authorized service centers estimated to account for the largest market size during the forecast period

The increase in vehicle sales has driven the growth of the automotive test equipment market in authorized service centers. Also, the market has witnessed a rising number of innovations due to the growing demand for driver safety and vehicle diagnosis features that increase the durability of the automobile. With increasing functions of electronics in vehicles, stringent emission standards, and less time taken for diagnosis, the demand for equipment, software, and repair data has witnessed an increasing trend.

PC/Laptop based equipment estimated to account for the largest market size during the forecast period

PC/Laptop based testing equipment is primarily a hardware and software bundle, covering all the necessary cables, hardware, and software. These PC-based systems have features such as the capability to plot and log sensor data, calculate fuel efficiency, and estimate horsepower and torque. Also, many technicians prefer using PC/laptop-based equipment for data extraction and analysis from vehicle components.

Asia Pacific region is estimated to account for the largest market size during the forecast period

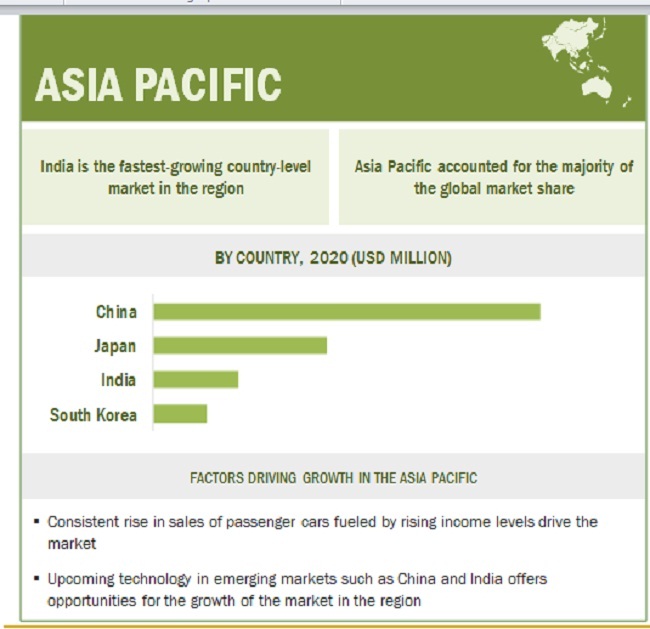
The Asia Pacific region has emerged as a hub for automobile production and is estimated to be the largest market for automotive test equipment during the forecast period. The growing purchasing power of consumers has triggered the demand for automobiles in the region. Cost advantages for OEMs, low automobile penetration levels, and increased vehicle production offer attractive market opportunities for automobile manufacturers and automotive component suppliers. Also, due to the availability of cheap labor and low production cost, many major OEMs have launched production plants in the region or joined hands with major domestic vehicle manufacturers. The Asia Pacific region is home to key suppliers of automotive test equipment such as Horiba (Japan), Autel (China), and Sinfonia (Japan).
Automotive Test Equipment Market By Region

To know about the assumptions considered for the study, download the pdf brochure

Key Market Players

The global automotive test equipment market is dominated by major players such as ABB (Switzerland), Robert Bosch GmbH (Germany), Horiba Ltd(Japan), Honeywell (US), Siemens AG (Germany), and Delphi  Technologies (UK). These companies have strong distribution networks at a global level. In addition, these companies offer an extensive range of products in the aftermarket. The key strategies adopted by these companies to sustain their market position are new product development, partnership, and expansion.

Get online access to the report on the World's First Market Intelligence Cloud

  • Easy to Download Historical Data & Forecast Numbers
  • Company Analysis Dashboard for high growth potential opportunities
  • Research Analyst Access for customization & queries
  • Competitor Analysis with Interactive dashboard
  • Latest News, Updates & Trend analysis
Request Sample

Scope of the Report

Report Metric

Details

Market size available for years

2016–2025

Base year considered

2019.

Forecast period

2020–2025.

Forecast units

Value (USD) and Volume (Units).

Segments covered

Product Type, Application Type, End Market Type, Advance Technology Type, Vehicle Type, and Region.

Geographies covered

North America, Asia Pacific, Europe, and RoW.

Companies covered

Bosch (Germany), Siemens (Germany), Honeywell (US), ABB (Switzerland), Delphi (UK), and Horiba (Japan)
A total of 31 major players covered.

This research report categorizes the automotive test equipment based on product type, application type, end market type, advance technology type, vehicle type, and region.

Based on vehicle type:

    • Passenger Car
    • Commercial Vehicle

Based on product type:

    • Chassis dynamometer
    • Engine dynamometer
    • Vehicle emission test system
    • Wheel alignment tester
    • Fuel injection pump tester
    • Transmission dynamometer

Based on application type:

    • Mobile device-based equipment
    • PC/laptop-based equipment

Based on end-market type:

    • OEM assembly plant
    • OEM R&D/ technical center
    • Authorized service center

Based on advance technology size:

    • ADAS testing
    • ECU testing
    • Data logger system
    • Simulation testing
    • EV testing

Based on the region:

  • Asia Pacific
      • China
      • India
      • Japan
      • South Korea
    • North America
      • US
      • Canada
      • Mexico
    • Europe
      • France
      • Germany
      • Italy
      • Spain
      • UK
    • Rest of the World
    • Brazil
    • Russia

    Recent developments

    • In March 2020, Actia established its vehicle inspection centers in the Philippines and Laos, with the test bench for heavy goods vehicles, light vehicles, and motorcycles. In the Philippines, the first 40 inspection centers were opened under the name QWIK. On the other hand, in Laos, Actia established two inspection lines for light and heavy goods vehicles.
    • In November 2019, Robert Bosch had technically enhanced the BEA 950 emission tester and Bosch FSA7 40 vehicle system analysis. The FSA 740 features the measurement option for the 48V system and ergonomic trolley. The BEA 950 device, which is used for emission analysis, is now fitted with a 24-inch large screen.
    • In November 2018, Bosch developed a diesel test bench, named, DCI 700. It allows accurate and reliable testing of all—Bosch and third-party manufacturers-common rail injectors for cars and commercial vehicles.
    • In June 2018, Siemens announced the latest release of Simcenter Testlab software, its suite of data collection, analytics, and modeling software for test-based performance engineering in the core fields of noise and vibration, acoustics, and durability. This software is likely to provide a testing platform for several automotive scanning tools.
    • In February 2017, Vector Informatik acquired US-based Vector Software, Inc. Vector Software specializes in automated embedded software testing in multiple industries such as automotive, aerospace, medical devices, industrial controls, rail, and other critical business sectors.
    • In May 2018, Horiba, a leading supplier of emission measurement and automotive test systems, launched its new SERVICE-ONE concept for the portable OBS-ONE emission measuring system that is designed for Real Driving Emission (RDE) testing of vehicles. With the broad range of service offers, Horiba significantly reduces costs and downtime while increasing flexibility for customers and the reliability of test systems.
      1. In June 2018, Horiba, a leading supplier of emission measurement and automotive test systems, and TNO, a center for applied scientific research from the Netherlands, agreed to start a collaboration on the industrialization of Smart Emission Measurement Systems (SEMS). By combining the strengths of both the organizations, new possibilities for measuring real-world driving emissions would become available through industrialization and large-scale deployment of SEMS.

    Frequently Asked Questions (FAQ):

    To speak to our analyst for a discussion on the above findings, click Speak to Analyst


TABLE OF CONTENTS
1 INTRODUCTION (Page No. - 33)
1.1 Objectives of the Study
1.2 Market Definition
1.3 Market Scope
1.3.1I nclusions & exclusions
Table 1Inclusions & exclusions for automotive test equipment market
1.3.2Markets covered
Figure market: Market segmentation
1.3.3 Years considered in the study
1.4 Currency
1.5 Package Size
1.6 Limitation
1.7 Stakeholders
1.8 Summary of Changes
Figure 2 MnM downgrades its forecast of automotive test equipment market
2 RESEARCH METHODOLOGY (Page No. - 38)
2.1 Research Data
Figure 3 Research methodology model
Figure 4 Research methodology model
2.2Secondary Data
2.3Primary Data
Figure 5Breakdown of primary interviews
2.3.1Sampling techniques & data collection methods
2.3.2Primary participants
2.4Market Size Estimation
2.4.1Bottom-up approach
Figure 6 Global market size: Bottom-up approach
2.4.2Top-down approach
Figure 7 Market size estimation methodology for the market: Top-down approach
Figure 8 market: Research design & methodology
2.4.3Assumptions
2.5Market Breakdown and Data Triangulation
Figure 9Data triangulation
2.6Assumptions
3EXECUTIVE SUMMARY (Page No. - 46)
Figure 10Automotive test equipment: Market outlook
Figure 11 market: Market dynamics
Figure 12Passenger car segment is projected to have the largest share in the market, by vehicle type (USD Million)
3.1Pre-COVID-19 and Post-COVID Impact on the Market
Table 2market, pre-COVID-19 and post-COVID-19 scenario, 2016-2025, (USD Million)
3.2COVID-19 Impact on the Market
4PREMIUM INSIGHTS (Page No. - 51)
4.1Attractive Opportunities in the Market
Figure 13Technological advancements and the growth of the automotive industry are expected to drive the automotive test equipment market
4.2market in Asia Pacific, by Product and by Country
Figure 14Wheel alignment tester segment and China is projected to be the largest in the automotive equipment market, by product type and in country level, by value
4.Market, by Country
Figure 15The Indian market is expected to witness the highest growth during the forecast period of 2020-2025 (by value)
4.Market, by Vehicle Type
Figure 16The passenger car segment is projected to account for the largest market share in 2025, by value
4.Market, by Application Type
Figure 17PC/Laptop based automotive test equipment is estimated to dominate the market, by value
4. Market, by End Market Type
Figure 18Authorized service center market is projected to dominate the market, by value
5MARKET OVERVIEW (Page No. - 56)
5.1Introduction
Table 3Impact of market dynamics
5.2Market Dynamics
Figure 19Automotive test equipment market dynamics
5.2.1Drivers
5.2.1.1Increasing electric vehicle production and autonomous vehicle testing
Figure 20Electric vehicle sales (2018 vs. 2019)
5.2.1.2Increasing electronic architecture in modern vehicles
5.2.1.3Rise in stringent emissions norms to prevent environmental impact
Figure 21Global passenger car emission legislation,
5.2.1.4Technological advancements in automotive test equipment
5.2.2Restraints
5.2.2.1High cost of advanced technology equipment
5.2.2.2Lack of trained workforce for advanced test equipment
5.2.2.3Lack of R&D facilities for automotive test equipment
5.2.3Opportunities
5.2.3.1Analyzing real-time vehicle data and simulation testing
5.2.3.2Increased demand for high-performance vehicles
5.2.3.3Growing demand for onboard diagnostic tools
5.2.4Challenges
5.2.4.1Maintaining a balance between high cost & performance of test equipment
5.3Regulatory Overview
5.3.1Vehicle testing regulation
5.3.2Engine testing regulation
5.3.3Regulations/activities undertaken to reduce greenhouse gas emissions from passenger cars and trucks
5.3.4Regulations for smog, soot, and other air pollution from passenger cars & trucks
5.3.5Regulations for greenhouse gas emissions from commercial trucks & buses
5.3.6Regulations for smog, soot, and other air pollution from commercial trucks & buses
6COVID-19 IMPACT (Page No. - 71)
6.1Introduction to COVID-19
6.2COVID-19 Health Assessment
Figure 22COVID-19: The global propagation
Figure 23COVID-19 propagation: Select countries
6.3COVID-19 Economic Assessment
Figure 24Revised GDP forecasts for select g20 countries in 2020
6.4COVID-19 Economic Impact-Scenario Assessment
Figure 25Criteria impacting the global economy
Figure 26Scenarios in terms of recovery of the global economy
6.4.1COVID-19 impact analysis on the global automotive industry
Table 4Impact of COVID-19 on the automotive industry
Table 5Impact of COVID-19 on the large automotive market
6.4.2Impact of COVID-19 ON the automotive test equipment market
6.4.2.1Scenario analysis
6.4.2.1.1Most likely scenario
Table market (most likely), by region, 2016-2025 (USD Million)
6.4.2.1.2Optimistic scenario
Table market (optimistic), by region, 2016-2025 (USD Million)
6.4.2.1.3Pessimistic scenario
Table market (pessimistic), by region, 2016-2025 (USD Million)
7INDUSTRY TRENDS (Page No. - 80)
7.1Overview
7.2Technological Overview
7.2.1ECU testing
7.2.2Simulation testing
7.2.3ADAS testing
7.2.4Battery testing
7.3Value Chain Analysis
Figure 27Value chain analysis (2020)
7.3.1Planning and revising funds
7.3.2Automotive testing equipment suppliers
7.3.3Automotive testing software and development
7.3.4OEM
7.4Porter-s five forces analysis
Figure 28High bargaining power of sellers owing to mandates pertaining to testing vehicle parts and their components during assembly
8 AUTOMOTIVE TEST EQUIPMENT MARKET, BY PRODUCT TYPE (Page No. - 85)
8.1Introduction
8.2Research Methodology
Figure 29market, by product type, 2020 vs 2025 (USD Million)
Table 9market, by product type, 2016-2019 (Units)
Table 10market, by product type, 2016-2019 (USD Million)
Table 11 market, by product type, 2020-2025 (Units)
Table 12market, by product type, 2020-2025 (USD Million)
8.3Engine Dynamometer
8.3.1North America is estimated to be second largest market
Table 13Engine dynamometer: market, by region, 2016-2019 (Units)
Table 14Engine dynamometer: market, by region, 2016-2019 (USD Million)
Table 15Engine dynamometer: market, by region, 2020-2025 (Units)
Table 16Engine dynamometer: market, by region, 2020-2025 (USD Million)
8.4Chassis Dynamometer
8.4.1Increasing regulations pertaining to vehicle testing will propel chassis dynamometer market
Table 17Chassis dynamometer: market, by region, 2016-2019 (Units)
Table 18Chassis dynamometer: market, by region, 2016-2019 (USD Million)
Table 19Chassis dynamometer: market, by region, 2020-2025 (Units)
Table 20Chassis dynamometer: market, by region, 2020-2025 (USD Million)
8.5Vehicle Emission Test System
8.5.1North America is projected to be fastest growing market
Table 21Vehicle emission test system: market, by region, 2016-2019 (Units)
Table 22Vehicle emission test system: market, by region, 2016-2019 (USD Million)
Table 23Vehicle emission test system: market, by region, 2020-2025 (Units)
Table 24Vehicle emission test system: market, by region, 2020-2025 (USD Million)
8.6wheel alignment tester
Table 25Wheel alignment tester: market, by region, 2016-2019 (Units)
Table 26Wheel alignment tester: market, by region, 2016-2019 (USD Million)
Table 27Wheel alignment tester: market, by region, 2020-2025 (Units)
Table 28Wheel alignment tester: market, by region, 2020-2025 (USD Million)
8.7Transmission Dynamometer
Table 29Transmission dynamometer: market, by region, 2016-2019 (Units)
Table 30Transmission dynamometer: market, by region, 2016-2019 (USD Million)
Table 31Transmission dynamometer: market, by region, 2020-2025 (Units)
Table 32transmission dynamometer: market, by region, 2020-2025 (USD Million)
8.8Fuel Injection Pump Tester
Table 33Fuel injection pump tester: market, by region, 2016-2019 (Units)
Table 34Fuel injection pump tester: market, by region, 2016-2019 (USD Million)
Table 35Fuel injection pump tester: market, by region, 2020-2025 (Units)
Table 36Fuel injection pump tester: market, by region, 2020-2025 (USD Million)
Table 37Reduction of pollution levels for light duty vehicles over the years in the US
Figure 30Key primary insights
9AUTOMOTIVE TEST EQUIPMENT MARKET, BY APPLICATION (Page No. - 101)
9.1Introduction
9.2Research Methodology
Figure 31 market, by application, 2020 vs 2025 (USD Million)
Table 38 market, by application, 2016-2019 (USD Million)
Table 39market, by application, 2020-2025 (USD Million)
9.3Mobile/tablet Based Equipment
9.3.1North America is estimated to lead the market in 2020
Table 40Mobile/tablet based equipment: market, by region, 2016-2019 (USD Million)
Table 41Mobile/tablet based equipment: market, by region, 2020-2025 (USD Million)
9.4PC/laptop Based Equipment
9.4.1Asia Pacific region is the largest and the fastest market for pc/laptop based application
Table 42PC/laptop based equipment: market, by region, 2016-2019 (USD Million)
Table 43PC/laptop based equipment: market, by region, 2020-2025 (USD Million)
9.5Key Primary Insights
Figure 32Key primary insights
10AUTOMOTIVE TEST EQUIPMENT MARKET, BY END MARKET (Page No. - 107)
10.1Introduction
10.2Research Methodology
Figure 33 market, by end market, 2020 vs 2025 (USD Million)
Table 44 market, by end market, 2016-2019 (Units)
Table 45 market, by end market, 2016-2019 (USD Million)
Table 46 market, by end market, 2020-2025 (Units)
Table 47 market, by end market, 2020-2025 (USD Million)
10.3Authorized Service Centers
10.3.1Growing vehicle parc in Asia Pacific will drive market of authorized service center
Table 48Authorized service centers: market, by region, 2016-2019 (Units)
Table 49Authorized service centers: market, by region, 2016-2019 (USD Million)
Table 50Authorized service centers: market, by region, 2020-2025 (Units)
Table 51Authorized service centers: market, by region, 2020-2025 (USD Million)
10.4OEM Assembly Plant
10.4.1Growing production in China and India will boost OEM assembly plant-s market
Table 52OEM assembly plant: market, by region, 2016-2019 (Units)
Table 53OEM assembly plant: market, by region, 2016-2019 (USD Million)
Table 54OEM assembly plant: market, by region, 2020-2025 (Units)
Table 55OEM assembly plant: market, by region, 2020-2025 (USD Million)
10.5OEM R&D/Technical Center
10.5.1Growing emphasis on technological development of test equipment will propel market for OEM R&D/technical center
Table 56OEM R&D technical center: market, by region, 2016-2019 (Units)
Table 57OEM R&D technical center: market, by region, 2016-2019 (USD Million)
Table 58OEM R&D technical center: market, by region, 2020-2025 (Units)
Table 59OEM R&D technical center: market, by region, 2020-2025 (USD Million)
10.6Key Primary Insights
Figure 34Key primary insights
11AUTOMOTIVE TEST EQUIPMENT MARKET, BY VEHICLE TYPE (Page No. - 118)
11.1Introduction
11.2Research Methodology
Figure 35 market, by vehicle type, 2018 vs 2025 (USD Million)
Table 60 market, by vehicle type, 2016-2019 (Units)
Table 61 market, by vehicle type, 2016-2019 (USD Million)
Table 62 market, by vehicle type, 2020-2025 (Units)
Table 63 market, by vehicle type, 2020-2025 (USD Million)
11.3Passenger Car
11.3.1Increasing passenger car production in countries in Asia Pacific region will drive the market
Table 64Passenger car: market, by region, 2016-2019 (Units)
Table 65Passenger car: market, by region, 2016-2019 (USD Million)
Table 66Passenger car: market, by region, 2020-2025 (Units)
Table 67Passenger car: market, by region, 2020-2025 (USD Million)
11.4Commercial Vehicle
11.4.1Light commercial vehicle
11.4.2Heavy commercial vehicle
Table 68Commercial vehicle: market, by region, 2016-2019 (Units)
Table 69Commercial vehicle: market, by region, 2016-2019 (USD Million)
Table 70Commercial vehicle: market, by region, 2020-2025 (Units)
Table 71Commercial vehicle: market, by region, 2020-2025 (USD Million)
11.5Key Primary Insights
Figure 36Key primary insights
12AUTOMOTIVE TEST EQUIPMENT MARKET, BY ADVANCE TECHNOLOGY (Page No. - 126)
12.1Introduction
12.2ADAS Testing
12.3ECU testing
12.4DAta Logger
12.5Simulation Testing
12.5.1Crash impact simulation
12.5.2Autonomous driving simulator
12.6EV Testing
12.6.1Inverter analyzer and repair equipment
12.6.2Battery analyzer and repair equipment
Table 72Some of the key standards for testing battery electric vehicles
12.6.3Battery thermal management system
12.6.4Motor analyzer and repair equipment
Table 73Standards for electric vehicle motor testing
13AUTOMOTIVE TEST EQUIPMENT MARKET, BY REGION (Page No. - 132)
13.1Introduction
Figure 37Asia Pacific is estimated to hold the largest market share in market in 2020
Figure 38 market, by region, 2020 vs 2025 (USD Million)
Table 74 market, by region, 2016-2019 (Units)
Table 75 market, by region, 2020-2025 (Units)
Table 76 market, by region, 2016-2019 (USD Million)
Table 77 market, by region, 2020-2025 (USD Million)
13.2asia pacific
Figure 39Asia Pacific: market snapshot
Table 78Asia Pacific: market, by country, 2016-2019 (Units)
Table 79Asia Pacific: market, by country, 2020-2025 (Units)
Table 80Asia Pacific: market, by country, 2016-2019 (USD Million)
Table 81Asia Pacific: market, by country, 2020-2025 (USD Million)
Table 82Asia Pacific: market, by vehicle type, 2016-2019 (Units)
Table 83Asia Pacific: market, by vehicle type, 2020-2025 (Units)
Table 84Asia Pacific: market, by vehicle type, 2016-2019 (USD Million)
Table 85Asia Pacific: market, by vehicle type, 2020-2025 (USD Million)
Table 86Asia Pacific: market, by product type, 2016-2019 (Units)
Table 87Asia Pacific: market, by product type, 2020-2025 (Units)
Table 88Asia Pacific: market, by product type, 2016-2019 (USD Million)
Table 89Asia Pacific: market, by product type, 2020-2025 (USD Million)
Table 90Asia Pacific: market, by market channel type, 2016-2019 (Units)
Table 91Asia Pacific: market, by market channel type, 2020-2025 (Units)
Table 92Asia Pacific: market, by market channel type, 2016-2019 (USD Million)
Table 93Asia Pacific: market, by market channel type, 2020-2025 (USD Million)
13.2.1Impact of COVID-19 on the Asia Pacific market
13.2.2China
13.2.2.1High automotive production in China is driving the market
Table 94China: market, by vehicle type, 2016-2019 (Units)
Table 95China: market, by vehicle type, 2020-2025 (Units)
Table 96China: market, by vehicle type, 2016-2019 (USD Million)
Table 97China: market, by vehicle type, 2020-2025 (USD Million)
13.2.3India
13.2.3.1Rise in foreign investments due to enhanced FDI polices expected to foster the Indian automotive market in the coming years
Table 98India: market, by vehicle type, 2016-2019 (Units)
Table 99India: market, by vehicle type, 2020-2025 (Units)
Table 100India: market, by vehicle type, 2016-2019 (USD Million)
Table 101India: market, by vehicle type, 2020-2025 (USD Million)
13.2.4Japan
13.2.4.1Increasing adoption of electric vehicles in Japan expected to hamper vehicle emission system and engine dynamometer market in Japan
Table 102Japan: market, by vehicle type, 2016-2019 (Units)
Table 103Japan: market, by vehicle type, 2020-2025 (Units)
Table 104Japan: market, by vehicle type, 2016-2019 (USD Million)
Table 105Japan: market, by vehicle type, 2020-2025 (USD Million)
13.2.5South Korea
13.2.5.1Wheel alignment tester is projected to lead South Korean market
Table 106South Korea: market, by vehicle type, 2016-2019 (Units)
Table 107South Korea: market, by vehicle type, 2020-2025 (Units)
Table 108South Korea: market, by vehicle type, 2016-2019 (USD Million)
Table 109South Korea: market, by vehicle type, 2020-2025 (USD Million)
13.3europe
Figure 40Europe: market snapshot
Table 110Europe: market, by country, 2016-2019 (Units)
Table 111Europe: market, by country, 2020-2025 (Units)
Table 112Europe: market, by country, 2016-2019 (USD Million)
Table 113Europe: market, by country, 2020-2025 (USD Million)
Table 114Europe: market, by vehicle type, 2016-2019 (Units)
Table 115Europe: market, by vehicle type, 2020-2025 (Units)
Table 116Europe: market, by vehicle type, 2016-2019 (USD Million)
Table 117Europe: market, by vehicle type, 2020-2025 (USD Million)
Table 118Europe: market, by product type, 2016-2019 (Units)
Table 119Europe: market, by product type, 2020-2025 (Units)
Table 120Europe: market, by product type, 2016-2019 (USD Million)
Table 121Europe: market, by product type, 2020-2025 (USD Million)
Table 122Europe: market, by market channel type, 2016-2019 (Units)
Table 123Europe: market, by market channel type, 2020-2025 (Units)
Table 124Europe: market, by market channel type, 2016-2019 (USD Million)
Table 125Europe: market, by market channel type, 2020-2025 (USD Million)
13.3.1Impact of COVID-19 on the Europe automotive test equipment market
13.3.2Impact of COVID-19 on the Europe passenger car market
13.3.3Impact of COVID-19 on the Europe commercial vehicle market
13.3.4France
13.3.4.1Vehicle emission test system is projected to grow at the highest rate
Table 126France: market, by vehicle type, 2016-2019 (Units)
Table 127France: market, by vehicle type, 2020-2025 (Units)
Table 128France: market, by vehicle type, 2016-2019 (USD Million)
Table 129France: market, by vehicle type, 2020-2025 (USD Million)
13.3.5Germany
13.3.5.1Increasing R&D activities in Germany expected to drive the automotive test equipment market
Table 130Germany: market, by vehicle type, 2016-2019 (Units)
Table 131Germany: market, by vehicle type, 2020-2025 (Units)
Table 132Germany: market, by vehicle type, 2016-2019 (USD Million)
Table 133Germany: market, by vehicle type, 2020-2025 (USD Million)
13.3.6Italy
13.3.6.1Passenger car segment estimated to lead the market
Table 134Italy: market, by vehicle type, 2016-2019 (Units)
Table 135Italy: market, by vehicle type, 2020-2025 (Units)
Table 136Italy: market, by vehicle type, 2016-2019 (USD Million)
Table 137Italy: market, by vehicle type, 2020-2025 (USD Million)
13.3.7Spain
13.3.7.1Increasing vehicle exports expected to boost market
Table 138Spain: market, by vehicle type, 2016-2019 (Units)
Table 139Spain: market, by vehicle type, 2020-2025 (Units)
Table 140Spain: market, by vehicle type, 2016-2019 (USD Million)
Table 141Spain: market, by vehicle type, 2020-2025 (USD Million)
13.3.8UK
13.3.8.1Demand for premium cars expected to propel the market in the UK
Table 142UK: market, by vehicle type, 2016-2019 (Units)
Table 143UK: market, by vehicle type, 2020-2025 (Units)
Table 144UK: market, by vehicle type, 2016-2019 (USD Million)
Table 145UK: market, by vehicle type, 2020-2025 (USD Million)
13.4North America
Figure 41North America: market snapshot
Table 146North America: market, by country, 2016-2019 (Units)
Table 147North America: market, by country, 2020-2025 (Units)
Table 148North America: market, by country, 2016-2019 (USD Million)
Table 149North America: market, by country, 2020-2025 (USD Million)
Table 150North America: market, by vehicle type, 2016-2019 (Units)
Table 151North America: market, by vehicle type, 2020-2025 (Units)
Table 152North America: market, by vehicle type, 2016-2019 (USD Million)
Table 153North America: market, by vehicle type, 2020-2025 (USD Million)
Table 154North America: market, by product type, 2016-2019 (Units)
Table 155North America: market, by product type, 2020-2025 (Units)
Table 156North America: market, by product type, 2016-2019 (USD Million)
Table 157North America: market, by product type, 2020-2025 (USD Million)
Table 158North America: market, by market channel type, 2016-2019 (Units)
Table 159North America: market, by market channel type, 2020-2025 (Units)
Table 160North America: market, by market channel type, 2016-2019 (USD Million)
Table 161North America: market, by market channel type, 2020-2025 (USD Million)
13.4.1Impact of COVID-19 on the North America Market
13.4.2Canada
13.4.2.1Growing light commercial vehicle production in Canada expected to fuel the market for commercial vehicles
Table 162Canada: market, by vehicle type, 2016-2019 (Units)
Table 163Canada: market, by vehicle type, 2020-2025 (Units)
Table 164Canada: market, by vehicle type, 2016-2019 (USD Million)
Table 165Canada: market, by vehicle type, 2020-2025 (USD Million)
13.4.3Mexico
13.4.3.1Low labor cost is the key driver for the increasing number of automotive plants in the country
Table 166Mexico: market, by vehicle type, 2016-2019 (Units)
Table 167Mexico: market, by vehicle type, 2020-2025 (Units)
Table 168Mexico: market, by vehicle type, 2016-2019 (USD Million)
Table 169Mexico: market, by vehicle type, 2020-2025 (USD Million)
13.4.4US
13.4.4.1Stringent emission norms expected to drive the market in the short term
Table 170US: market, by vehicle type, 2016-2019 (Units)
Table 171US: market, by vehicle type, 2020-2025 (Units)
Table 172US: market, by vehicle type, 2016-2019 (USD Million)
Table 173US: market, by vehicle type, 2020-2025 (USD Million)
13.5RoW
Figure 42RoW: market, by country, 2018 vs 2025 (USD Million)
Table 174Row: market, by country, 2016-2019 (Units)
Table 175RoW: market, by country, 2020-2025 (Units)
Table 176RoW: market, by country, 2016-2019 (USD Million)
Table 177RoW: market, by country, 2020-2025 (USD Million)
Table 178RoW: market, by vehicle type, 2016-2019 (Units)
Table 179RoW: market, by vehicle type, 2020-2025 (Units)
Table 180RoW: market, by vehicle type, 2016-2019 (USD Million)
Table 181RoW: market, by vehicle type, 2020-2025 (USD Million)
Table 182RoW: market, by product type, 2016-2019 (Units)
Table 183RoW: market, by product type, 2020-2025 (Units)
Table 184RoW: market, by product type, 2016-2019 (USD Million)
Table 185RoW: market, by product type, 2020-2025 (USD Million)
Table 186RoW: market, by market channel type, 2016-2019 (Units)
Table 187RoW: market, by market channel type, 2020-2025 (Units)
Table 188RoW: market, by market channel type, 2016-2019 (USD Million)
Table 189RoW: market, by market channel type, 2020-2025 (USD Million)
13.5.1Brazil
13.5.1.1The passenger car segment estimated to lead the Brazilian market
Table 190Brazil: market, by vehicle type, 2016-2019 (Units)
Table 191Brazil: market, by vehicle type, 2020-2025 (Units)
Table 192Brazil: market, by vehicle type, 2016-2019 (USD Million)
Table 193Brazil: market, by vehicle type, 2020-2025 (USD Million)
13.5.2Russia
13.5.2.1Passenger car segment is projected to grow at the highest rate
Table 194Russia: market, by vehicle type, 2016-2019 (Units)
Table 195Russia: market, by vehicle type, 2020-2025 (Units)
Table 196Russia: market, by vehicle type, 2016-2019 (USD Million)
Table 197Russia: market, by vehicle type, 2020-2025 (USD Million)
14COMPETITIVE LANDSCAPE (Page No. - 183)
14.1Market Evaluation Framework
Figure 43Market evaluation framework
14.2Overview
14.3Market Ranking Analysis
Figure 44Key developments by leading players in the market, 2017-2020
14.4Market Evaluation Framework Revenue Analysis of top 5 player
Figure 45Top 5 players have dominated the market in last 3 years
14.5Competitive Leadership Mapping
14.5.1Stars
14.5.2Emerging Leaders
14.5.3Pervasive
14.5.4Emerging Companies
Figure 46 market (global): Competitive leadership mapping, 2020
14.6Winners vs. Losers
14.7Competitive Scenario
14.7.1New product developments
Table 198New product developments, 2017-2020
14.7.2Expansions
Table 199Expansions, 2017-2020
14.7.3Partnerships/supply contracts/collaborations/joint ventures/agreements
Table 200Partnerships/supply contracts/collaborations/joint ventures/agreements, 2017-2020
14.7.4Mergers & Acquisitions
Table 201Mergers & acquisitions, 2017-2020
15COMPANY PROFILES (Page No. - 197)
15.1Key Players
(Business overview, Products offered, Recent Developments, SWOT analysis, MNM view)*
15.1.1ROBERT BOSCH GMBH
Figure 47ROBERT BOSCH GMBH: Company snapshot
Table 202ROBERT BOSCH GMBH: Products offered
Table 203ROBERT BOSCH GMBH: New Product Developments
Figure 48ROBERT BOSCH GMBH: SWOT analysis
15.1.2SIEMENS
Figure 49SIEMENS: Company snapshot
Table 204SIEMENS: Products offered
Table 205New product developments/expansions
Figure 50SIEMENS: SWOT analysis
15.1.3DELPHI TECHNOLOGIES
Figure 51DELPHI TECHNOLOGIES: Company snapshot
Figure 52DELPHI: SWOT analysis
15.1.4CONTINENTAL AG
Figure 53CONTINENTAL AG: Company snapshot
Figure 54CONTINENTA AGL: SWOT analysis
15.1.5VECTOR INFORMATIK GMBH
Figure 55VECTOR INFORMATIK: SWOT analysis
15.1.6HONEYWELL INTERNATIONAL INC
Figure 56HONEYWELL INTERNATIONAL INC: Company snapshot
15.1.7ABB
Figure 57ABB: Company snapshot
15.1.8SOFTING AG
Figure 58SOFTING AG: Company snapshot
15.1.9HORIBA, LTD.
Figure 59HORIBA, LTD.: Company snapshot
15.1.10SGS SA
Figure 60SGS: Company snapshot
15.1.11ACTIA GROUP
Figure 61ACTIA GROUP: Company snapshot
*Details on Business overview, Products offered, Recent Developments, SWOT analysis, MNM view might not be captured in case of unlisted companies.
15.2Other Regional Key players
15.2.1Asia Pacific
15.2.1.1Autel
15.2.1.2Ampro Testing Machines
15.2.1.3NSM Solutions
15.2.1.4Sinfonia
15.2.1.5Denso
15.2.2Europe
15.2.2.1DSA Daten- und Systemtechnik
15.2.2.2Ipetronik
15.2.2.3Racelogic
15.2.2.4MAHA Maschinenbau Haldenwang
15.2.2.5Rohde-Schwarz
15.2.2.6TUV SUD
15.2.2.7EM TEST
15.2.2.8AVL
15.2.3North America
15.2.3.1Fluke
15.2.3.2Moog
15.2.3.3Sierra Instruments
15.2.3.4PTM Electronics
15.2.3.5MTS
15.2.3.6Intertek
16ADJACENT & RELATED MARKETS (Page No. - 238)
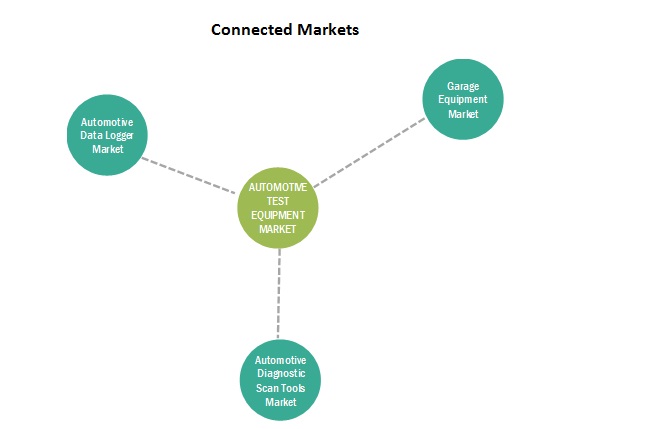
Figure 62Automotive test equipment ecosystem and interconnected market
16.1Automotive Diagnostic Scan Tools Market
Figure 63Asia Pacific is projected to be the fastest-growing market for automotive diagnostic scan tools, 2020-2025
Table 206Automotive diagnostic scan tools market, by region, 2018-2025 (USD Million)
16.2Garage Equipment Market
Figure 64Garage equipment market, by region, 2019 VS. 2027 (USD Million)
Table 207Garage equipment market, by region, 2017-2027 (000- Units)
Table 208Garage equipment market, by region, 2017-2027 (USD Million)
16.3Automotive Data Logger Market
Figure 65Automotive data logger market, by region, 2018 VS. 2025
Table 209Automotive data logger market size, by region, 2016-2025 (000- UNITS)
Table 210Automotive data logger market size, by region, 2016-2025 (USD Million)
17APPENDIX (Page No. - 245)
17.1Currency Exchange Rates (W.R.T. USD)
17.2Key Insights of Industry Experts
17.3Discussion Guide
17.4Knowledgestore: MarketsandMarkets Subscription Portal
17.5Available Customizations
17.6Related Reports
17.7Author Details


The study involved four major activities in estimating the current market size of the automotive test equipment. Exhaustive secondary research was done to collect information on the market, the peer market, and the parent market. The next step was to validate these findings, assumptions, and sizing with the industry experts across value chains through primary research. Both top-down and bottom-up approaches were employed to estimate the complete market size. After that, market breakdown and data triangulation were used to estimate the market size of the segments and subsegments.

Secondary Research

In the secondary research process, various secondary sources such as company annual reports/presentations, press releases, industry association publications [for example, automobile OEMs, Canadian Automobile Association (CAA), country-level automotive associations and trade organizations, and the Department of Transportation (DOT)], automotive magazine articles, directories, technical handbooks, World Economic Outlook, trade websites, technical articles, and databases (for example, Marklines and Factiva) have been used to identify and collect information useful for an extensive commercial study of the global automotive test equipment market.

Primary Research

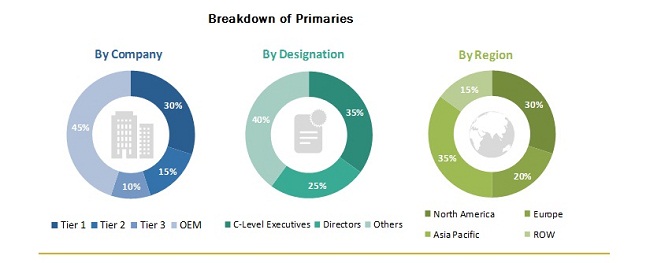
Extensive primary research has been conducted after acquiring an understanding of the automotive test equipment market scenario through secondary research. Several primary interviews have been conducted with market experts from the demand- and supply-side OEMs (in terms of component supply, country-level government associations, and trade associations) and component manufacturers across four major regions, namely, North America, Europe, Asia Pacific, and Rest of the World. Approximately 40% and 60% of primary interviews have been conducted from the demand- and supply-side, respectively. Primary data has been collected through questionnaires, emails, and telephonic interviews. In the canvassing of primaries, we have strived to cover various departments within organizations, such as sales, operations, and administration, to provide a holistic viewpoint in our report.

After interacting with industry experts, we have also conducted brief sessions with highly experienced independent consultants to reinforce the findings from our primaries. This, along with the in-house subject matter expert’s opinions, has led us to the findings as described in the remainder of this report. Following is the breakdown of primary respondents-
 

Automotive Test Equipment Market Size

To know about the assumptions considered for the study, download the pdf brochure

Market Size Estimation

Both top-down and bottom-up approaches were used to estimate and validate the total size of the automotive test equipment market. These methods were also used extensively to estimate the size of various subsegments in the market. The research methodology used to estimate the market size includes the following:

  • The key players in the industry and markets have been identified through extensive secondary research.
  • The industry’s supply chain and market size, in terms of value, have been determined through primary and secondary research processes.
  • All percentage shares, splits, and breakdowns have been determined using secondary sources and verified through primary sources.

Global Automotive test equipment market: Bottom-up Approach
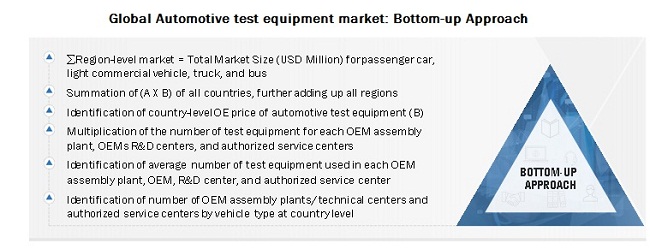
Automotive test equipment market Bottom-up Approach


Global Automotive test equipment market: Top-down Approach
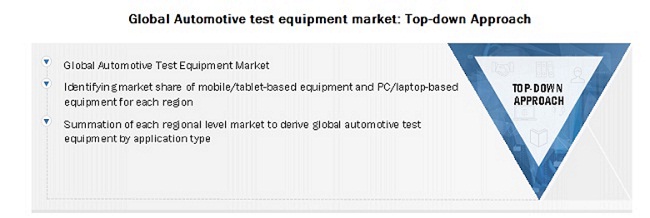
Automotive Test Equipment Market Top-down Approach

To know about the assumptions considered for the study, Request for Free Sample Report

Data Triangulation

After arriving at the overall market size—using the market size estimation processes as explained above—the market was split into several segments and subsegments. To complete the overall market engineering process and arrive at the exact statistics of each market segment and subsegment, the data triangulation, and market breakdown procedures were employed, wherever applicable. The data was triangulated by studying various factors and trends from both the demand- and supply-sides.

Report Objectives

  • To analyze and forecast (2020 to 2025) the size of the automotive test equipment market, in terms of volume (units) and value (USD million), to segment the market and forecast its size, by volume and value, and based on region (Asia Pacific, Europe, North America, and the Rest of the World (RoW))
  • To provide a detailed analysis of various factors influencing the global market (drivers, restraints, opportunities, and challenges)
  • To analyze the regional markets for growth trends, prospects, and their contribution to the overall market
  • To segment the market and forecast its size, by volume and value, based on vehicle type (passenger cars and commercial vehicles)
  • To segment the market and forecast the market size, by volume and value, based on the product (chassis dynamometer, engine dynamometer, vehicle emission test system, wheel alignment tester, transmission dynamometer, and fuel injection pump tester)
  • To segment the market and forecast the market size, by volume and value, based on the application type (mobile device based equipment, and PC/laptop-based equipment)
  • To segment the market and forecast its size, by volume and value, based on end market type (OEM assembly plant, OEM R&D/ technical center, and authorized service center)
  • To track and analyze competitive developments such as joint ventures, mergers & acquisitions, new product launches, expansions, and other activities carried out by key industry participants
  • To segment and forecast the global market size, in terms of volume (units) and value (USD Million)

Available Customizations

With the given market data, MarketsandMarkets offers customizations in accordance to the company’s specific needs.

Company Information

  • Profiling of Additional Market Players (Up to 3)
Custom Market Research Services

We will customize the research for you, in case the report listed above does not meet with your exact requirements. Our custom research will comprehensively cover the business information you require to help you arrive at strategic and profitable business decisions.

Request Customization
Report Code
AT 2774
Published ON
Jul, 2020
Choose License Type
BUY NOW
  • SHARE
X
Request Customization
Speak to Analyst
Speak to Analyst
OR FACE-TO-FACE MEETING
PERSONALIZE THIS RESEARCH
  • Triangulate with your Own Data
  • Get Data as per your Format and Definition
  • Gain a Deeper Dive on a Specific Application, Geography, Customer or Competitor
  • Any level of Personalization
REQUEST A FREE CUSTOMIZATION
LET US HELP YOU!
  • What are the Known and Unknown Adjacencies Impacting the Automotive Test Equipment Market
  • What will your New Revenue Sources be?
  • Who will be your Top Customer; what will make them switch?
  • Defend your Market Share or Win Competitors
  • Get a Scorecard for Target Partners
CUSTOMIZED WORKSHOP REQUEST
+1-888-600-6441
  • Call Us
  • +1-888-600-6441 (Corporate office hours)
  • +1-888-600-6441 (US/Can toll free)
  • +44-800-368-9399 (UK office hours)
CONNECT WITH US
ABOUT TRUST ONLINE
©2024 MarketsandMarkets Research Private Ltd. All rights reserved
DMCA.com Protection Status Website Feedback