Autonomous Agents Market by Deployment Type (Cloud and On-premises), Organization Size (SMEs and Large Enterprises), Vertical (BFSI, IT and Telecom, Manufacturing, Healthcare, Transportation and Mobility), and Region - Global Forecast to 2024


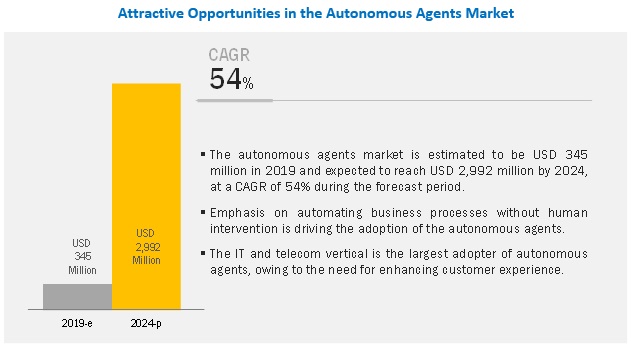
[95 Pages Report] The global Autonomous Agents Market size was valued at $345 million in 2019 and is projected to reach $2,992 million by 2024, at a CAGR of 54% during the forecast period. Increased automation and agility, need for delivering enhanced customer experience, and increased cost savings and return on investment are some of the major growth factors for the autonomous agents industry.
By deployment type, the on-premises segment is expected to be a larger contributor to the autonomous agents market growth during the forecast period
On-premises deployment of autonomous agents solutions requires initial high investment by organizations, though it does not require incremental costs throughout the ownership, as in the case of cloud deployment type. Moreover, security concern associated with private data of customers is a major reason for the adoption of on-premises deployment over the cloud. These types of deployments are popular across large-sized enterprises.
IT and telecom vertical accounts for the largest size in Autonomous Agents Market during the forecast period
The IT and telecom industry is characterized with increased complexity of communication networks to support advanced technologies, such as software defined - wide area network, and network function virtualization. The vertical has an increased demand for intelligent and optimized network operations to cater to the demand of communication service providers. The vertical is integrating autonomous agents, Artificial Intelligence (AI) and machine learning to automate their network operations and enhance the consumer experience. Autonomous agents are able to optimize the network operations and enable autonomous network operations. However, though the majority of AI in these applications are restricted to statistical analysis and big data tools, autonomous agents are expected to have high demand over the forecast period.
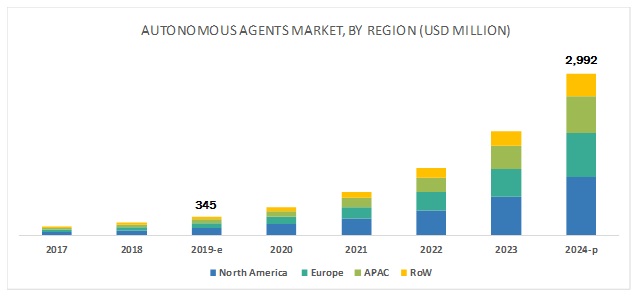
Asia Pacific to grow at the highest CAGR during the forecast period
The companies operating in the APAC region would benefit from the flexible economic conditions, industrialization and globalization policies of the governments, and the expanding digitalization, which is expected to have a huge impact on the business community in the region. The other emerging economies, such as India, Singapore, and Malaysia are looking forward to integrating new technologies into their businesses. These developments show that the APAC region is well-versed in adopting autonomous agents across various verticals, with a major focus on BFSI, and IT and telecom verticals. The companies in this region practicing strategy of increasing its customer base through acquisitions and partnerships with the significant players in the autonomous agents market.
Key Market Players
Major vendors in the autonomous agents market include Oracle (US), IBM (US), SAP (Germany), AWS (US), SAS (US), Infosys (India), Nuance Communications (US), FICO (US), Fetch.AI (UK), Affectiva (US), Intel (US), Salesforce (US), Aptiv (Ireland), Google (US) and Microsoft (US).
SAS is one of the key players in the autonomous agents market. The company concentrates on innovating the core focus areas, such as advanced analytics, visualization, customer intelligence, data management, risk management, and fraud and security intelligence. For instance, in March 2017, SAS upgraded its Visual Analytics solution that would run on a new architecture, SAS Viya. The company has been taking various initiatives to enhance its AI offerings to achieve a competitive advantage. For instance, SAS, in October 2017, made enhancements to its SAS Viya platform, where it embedded AI capabilities to meet the changing demand for AI-powered solutions and services of the industry. This platform is designed to help data scientists, analysts, and developers achieve insights from a large volume of data. Hence, by making enhancements to its SAS Viya platform, SAS Institute focuses on delivering AI capabilities, such as image recognition, Natural Language Understanding (NLU), and deep learning.
Get online access to the report on the World's First Market Intelligence Cloud
- Easy to Download Historical Data & Forecast Numbers
- Company Analysis Dashboard for high growth potential opportunities
- Research Analyst Access for customization & queries
- Competitor Analysis with Interactive dashboard
- Latest News, Updates & Trend analysis
Request Sample Scope of the Report
Get online access to the report on the World's First Market Intelligence Cloud
- Easy to Download Historical Data & Forecast Numbers
- Company Analysis Dashboard for high growth potential opportunities
- Research Analyst Access for customization & queries
- Competitor Analysis with Interactive dashboard
- Latest News, Updates & Trend analysis

|
Report Metric |
Details |
|
Market size available for years |
2017–2024 |
|
Base year considered |
2018 |
|
Forecast period |
2019–2024 |
|
Autonomous Agents Market Size in 2024 |
USD 2992 million |
|
CAGR |
54% |
|
Segments covered |
Deployment Type, Organization Size, Vertical, and Region |
|
Geographies covered |
North America, Europe, Asia Pacific (APAC), and Rest of the World (RoW) |
|
Companies covered |
Oracle (US), IBM (US), SAP (Germany), AWS (US), SAS (US), Infosys (India), Nuance Communications (US), FICO (US), Fetch.AI (UK), Affectiva (US), Intel (US), Salesforce (US), Aptiv (Ireland), Google (US) and Microsoft (US) |
The research report categorizes the autonomous agents market to forecast the revenues and analyze the trends in each of the following subsegments:
By Deployment Type
- Cloud
- On-premises
By Organization Size
- Large Enterprises
- Small and Medium-sized Enterprises (SMEs)
By Vertical
- BFSI
- IT and Telecom
- Manufacturing
- Healthcare
- Transportation and Mobility
- Others (Retail, and Energy and Utilities)
By Region
- North America
- Europe
- APAC
- RoW
Recent Developments
- In March 2019, Oracle has expanded AI capabilities within its Enterprise Resource Planning (ERP) cloud and Enterprise Performance Management (EPM) cloud to minimize manual processes and enhance efficiency, accuracy, and compliance. The extended AI capabilities include expense reporting assistant, project management digital assistant, advanced financial controls, and project-driven supply chain management.
- In January 2019, Infosys launched AssistEdge Discover to simplify the automation journey at the enterprise level and enables enterprises to manage processes across multiple systems seamlessly.
Frequently Asked Questions (FAQ):
What does Autonomous Agents mean?
Autonomous agents are defined as software programs that act independent of direct instruction from the end user and respond to event in an environment. They are advanced versions of enterprises Artificial Intelligence (AI) and act of behalf of and in the interest of their end users. Autonomous agents are applied in area that require continuous data analysis monitoring and reactions to events.
What are the top trends in Autonomous Agents market?
- Increasing number of AI applications
- Increased in availability of parallel computational resources
- Growth of large and complex data sets driving the need for autonomous agents
Who are the major vendors in the Autonomous Agents market?
Oracle, IBM, SAP, AWS, SAS, Infosys, Nuance Communications, FICO, Fetch.AI, Affectiva, Intel, Salesforce, Aptiv, Google and Microsoft
How big is the Autonomous Agents Market?
The autonomous agents market size was estimated at USD 345 million in 2019 and poised to reach USD 2,992 million by 2024, at a Compound Annual Growth Rate (CAGR) of 54% during the forecast period. Increased automation and agility, need for delivering enhanced customer experience, and increased cost savings and return on investment are some of the major growth factors for the autonomous agents industry.
What are the major Autonomous Agents Market verticals?
BFSI, IT and Telecom, Manufacturing, Healthcare, Transportation and Mobility, Others (Retail, and Energy .
To speak to our analyst for a discussion on the above findings, click Speak to Analyst
Table of Contents
1 Introduction (Page No. - 13)
1.1 Objectives of the Study
1.2 Market Definition
1.3 Market Scope
1.3.1 Market Segmentation
1.4 Years Considered for the autonomous agents market Study
1.5 Currency Considered
1.6 Stakeholders
2 Research Methodology (Page No. - 16)
2.1 Research Data
2.1.1 Secondary Data
2.1.2 Primary Data
2.1.2.1 Breakup of Primary Profiles
2.1.2.2 Key Industry Insights
2.2 Market Breakup and Data Triangulation
2.3 Autonomous Agents Market Size Estimation
2.3.1 Top-Down Approach
2.3.2 Bottom-Up Approach
2.4 Assumptions for the Study
2.5 Limitations of the Study
3 Executive Summary (Page No. - 22)
4 Premium Insights (Page No. - 25)
4.1 Attractive Growth Opportunities in the market
4.2 Market, By Organization Size, 2019
4.3 Market, By Vertical, 2019
4.4 Market: Market Investment Scenario, 2019–2024
5 Market Overview and Industry Trends (Page No. - 27)
5.1 Introduction
5.2 Autonomous Agents Market Dynamics
5.2.1 Drivers
5.2.1.1 Increasing Number of AI Applications
5.2.1.2 Increased Availability of Parallel Computational Resources
5.2.1.3 Growth of Large and Complex Data Sets Driving the Need for Autonomous Agents
5.2.2 Restraints
5.2.2.1 Issues Related to Unsupervised Learning
5.2.2.2 Need for Heavy Investment in Converting Unstructured Data Into Structured Data
5.2.2.3 Lack of Skilled Workforce and Absence of Standards and Protocols
5.2.3 Opportunities
5.2.3.1 Integration of AI With Cloud
5.2.3.2 Advancements in AI and Ml
5.2.4 Challenges
5.2.4.1 Limited Use Cases of Autonomous Agents
5.2.4.2 Increased Network Complexity
5.2.4.3 Data Privacy and Security Concerns
5.3 Types of Autonomous Agents
5.3.1 Traditional Industrial Robots
5.3.2 Mobile Robots
5.3.3 Softbots
5.3.4 Computer Simulations
5.4 Evolution
5.5 Industry Standards
5.5.1 Distributed Management Task Force Standards
5.5.2 Cloud Infrastructure Management Interface
5.5.3 Health Insurance Portability and Accountability Act
5.5.4 Organization for the Advancement of Structured Information Standards
5.5.5 International Organization for Standardization
5.5.6 Storage Networking Industry Association—Cloud Data Management Interface
6 Autonomous Agents Market, By Deployment Type (Page No. - 34)
6.1 Introduction
6.2 Cloud
6.2.1 Ability to Access Real-Time Data From Anywhere, Flexibility, and Cost-Effectiveness are the Major Factors to Drive the Adoption Rate of Cloud-Based Autonomous Agents
6.3 On-Premises
6.3.1 Growing Demand for Data Security Among Enterprises to Drive the Adoption of On-Premises Autonomous Agents
7 Market By Organization Size (Page No. - 38)
7.1 Introduction
7.2 Small and Medium-Sized Enterprises
7.2.1 Elimination of Human Intervention to Operate Tedious Tasks to Drive the Demand for Autonomous Agents in Small and Medium-Sized Enterprises
7.3 Large Enterprises
7.3.1 Growing Demand to Automate Business Processes and Enhance the Customer Experience to Boost the Adoption of Autonomous Agents in Large Enterprises
8 Autonomous Agents Market, By Vertical (Page No. - 42)
8.1 Introduction
8.2 Banking, Financial Services, and Insurance
8.2.1 Demand for Algorithmic Trading Systems in BFSI Vertical to Drive the Market Growth
8.3 IT and Telecom
8.3.1 IT and Telecom Vertical to Integrate Autonomous Agents, Ai, and Ml to Automate Network Operations and Enhance Consumer Experience
8.4 Manufacturing
8.4.1 Use of Autonomous Agents to Increase in Various Manufacturing Applications
8.5 Healthcare
8.5.1 Healthcare Vertical to Adopt Autonomous Agents to Improve Decision-Making
8.6 Transportation and Mobility
8.6.1 Transportation and Mobility Vertical to Use Autonomous Agents, AI Platforms, and the Ml Technology to Solve Traffic Congestion-Related Problems
8.7 Others
9 Autonomous Agents Market, By Region (Page No. - 50)
9.1 Introduction
9.2 North America
9.2.1 Ability to Invest in High-Growth Technologies to Drive the Adoption of Autonomous Agents in North America
9.3 Europe
9.3.1 Establishment of Relevant Framework for Policy Development and Adoption of Emerging Technologies Across Verticals to Boost the Adoption of Autonomous Agents in Europe
9.4 Asia Pacific
9.4.1 Rising Adoption of Advanced Technologies to Increase the Growth Opportunities for Autonomous Agents in Asia Pacific
9.5 Rest of the World
10 Competitive Landscape (Page No. - 60)
10.1 Introduction
10.1.1 New Product/Solution Launches and Product Enhancements
10.1.2 Business Expansions
10.1.3 Acquisitions
10.1.4 Partnerships and Collaborations
11 Company Profiles (Page No. - 65)
11.1 Introduction
(Business Overview, Products With Potential Autonomous Agents Capabilities, Key Insights, Recent Developments, SWOT Analysis, MnM View)*
11.2 Oracle
11.3 IBM
11.4 SAP
11.5 AWS
11.6 SAS
11.7 Infosys
11.8 Nuance Communications
11.9 FICO
11.10 Fetch.Ai
11.11 Affectiva
11.12 Intel
11.13 Salesforce
11.14 Aptiv
11.15 Google
11.16 Microsoft
*Details on Business Overview, Products With Potential Autonomous Agents Capabilities, Key Insights, Recent Developments, SWOT Analysis, MnM View Might Not Be Captured in Case of Unlisted Companies.
12 Appendix (Page No. - 89)
12.1 Discussion Guide
12.2 Knowledge Store: Marketsandmarkets’ Subscription Portal
12.3 Available Customizations
12.4 Related Reports
12.5 Author Details
List of Tables (31 Tables)
Table 1 United States Dollar Exchange Rate, 2016–2018
Table 2 Autonomous Agents Market Size, By Deployment Type, 2017–2024 (USD Million)
Table 3 Cloud: Autonomous Agents Industry Size, By Region, 2017–2024 (USD Million)
Table 4 On-Premises: Market Size, By Region, 2017–2024 (USD Million)
Table 5 Market Size, By Organization Size, 2017–2024 (USD Million)
Table 6 Small and Medium-Sized Enterprises: Market Size, By Region, 2017–2024 (USD Million)
Table 7 Large Enterprises: Market Size, By Region, 2017–2024 (USD Million)
Table 8 Autonomous Agents Industry Size, By Vertical, 2017–2024 (USD Million)
Table 9 Banking, Financial Services, and Insurance: Autonomous Agents Market Size, By Region, 2017–2024 (USD Million)
Table 10 IT and Telecom: Market Size, By Region, 2017–2024 (USD Million)
Table 11 Manufacturing: Market Size, By Region, 2017–2024 (USD Million)
Table 12 Healthcare: Autonomous Agents Industry Size, By Region, 2017–2024 (USD Million)
Table 13 Transportation and Mobility: Market Size, By Region, 2017–2024 (USD Million)
Table 14 Others: Market Size, By Region, 2017–2024 (USD Million)
Table 15 Market Size, By Region, 2017–2024 (USD Million)
Table 16 North America: Autonomous Agents Market Size, By Deployment Type, 2017–2024 (USD Million)
Table 17 North America: Market Size, By Organization Size, 2017–2024 (USD Million)
Table 18 North America: Market Size, By Vertical, 2017–2024 (USD Million)
Table 19 Europe:Market Size, By Deployment Type, 2017–2024 (USD Million)
Table 20 Europe: Autonomous Agents Industry Size, By Organization Size, 2017–2024 (USD Million)
Table 21 Europe: Autonomous Agents Industry Size, By Vertical, 2017–2024 (USD Million)
Table 22 Asia Pacific: Autonomous Agents Industry Size, By Deployment Type, 2017–2024 (USD Million)
Table 23 Asia Pacific: Market Size, By Organization Size, 2017–2024 (USD Million)
Table 24 Asia Pacific: Market Size, By Vertical, 2017–2024 (USD Million)
Table 25 Rest of the World: Industry Size, By Deployment Type, 2017–2024 (USD Million)
Table 26 Rest of the World: Industry Size, By Organization Size, 2017–2024 (USD Million)
Table 27 Rest of the World: Autonomous Agents Market Size, By Vertical, 2017–2024 (USD Million)
Table 28 New Product/Solution Launches and Product Enhancements, 2016–2019
Table 29 Business Expansions, 2016–2018
Table 30 Acquisitions, 2017–2018
Table 31 Partnerships and Collaborations, 2017–2018
List of Figures (29 Figures)
Figure 1 Autonomous Agents Market: Research Design
Figure 2 Autonomous Agents Industry: Top-Down and Bottom-Up Approaches
Figure 3 Global Autonomous Agents Industry Size, 2017–2024 (USD Million)
Figure 4 Segments With the Highest CAGR in the Autonomous Agents Market
Figure 5 North America Accounted for the Highest Market Share in 2019
Figure 6 Increasing Adoption of Artificial Intelligence-Based Solutions to Positively Affect the Autonomous Agents Adoption
Figure 7 Large Enterprises Segment to Have A Higher Market Share in 2019
Figure 8 IT and Telecom Vertical to Have the Largest Market Size in 2019
Figure 9 Asia Pacific to Emerge as the Best Market for Investments in the Next 5 Years
Figure 10 Drivers, Restraints, Opportunities, and Challenges: Autonomous Agents Market
Figure 11 Cloud Segment to Grow at A Higher CAGR During the Forecast Period
Figure 12 Small and Medium-Sized Enterprises Segment to Grow at A Higher CAGR During the Forecast Period
Figure 13 Manufacturing Vertical to Grow at the Highest CAGR During the Forecast Period
Figure 14 Asia Pacific to Grow at the Highest CAGR During the Forecast Period
Figure 15 North America: Market Snapshot
Figure 16 Asia Pacific: Market Snapshot
Figure 17 Key Developments By the Leading Players in the Autonomous Agents Market, 2016–2019
Figure 18 Geographic Revenue Mix of the Top Market Players
Figure 19 Oracle: Company Snapshot
Figure 20 Oracle: SWOT Analysis
Figure 21 IBM: Company Snapshot
Figure 22 IBM: SWOT Analysis
Figure 23 SAP: Company Snapshot
Figure 24 SAP: SWOT Analysis
Figure 25 AWS: Company Snapshot
Figure 26 SAS: Company Snapshot
Figure 27 Infosys: Company Snapshot
Figure 28 Nuance Communications: Company Snapshot
Figure 29 FICO: Company Snapshot
The study involved 4 major activities to estimate the current market size of the autonomous agents market. Exhaustive secondary research was done to collect information on the market and the peer market. The next step was to validate these findings, assumptions, and sizing with industry experts across the value chain through primary research. Both top-down and bottom-up approaches were employed to estimate the complete market size. After that, the market breakup and data triangulation procedures were used to estimate the market size of the segments and subsegments.
Secondary Research
The market size for companies offering autonomous agents solutions was arrived at on the basis of the secondary data available through paid and unpaid sources, and by analyzing the product portfolios of the major companies in the ecosystem and rating them according to their performance and quality. In the secondary research process, various sources were referred to, for identifying and collecting information for this study. The secondary sources included annual reports, press releases, and investor presentations of companies, white papers, journals, certified publications, and articles from recognized authors, directories, and databases.
Secondary research was mainly used to obtain key information about the industry’s supply chain, the total pool of key players, market classification and segmentation according to industry trends to the bottom-most level, regional markets, and key developments from both the market and technology-oriented perspectives, all of which were further validated by primary sources.
Primary Research
In the primary research process, various sources from both the supply and demand sides were interviewed to obtain qualitative and quantitative information for making this report. The primary sources from the supply side included industry experts, such as Chief Executive Officers (CEOs), Vice Presidents (VPs), marketing directors, technology and innovation directors, and related key executives from various key companies and organizations operating in the autonomous agents market.
After the complete market engineering (including calculations for market statistics, market breakup, market size estimations, market forecasting, and data triangulation), extensive primary research was conducted to gather information, and verify and validate the critical numbers arrived at. Primary research was also conducted to identify the segmentation types; competitive landscape of autonomous agents solution and service providers; and key market dynamics, such as drivers, restraints, opportunities, challenges, industry trends, and key players’ strategies.
The following figure depicts the breakup of the primary profiles:
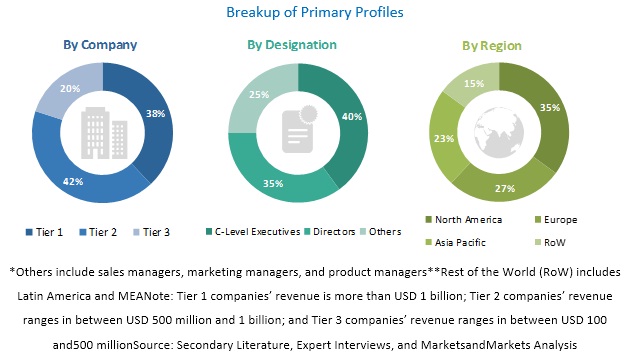
To know about the assumptions considered for the study, download the pdf brochure
Market Size Estimation
Both top-down and bottom-up approaches were used to estimate and validate the total size of the autonomous agents market. They were also used extensively to estimate the size of various subsegments in the market. The research methodology used to estimate the market size includes the following:
- The key players in the industry and markets have been identified through extensive secondary research.
- The industry’s supply chain and market size, in terms of value, have been determined through primary and secondary research processes.
- All percentage shares, splits, and breakups have been determined using secondary sources and verified through primary sources.
Data Triangulation
After arriving at the overall market size using the market size estimation processes as explained above, the market was split into several segments and subsegments. To complete the overall market engineering process and arrive at the exact statistics of each market segment and subsegment, the data triangulation and market breakup procedures were employed, wherever applicable. The data was triangulated by studying several factors and trends from both, the demand and supply sides, in the autonomous agents market.
Report Objectives
- To define, segment, and project the global market size of the market
- To understand the structure of the market by identifying its various subsegments
- To provide detailed information about the key factors (drivers, restraints, opportunities, and industry-specific challenges) influencing the growth of the market
- To analyze the micromarkets with respect to individual growth trends, prospects, and their contribution to the total market
- To project the size of the market and its submarkets, in terms of value, with respect to the 5 major regions (along with their respective key countries)
- To profile key players and comprehensively analyze their core competencies
- To understand the competitive landscape and identify major growth strategies adopted by players across key regions
- To analyze the competitive developments, such as expansions and investments, new product launches, mergers and acquisitions, joint ventures, and agreements, in the autonomous agents market
Critical questions the report answers:
- How will the acquisition made by leading vendor shape the Autonomous Agents Market in the near future?
- Which segment provides the most opportunity for growth?
- What are the opportunities for new market entrants?
- Where will all these developments take the industry in the mid to long-term?
- What are the upcoming verticals for the market?
Available Customizations
With the given market data, MarketsandMarkets offers customizations as per the company’s specific needs and on best effort basis for profiling of additional market players.


Growth opportunities and latent adjacency in Autonomous Agents Market