MRO Software Market in Aviation by End User (Operators, OEMs, MROs, Lessors), Solution (Software, Services), Deployment Type (On-premises, Cloud), Function (Maintenance, Operations, Business Management), Pricing Model, and Region (2020-2025)


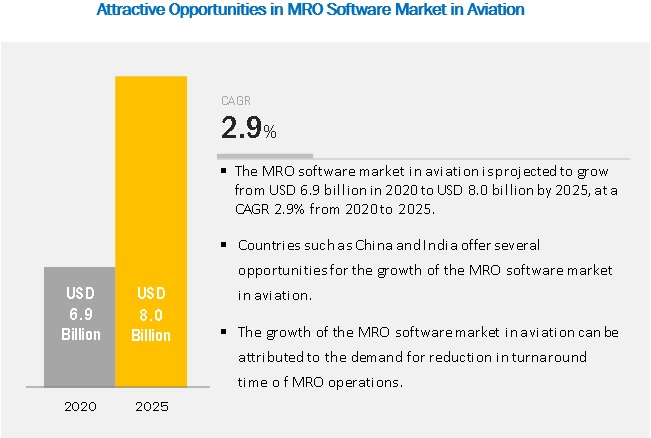
The MRO Software Market Size in Aviation is estimated to be USD 6.9 billion in 2020 and is projected to reach USD 8.0 billion by 2025, at a CAGR of 2.9% from 2020 to 2025.
The rise in demand for reducing the turnaround time and increase in the adoption of software-as-a-service are among the major factors that are expected to drive the market in the coming years.
Cloud segment is anticipated to grow at a higher CAGR during forecast period
Based on deployment type, the cloud segment is anticipated to grow at a higher CAGR during the forecast period. Cloud-based solutions, also called software-as-a-service, are provided as a service wherein the ERP vendor manages the data, and the services are accessed through a web browser. More recently, the industry has adopted a hybrid model, in which cloud software is hosted on a company’s private servers.
MROs segment is anticipated to grow at highest CAGR during forecast period
The MRO industry uses aviation MRO software mainly to enhance the functional efficiency for various aviation MRO activities, such as services, maintenance, upgrade, and retrofitting of different aircraft engines, spares, components, and systems. The MROs segment is further classified based on employee size, considering which the adoption of aviation MRO software is decided. Replacement of old MRO software systems with advanced digitalized software solutions and IT infrastructure modernization programs are expected to drive the MROs segment.
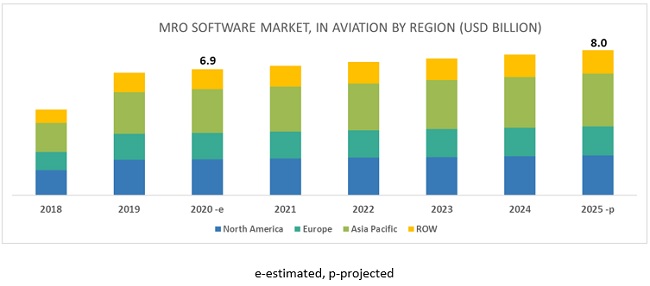
Asia Pacific expected to lead MRO software market in aviation in 2020
The MRO software market share in aviation is expected to witness substantial growth in Asia Pacific during the forecast period. An increase in passenger traffic is the primary reason for the increased demand for maintenance technicians, and thereby, MRO software, especially in countries such as India, China, Japan, and Singapore. The market is also expected to witness high growth in this region owing to the presence of various major aviation MRO software providers, such as HCL Technologies Limited (India) and Ramco Systems Limited (India).
Key Market Players
The key market players in the MRO software market in aviation are HCL Technologies Limited (India), SAP SE (Germany), International Business Machines Corporation (US), Ramco Systems Limited (India), IFS AB (Sweden), Oracle Corporation (US), Boeing (US), Infor (US), Trax (US), Swiss AviationSoftware (Switzerland), IBS Software (India), Rusada (Switzerland), Communications Software Limited (UK), Flatirons Solutions, Inc. (US), Aviation Intertec Services (Canada), BytzSoft Technologies Pvt. Ltd. (India), Tracware Limited (UK), FLY Online Tools (US), Aerosoft Systems Inc. (US), Lufthansa Technik AG (Germany), GE Aviation (US), and Sopra Steria (France).
Get online access to the report on the World's First Market Intelligence Cloud
- Easy to Download Historical Data & Forecast Numbers
- Company Analysis Dashboard for high growth potential opportunities
- Research Analyst Access for customization & queries
- Competitor Analysis with Interactive dashboard
- Latest News, Updates & Trend analysis
Request Sample Scope of the Report
Get online access to the report on the World's First Market Intelligence Cloud
- Easy to Download Historical Data & Forecast Numbers
- Company Analysis Dashboard for high growth potential opportunities
- Research Analyst Access for customization & queries
- Competitor Analysis with Interactive dashboard
- Latest News, Updates & Trend analysis

|
Report Metric |
Details |
|
Estimated Market Size |
USD 6.9 Billion |
|
Projected Market Size |
USD 8.0 Billion |
|
CAGR |
2.9% |
|
Market size available for years |
2017-2030 |
|
Base year considered |
2018 |
|
Forecast period |
2019-2030 |
|
Forecast units |
Value (USD) |
|
Segments covered for the autonomous last mile delivery market share |
Based on platform [aerial delivery vehicles (solution, type, application, payload weight, and range) and ground delivery vehicles (solution, type, application, payload weight, range and duration)] and region |
|
Geographies covered |
North America, Asia Pacific, Europe, Middle East, Latin America, and Africa |
|
Companies covered |
Starship Technologies (US), Savioke (US), Nuro (US), JD.com (China), and Flirtey (US), among others. |
This research report categorizes the autonomous last mile delivery market based on platform [aerial delivery vehicles (solution, type, application, payload weight, and range) and ground delivery vehicles (solution, type, application, payload weight, and range)] and region.
Based on platform, the autonomous last mile delivery market has been segmented as follows
- Aerial Delivery Drones
- Ground Delivery Vehicles
Based on solution, the aerial delivery drones market has been segmented as follows
- Hardware
- Infrastructure
- Software
Based on type, the aerial delivery drones market has been segmented as follows
- Fixed-wing
- Rotary-wing
- Hybrid
Based on application, the aerial delivery drones market has been segmented as follows
- Logistics & Transportation
- Healthcare & Pharmacy
- Retail & Food Delivery
Based on payload weight, the aerial delivery drones market has been segmented as follows
- < 5 Kilograms
- 5-10 Kilograms
- > 10 Kilograms
Based on range, the aerial delivery drones market has been segmented as follows
- Short Range (<20 Kilometers)
- Long Range (>20 Kilometers)
Based on duration, the aerial delivery drones market has been segmented as follows
- <30 minutes
- >30 minutes
Based on solution, the ground delivery vehicles market has been segmented as follows
- Hardware
- Infrastructure
- Software
Based on type, the ground delivery vehicles market has been segmented as follows
- Delivery Bots
- Autonomous/ Self-driving Delivery Vans & Trucks
Based on application, the ground delivery vehicles market has been segmented as follows
- Logistics & Transportation
- Retail & Food Delivery
Based on payload weight, the ground delivery vehicles market has been segmented as follows
- <5 Kilograms
- 5-10 Kilograms
- >10 Kilograms
Based on range, the ground delivery vehicles market has been segmented as follows
- Short Range (<20 Kilometers)
- Long Range (>20 Kilometers)
Based on duration, the ground delivery vehicles market has been segmented as follows
- <30 minutes
- >30 minutes
Based on region, the autonomous last mile delivery market has been segmented as follows
- North America
- Europe
- Asia Pacific
- Middle East
- Latin America
- Africa
Key Questions Addressed by the Report
- What is the growth perspective of the MRO software market in aviation?
- What are the key dynamics and trends governing the market?
- What are the various segments and subsegments of the MRO software market in aviation?
- What are the key sustainability strategies adopted by the leading players in the MRO software market in aviation?
- What are the new and emerging technologies and use cases disrupting the MRO software market in aviation?
Frequently Asked Questions (FAQ):
What is the growth perspective of the MRO software market in aviation?
The MRO software market in aviation is expected to grow substantially owing to the extensive adoption of software-as-a-service (SaaS) in the aviation industry. The need by end-users such as OEMs, lessors, MROs, and airlines to reduce their turnaround time is also an important factor in driving the market growth.
What is the estimated growth rate of the MRO software market in aviation?
The global MRO software market in aviation is projected to grow at a CAGR of 2.9% during the forecast period (2020-2025). The increasing adoption of IoT, AI, AR, and big data analytics by MROs, OEMs, lessors, and airlines across the globe is one of the major opportunities for players in the market.
What are the new & emerging technologies and use cases disrupting the MRO software market in aviation?
Some of the major emerging technologies and use cases disrupting the market include IoT, Prescriptive Maintenance, Augmented Reality, Blockchain, Maintenance-On-The-Go, 3D Printing, Big Data, Advanced Analytics, Digital Transformation, and Artificial Intelligence, among others.
What are the key sustainability strategies adopted by the leading players in the MRO software market in aviation?
Contracts and agreements are some of the key sustainability strategies adopted by the leading market players, such as HCL Technologies Limited (India), SAP SE (Germany), International Business Machines Corporation (US), Ramco Systems Limited (India), IFS AB (Sweden), Oracle Corporation (US), Boeing (US), Infor (US), Trax (US), Swiss AviationSoftware (Switzerland), Lufthansa Technik AG (Germany), GE Aviation (US) and Sopra Steria (France), among others.
Which region is expected to hold the highest market share in the MRO software market in aviation?
Asia Pacific is anticipated to have the highest market share in the global MRO software market in aviation, owing to the rise in domestic and international air travel. An increase in passenger traffic is the primary reason for the growing demand for maintenance technicians, and thereby, MRO software, especially in countries such as India, China, Japan, and Singapore. The market is also expected to witness high growth owing to the presence of various major aviation MRO software providers, such as HCL Technologies Limited (India) and Ramco Systems Limited (India).
To speak to our analyst for a discussion on the above findings, click Speak to Analyst
TABLE OF CONTENTS
1 INTRODUCTION (Page No. - 23)
1.1 OBJECTIVES OF THE STUDY
1.2 MARKET DEFINITION
1.3 STUDY SCOPE
1.3.1 MARKETS COVERED
1.3.2 REGIONAL SCOPE
1.3.3 YEARS CONSIDERED FOR THE STUDY
1.4 CURRENCY
1.5 LIMITATIONS
1.6 MARKET STAKEHOLDERS
2 RESEARCH METHODOLOGY (Page No. - 27)
2.1 RESEARCH DATA
2.1.1 SECONDARY DATA
2.1.1.1 Key data from secondary sources
2.1.2 PRIMARY DATA
2.1.2.1 Key data from primary sources
2.1.3 MARKET DEFINITION & SCOPE
2.1.3.1 Inclusion
2.1.3.2 Exclusion
2.1.4 SEGMENT DEFINITION
2.1.4.1 Solution
2.1.4.2 Function
2.1.4.3 Deployment type
2.1.4.4 End user
2.1.4.5 Pricing model
2.2 RESEARCH APPROACH & METHODOLOGY
2.2.1 BOTTOM-UP APPROACH
2.2.2 SOFTWARE
2.2.2.1 CALCULATION FOR SOFTWARE
2.2.2.2 CALCULATION OF SERVICES
2.3 DATA TRIANGULATION & VALIDATION
2.3.1 DATA TRIANGULATION THROUGH SECONDARY RESEARCH
2.3.2 DATA TRIANGULATION THROUGH PRIMARIES
2.4 RESEARCH ASSUMPTIONS
2.4.1 MARKET SIZING AND MARKET FORECASTING
2.5 RISK ANALYSIS
3 EXECUTIVE SUMMARY (Page No. - 38)
4 PREMIUM INSIGHTS (Page No. - 40)
4.1 ATTRACTIVE OPPORTUNITIES IN MRO SOFTWARE MARKET IN AVIATION
4.2 MRO SOFTWARE MARKET IN AVIATION, BY SOLUTION
4.3 MRO SOFTWARE MARKET IN AVIATION, BY FUNCTION
4.4 MRO SOFTWARE MARKET IN AVIATION, BY REGION
5 MARKET OVERVIEW (Page No. - 42)
5.1 INTRODUCTION
5.2 MARKET DYNAMICS
5.2.1 DRIVERS
5.2.1.1 Increase in demand for predictive, prescriptive, and condition-based maintenance through data shared by connected aircraft
5.2.1.2 Increasing adoption of software as a service
5.2.1.3 Demand for shift from legacy management information system (MIS) to MRO software in aviation
5.2.1.4 Need to reduce turnaround time (TAT)
5.2.2 RESTRAINTS
5.2.2.1 Limited budget restrains adoption of integrated MRO software suite
5.2.2.2 Lack of common data standards
5.2.3 OPPORTUNITIES
5.2.3.1 Increasing adoption of IoT, AI, AR, and big data analytics by MROs
5.2.4 CHALLENGES
5.2.4.1 Compliance with stringent aviation regulations
6 INDUSTRY TRENDS (Page No. - 49)
6.1 INTRODUCTION
6.2 TECHNOLOGICAL TRENDS IN THE AVIATION MRO
6.2.1 INTERNET OF THINGS (IOT)
6.2.2 PRESCRIPTIVE MAINTENANCE
6.2.3 AUGMENTED REALITY
6.2.4 BLOCKCHAIN
6.3 DATA SCIENCE REVOLUTION TRANSFORMING AVIATION
6.4 EMERGING TRENDS
6.4.1 MAINTENANCE ON-THE-GO
6.4.2 INCREASED MOBILITY
6.4.3 3D PRINTING
6.4.4 BIG DATA
6.5 APPLICATION AREAS FOR NEW TECHNOLOGIES IN AVIATION MRO SOFTWARE
6.5.1 INTRODUCTION
6.5.2 CLOUD TECHNOLOGY
6.5.3 ADVANCED ANALYTICS AND DIGITAL TRANSFORMATION
6.5.4 DATA ROUTING
6.5.5 ARTIFICIAL INTELLIGENCE
6.5.6 INTERNET OF THINGS
6.6 PARAMETERS FOR SELECTION OF MRO SOFTWARE
6.6.1 SELECTION PARAMETERS
6.7 USE CASES
6.7.1 A LEADING INTERNATIONAL AIRLINE ACHIEVES 100% REPORTING COMPLIANCE THROUGH MRO SOFTWARE
6.7.2 AIR MEDICAL GROUP HOLDINGS USES MRO SOFTWARE FOR ACCURATE REAL-TIME MAINTENANCE FORECASTING
6.7.3 AIR TAHITI DEPLOYS ONE-STOP MRO SOFTWARE SOLUTION TO GAIN END-TO-END M&E OPTIMIZATION
6.7.4 A LEADING AIRLINE WAS ABLE TO INTEGRATE ITS BUSINESS IN A FASTER, BETTER, AND CHEAPER WAY THROUGH MRO SOFTWARE
6.7.5 A LEADING HELICOPTER OPERATOR WAS ABLE TO ENHANCE ITS MAINTENANCE MANAGEMENT THROUGH MRO SOFTWARE
6.7.6 A LEADING ENGINE MRO NEEDED ON-PREMISE END-TO-END MRO SOFTWARE SOLUTION
6.7.7 ONE OF THE LARGEST AIRCRAFT MROS REQUIRED AN END-TO-END MRO SOFTWARE SOLUTION TO PREVENT COST LEAKAGE AND PERFORMANCE INCONSISTENCY
7 MRO SOFTWARE MARKET SIZE IN AVIATION, BY SOLUTION (Page No. - 59)
7.1 INTRODUCTION
7.2 SOFTWARE
7.2.1 ENTERPRISE RESOURCE PLANNING (ERP) SOLUTION
7.2.1.1 New ERP solutions enable higher mobility of data and allow employees to access ERP applications from their home computers or smartphones
7.2.2 POINT SOLUTION
7.2.2.1 Point solutions are designed to solve specific MRO-related problems in the aviation industry
7.2.3 SUITE
7.2.3.1 Suite helps in demand-driven inventory planning for materials requirement, as well as enhanced maintenance and service planning and execution for complex assets
7.3 SERVICES
7.3.1 DEPLOYMENT & INTEGRATION
7.3.1.1 Deployment & integration services include infrastructure assessment and planning services, interface design and development, upgrade assistance, and ongoing IT support
7.3.2 CONSULTING
7.3.2.1 Consulting services providers offer methods to overcome lack of technical expertise to deploy and manage data in organizations
7.3.3 SUPPORT, MAINTENANCE & UPGRADATION
7.3.3.1 Support, maintenance & upgradation services help improve operations and gain control over existing systems
8 MRO SOFTWARE MARKET SHARE IN AVIATION, BY DEPLOYMENT TYPE (Page No. - 64)
8.1 INTRODUCTION
8.2 ON-PREMISES
8.2.1 NEED FOR CUSTOMIZABLE MRO SOFTWARE ANTICIPATED TO BOOST DEMAND FOR ON-PREMISES SOLUTIONS
8.3 CLOUD
8.3.1 DEMAND FOR COST-EFFICIENT MRO SOFTWARE SOLUTIONS ANTICIPATED TO BOOST GROWTH OF CLOUD SEGMENT
8.3.2 CLOUD-BASED AVIATION MRO SOFTWARE: USE CASE
9 MRO SOFTWARE MARKET IN AVIATION, BY PRICING MODEL (Page No. - 69)
9.1 INTRODUCTION
9.2 SUBSCRIPTION MODEL
9.2.1 SUBSCRIPTION MODEL IS WIDELY ADOPTED BY USERS OF MRO SOFTWARE DUE TO ITS ADVANTAGES OF LOW COST AND FLEXIBILITY OF USE
9.3 OWNERSHIP MODEL
9.3.1 MAJOR ADVANTAGE OF OWNERSHIP MODEL IS ITS ABILITY TO MINIMIZE RISKS OF DUPLICATION, DATA BREACHES, AND EXTERNAL ATTACKS
10 MRO SOFTWARE MARKET IN AVIATION, BY FUNCTION (Page No. - 72)
10.1 INTRODUCTION
10.2 MAINTENANCE MANAGEMENT
10.2.1 LINE MAINTENANCE
10.2.1.1 Need to optimize scheduled and unscheduled maintenance activities is anticipated to boost demand for line maintenance segment during forecast period
10.2.2 BASE MAINTENANCE
10.2.2.1 Demand from operators and MROs to efficiently manage heavy check maintenance anticipated to increase demand for base maintenance MRO software module during forecast period
10.2.3 ENGINE MAINTENANCE
10.2.3.1 Component maintenance modules used for base maintenance include sales order management, invoices, capacity management, and resource management
10.2.4 FLEET MANAGEMENT
10.2.4.1 Modules for fleet management include model configuration and serviceability data, maintenance schedules, compliance data, and technical library
10.3 OPERATIONS MANAGEMENT
10.3.1 TRAINING, SAFETY & QUALITY ASSURANCE
10.3.1.1 Modules used for training, safety & quality assurance offer solution to enable adherence to safety management manual developed by International Civil Aviation Organization
10.3.2 SUPPLY CHAIN MANAGEMENT
10.3.2.1 Supply chain management module tracks status, quantity, location, and cost of parts required in inventory needed to perform MRO operations
10.3.3 ENGINEERING & CAMO
10.3.3.1 MRO software solutions for engineering and CAMO help end users in minimizing their aircraft ground time by 15%-20%
10.3.4 DOCUMENTATION
10.3.4.1 Specialized documentation software have been developed for managing critical documents to streamline business processes
10.3.5 ASSET & INVENTORY MANAGEMENT
10.3.5.1 Asset & inventory management solutions help maintain optimum levels of inventory during all stages of scheduled and unscheduled MRO activities
10.4 BUSINESS MANAGEMENT
10.4.1 ACCOUNTS & FINANCE
10.4.1.1 Accounts & finance module helps maintain and manages financial data at all locations, including financial records and budgets
10.4.2 SALES & MARKETING
10.4.2.1 Sales & marketing module helps build long-lasting relationships with customers by addressing customer grievances in a timely and efficient manner
10.4.3 HUMAN RESOURCE
10.4.3.1 Human resource management module enables proper allocation of resources for maintenance activities according to task priority
10.5 ELECTRONIC FLIGHT BAG & LOGBOOK MANAGEMENT
11 MRO SOFTWARE MARKET IN AVIATION, BY END USER (Page No. - 81)
11.1 INTRODUCTION
11.2 MRO SOFTWARE MARKET SIZE IN AVIATION, BY END USER
11.3 MRO SOFTWARE MARKET VOLUME IN AVIATION, BY END USER
11.4 OPERATORS
11.4.1 MRO SOFTWARE MARKETS IN AVIATION FOR OPERATORS, BY SOLUTION
11.4.2 MRO SOFTWARE MARKETS IN AVIATION FOR OPERATORS, BY SOFTWARE TYPE
11.4.2.1 Small airlines (less than 100 aircraft)
11.4.2.1.1 Increase in adoption of aviation MRO software for basic modules is expected to lead to increasing demand by small airlines
11.4.2.2 Medium airlines (100 to 400 aircraft)
11.4.2.2.1 Presence of in-house staff for line MRO activities with small airlines creates demand for MRO software to enhance maintenance operations
11.4.2.3 Large airlines (more than 400 aircraft)
11.4.2.3.1 Aviation MRO software help large airlines enhance MRO activities and increase average lifespan of aircraft
11.4.2.4 Business jet operators
11.4.2.4.1 Business jet operators deploy in-house MRO software to enhance maintenance management and operations management activities
11.4.2.5 Helicopter operators
11.4.2.5.1 Huge fleets lead to demand for MRO software to efficiently manage scheduled and unscheduled maintenance of helicopters
11.5 MROS
11.5.1 MRO SOFTWARE MARKET IN AVIATION FOR MROS, BY SOLUTION
11.5.2 MRO SOFTWARE MARKETS IN AVIATION FOR MROS, BY SOFTWARE TYPE
11.5.3 SMALL MROS (LESS THAN 100 EMPLOYEES)
11.5.3.1 Most small MROs adopt basic aviation MRO software modules for their basic business applications
11.5.4 MEDIUM MROS (101 TO 500 EMPLOYEES)
11.5.4.1 Most medium MROs are in transitory stage and enhancing their IT capabilities from ERP module to digitalization of entire ecosystem
11.5.5 LARGE MROS (MORE THAN 500 EMPLOYEES)
11.5.5.1 Large MROs have capability of acquiring advanced technologies to run their MRO operations and perform forward and backward integration of real-time data into their supply chain
11.6 OEMS
11.6.1 MRO SOFTWARE MARKET IN AVIATION FOR OEMS, BY SOLUTION
11.6.2 MRO SOFTWARE MARKETS IN AVIATION FOR OEMS, BY SOFTWARE TYPE
11.6.3 AIRCRAFT OEMS
11.6.3.1 MRO software help aircraft OEMs in crew and fleet scheduling, flight/mission planning and operations, maintenance planning and management, and inventory and logistics management
11.6.4 ENGINE OEMS
11.6.4.1 Engine OEMs retrieve data generated from sensors installed on different systems through MRO software for analysis of maintenance cycles
11.7 LESSORS
11.7.1 MRO SOFTWARE MARKET IN AVIATION FOR LESSORS, BY SOLUTION
11.7.2 MRO SOFTWARE MARKETS IN AVIATION FOR LESSORS, BY SOFTWARE TYPE
11.7.3 SMALL LESSORS (LESS THAN 100 AIRCRAFT)
11.7.3.1 Increase in adoption of aviation MRO software for basic modules is expected to lead to increasing demand by small lessors
11.7.4 MEDIUM LESSORS (100 TO 400 AIRCRAFT)
11.7.4.1 Presence of in-house staff for line MRO activities with medium lessors creates demand for MRO software to enhance maintenance operations
11.7.5 LARGE LESSORS (MORE THAN 400 AIRCRAFT)
11.7.5.1 Aviation MRO software help large lessors enhance MRO activities and increase average lifespan of aircraft
12 REGIONAL ANALYSIS (Page No. - 91)
12.1 INTRODUCTION
12.2 NORTH AMERICA
12.2.1 US
12.2.1.1 Increasing demand for new aircraft and maintenance technicians is expected to fuel demand for MRO software for maintenance management in US
12.2.2 CANADA
12.2.2.1 Increase in demand for maintenance technicians is further anticipated to fuel demand for MRO software for maintenance management in Canada
12.3 EUROPE
12.3.1 UK
12.3.1.1 Rise in demand for maintenance technicians will boost demand for MRO software to manage maintenance operations efficiently
12.3.2 GERMANY
12.3.2.1 Rise in demand for maintenance technicians will lead to increase in demand for MRO software in Germany during forecast period
12.3.3 RUSSIA
12.3.3.1 Rise in demand for new aircraft will increase demand for maintenance technicians and fuel growth of MRO software market in aviation in Russia
12.3.4 FRANCE
12.3.4.1 Rise in demand for maintenance technicians will further increase demand for aviation MRO software in France
12.3.5 SPAIN
12.3.5.1 Rise in passenger traffic is anticipated to increase aircraft deliveries and subsequently drive demand for MRO software in Spain
12.3.6 SWEDEN
12.3.6.1 Increase in aircraft fleet size by leading airlines is expected to drive demand for MRO services in Sweden
12.3.7 NETHERLANDS
12.3.7.1 Medium-scale MROs and airlines majorly drive market for aviation MRO software in Netherlands
12.3.8 REST OF EUROPE
12.3.8.1 Rise in aircraft deliveries is projected to increase demand for new maintenance technicians and fuel market for MRO software in Rest of Europe
12.4 ASIA PACIFIC
12.4.1 CHINA
12.4.1.1 Rise in demand for maintenance technicians will boost demand for MRO software in China during forecast period
12.4.2 JAPAN
12.4.2.1 Rise in demand for maintenance crew will increase demand for MRO software to perform maintenance activities
12.4.3 INDIA
12.4.3.1 Rise in demand for maintenance technicians will fuel demand for MRO software for maintenance management during forecast period
12.4.4 SINGAPORE
12.4.4.1 Rise in demand for new maintenance technicians in Singapore will drive demand for MRO software in the country during forecast period
12.4.5 REST OF ASIA PACIFIC
12.4.5.1 Growth in aircraft orders will lead to rise in demand for maintenance technicians and MRO software during forecast period in Rest of Asia Pacific
12.5 REST OF THE WORLD
12.5.1 LATIN AMERICA
12.5.1.1 Rise in aircraft deliveries will increase demand for new aircraft maintenance technicians and boost demand for MRO software in Latin America
12.5.2 MIDDLE EAST
12.5.2.1 Adoption of MRO software can be attributed to rise in demand for new maintenance technicians
12.5.3 AFRICA
12.5.3.1 Rise in demand for new maintenance technicians will lead to increase in demand for MRO software in Africa during forecast period
13 COMPETITIVE LANDSCAPE (Page No. - 131)
13.1 INTRODUCTION
13.2 COMPETITIVE LEADERSHIP MAPPING
13.2.1 VISIONARY LEADERS
13.2.2 INNOVATORS
13.2.3 DYNAMIC DIFFERENTIATORS
13.2.4 EMERGING COMPANIES
13.3 RANKING OF KEY PLAYERS, 2019
13.3.1 WINNING IMPERATIVES, BY KEY PLAYERS
13.4 COMPETITIVE SCENARIO
13.4.1 NEW PRODUCT LAUNCHES
13.4.2 CONTRACTS
13.4.3 OTHER DEVELOPMENTS
14 COMPANY PROFILES (Page No. - 143)
(Business Overview, Products Offered, Recent Developments, SWOT Analysis, MnM View)*
14.1 HCL TECHNOLOGIES LIMITED
14.2 BOEING
14.3 SAP SE
14.4 INTERNATIONAL BUSINESS MACHINES CORPORATION (IBM)
14.5 RAMCO SYSTEMS LIMITED
14.6 IFS (INDUSTRIAL AND FINANCIAL SYSTEMS) AB
14.7 ORACLE CORPORATION
14.8 INFOR
14.9 TRAX
14.10 SWISS AVIATIONSOFTWARE LTD.
14.11 IBS SOFTWARE
14.12 RUSADA
14.13 COMMUNICATIONS SOFTWARE LIMITED
14.14 FLATIRONS SOLUTIONS, INC.
14.15 AVIATION INTERTEC SERVICES
14.16 BYTZSOFT TECHNOLOGIES PVT. LTD.
14.17 TRACWARE LIMITED
14.18 FLY ONLINE TOOLS
14.19 AEROSOFT SYSTEMS INC.
14.20 SOPRA STERIA
14.21 LUFTHANSA TECHNIK AG
14.22 GE AVIATION
*Details on Business Overview, Products Offered, Recent Developments, SWOT Analysis, MnM View might not be captured in case of unlisted companies.
15 APPENDIX (Page No. - 189)
15.1 DISCUSSION GUIDE
15.2 KNOWLEDGE STORE: MARKETSANDMARKETS’ SUBSCRIPTION PORTAL
15.3 AVAILABLE CUSTOMIZATIONS
15.4 RELATED REPORTS
15.5 AUTHOR DETAILS
LIST OF TABLES (142 TABLES)
TABLE 1 USD EXCHANGE RATES
TABLE 2 MRO SOFTWARE MARKET IN AVIATION, BY SOLUTION, 2018–2025 (USD MILLION)
TABLE 3 MRO SOFTWARE INDUSTRY IN AVIATION, BY SOFTWARE TYPE, 2018–2025 (USD MILLION)
TABLE 4 MARKETS IN AVIATION FOR SERVICES, BY APPLICATION, 2018–2025 (USD MILLION)
TABLE 5 MRO SOFTWARE INDUSTRY IN AVIATION, BY DEPLOYMENT TYPE, 2018–2025 (USD MILLION)
TABLE 6 MRO SOFTWARE MARKET IN AVIATION, BY DEPLOYMENT TYPE, 2018–2025 (MILLION UNITS)
TABLE 7 ON-PREMISES AVIATION MRO SOFTWARE: PROS AND CONS
TABLE 8 CLOUD-BASED AVIATION MRO SOFTWARE: PROS AND CONS
TABLE 9 MARKETS IN AVIATION, BY PRICING MODEL, 2018–2025 (USD MILLION)
TABLE 10 MRO SOFTWARE INDUSTRY IN AVIATION, BY FUNCTION, 2018–2025 (USD MILLION)
TABLE 11 MARKET IN AVIATION, BY FUNCTION, 2018–2025 (MILLION UNITS)
TABLE 12 MAINTENANCE MANAGEMENT MARKET, BY APPLICATION, 2018–2025 (USD MILLION)
TABLE 13 OPERATIONS MANAGEMENT MARKET, BY APPLICATION, 2018–2025 (USD MILLION)
TABLE 14 BUSINESS MANAGEMENT MARKET, BY APPLICATION, 2018–2025 (USD MILLION)
TABLE 15 MRO SOFTWARE MARKETS IN AVIATION, BY END USER, 2018–2025 (USD MILLION)
TABLE 16 MARKET IN AVIATION, BY END USER, 2018–2025 (MILLION UNITS)
TABLE 17 MARKET IN AVIATION, BY OPERATOR TYPE, 2018–2025 (USD MILLION)
TABLE 18 MARKET IN AVIATION FOR OPERATORS, BY SOLUTION 2018–2025 (USD MILLION)
TABLE 19 MRO SOFTWARE INDUSTRY IN AVIATION FOR OPERATORS, BY SOFTWARE TYPE, 2018–2025 (USD MILLION)
TABLE 20 MARKET IN AVIATION, BY MRO TYPE, 2018–2025 (USD MILLION)
TABLE 21 MARKET IN AVIATION FOR MROS, BY SOLUTION 2018–2025 (USD MILLION)
TABLE 22 MARKETS IN AVIATION FOR MROS, BY SOFTWARE TYPE, 2018–2025 (USD MILLION)
TABLE 23 MRO SOFTWARE INDUSTRY IN AVIATION, BY OEM TYPE, 2018–2025 (USD MILLION)
TABLE 24 MARKET IN AVIATION FOR OEMS, BY SOLUTION 2018–2025 (USD MILLION)
TABLE 25 MARKET IN AVIATION FOR OEMS, BY SOFTWARE TYPE, 2018–2025 (USD MILLION)
TABLE 26 MARKETS IN AVIATION, BY LESSOR TYPE, 2018–2025 (USD MILLION)
TABLE 27 MRO SOFTWARE MARKETS IN AVIATION FOR LESSORS, BY SOLUTION 2018–2025 (USD MILLION)
TABLE 28 MRO SOFTWARE INDUSTRY IN AVIATION FOR LESSORS, BY SOFTWARE TYPE, 2018–2025 (USD MILLION)
TABLE 29 MARKET IN AVIATION, BY REGION, 2018–2025 (USD MILLION)
TABLE 30 MARKET IN AVIATION, BY REGION, 2018–2025 (MILLION UNITS)
TABLE 31 NORTH AMERICA: MRO SOFTWARE MARKETS IN AVIATION, BY SOLUTION, 2018–2025 (USD MILLION)
TABLE 32 NORTH AMERICA: MRO SOFTWARE INDUSTRY IN AVIATION, BY FUNCTION, 2018–2025 (USD MILLION)
TABLE 33 NORTH AMERICA: MARKET IN AVIATION, BY FUNCTION, 2018–2025 (MILLION UNITS)
TABLE 34 NORTH AMERICA: MARKETS IN AVIATION, BY DEPLOYMENT TYPE, 2018–2025 (USD MILLION)
TABLE 35 NORTH AMERICA: MRO SOFTWARE INDUSTRY IN AVIATION, BY DEPLOYMENT TYPE, 2018–2025 (MILLION UNITS)
TABLE 36 NORTH AMERICA: MARKETS IN AVIATION, BY END USER, 2018–2025 (USD MILLION)
TABLE 37 NORTH AMERICA: MARKET IN AVIATION, BY END USER, 2018–2025 (MILLION UNITS)
TABLE 38 NORTH AMERICA: MRO SOFTWARE INDUSTRY IN AVIATION, BY COUNTRY, 2018–2025 (USD MILLION)
TABLE 39 NORTH AMERICA: MRO SOFTWARE MARKET IN AVIATION, BY COUNTRY, 2018–2025 (MILLION UNITS)
TABLE 40 US: MARKETS IN AVIATION, BY SOLUTION, 2018–2025 (USD MILLION)
TABLE 41 US: MARKET IN AVIATION, BY FUNCTION, 2018–2025 (USD MILLION)
TABLE 42 US: MARKETS IN AVIATION, BY DEPLOYMENT TYPE, 2018–2025 (USD MILLION)
TABLE 43 US: MRO SOFTWARE INDUSTRY IN AVIATION, BY END USER, 2018–2025 (USD MILLION)
TABLE 44 CANADA: MRO SOFTWARE MARKET IN AVIATION, BY SOLUTION, 2018–2025 (USD MILLION)
TABLE 45 CANADA: MARKET IN AVIATION, BY FUNCTION, 2018–2025 (USD MILLION)
TABLE 46 CANADA: MARKETS IN AVIATION, BY DEPLOYMENT TYPE, 2018–2025 (USD MILLION)
TABLE 47 CANADA: MARKETS IN AVIATION, BY END USER, 2018–2025 (USD MILLION)
TABLE 48 EUROPE: MARKET IN AVIATION, BY SOLUTION, 2018–2025 (USD MILLION)
TABLE 49 EUROPE: MRO SOFTWARE INDUSTRY IN AVIATION, BY FUNCTION, 2018–2025 (USD MILLION)
TABLE 50 EUROPE: MARKETS IN AVIATION, BY FUNCTION, 2018–2025 (MILLION UNITS)
TABLE 51 EUROPE: MRO SOFTWARE MARKET IN AVIATION, BY DEPLOYMENT TYPE, 2018–2025 (USD MILLION)
TABLE 52 EUROPE: MARKET IN AVIATION, BY DEPLOYMENT TYPE, 2018–2025 (MILLION UNITS)
TABLE 53 EUROPE: MARKETS IN AVIATION, BY END USER, 2018–2025 (USD MILLION)
TABLE 54 EUROPE: MRO SOFTWARE INDUSTRY IN AVIATION, BY END USER, 2018–2025 (MILLION UNITS)
TABLE 55 EUROPE: MARKETS IN AVIATION, BY COUNTRY, 2018–2025 (USD MILLION)
TABLE 56 EUROPE: MARKET IN AVIATION, BY COUNTRY, 2018–2025 (MILLION UNITS)
TABLE 57 UK: MARKETS IN AVIATION, BY SOLUTION, 2018–2025 (USD MILLION)
TABLE 58 UK: MARKET IN AVIATION, BY FUNCTION, 2018–2025 (USD MILLION)
TABLE 59 UK: MRO SOFTWARE MARKET IN AVIATION, BY DEPLOYMENT TYPE, 2018–2025 (USD MILLION)
TABLE 60 UK: MARKETS IN AVIATION, BY END USER, 2018–2025 (USD MILLION)
TABLE 61 GERMANY: MARKET IN AVIATION, BY SOLUTION, 2018–2025 (USD MILLION)
TABLE 62 GERMANY: MRO SOFTWARE MARKETS IN AVIATION, BY FUNCTION, 2018–2025 (USD MILLION)
TABLE 63 GERMANY: MRO SOFTWARE INDUSTRY IN AVIATION, BY DEPLOYMENT TYPE, 2018–2025 (USD MILLION)
TABLE 64 GERMANY: MARKET IN AVIATION, BY END USER, 2018–2025 (USD MILLION)
TABLE 65 RUSSIA: MARKETS IN AVIATION, BY SOLUTION, 2018–2025 (USD MILLION)
TABLE 66 RUSSIA: MARKET IN AVIATION, BY FUNCTION, 2018–2025 (USD MILLION)
TABLE 67 RUSSIA: MARKET IN AVIATION, BY DEPLOYMENT TYPE, 2018–2025 (USD MILLION)
TABLE 68 RUSSIA: MRO SOFTWARE MARKETS IN AVIATION, BY END USER, 2018–2025 (USD MILLION)
TABLE 69 FRANCE: MRO SOFTWARE INDUSTRY IN AVIATION, BY SOLUTION, 2018–2025 (USD MILLION)
TABLE 70 FRANCE: MARKET IN AVIATION, BY FUNCTION, 2018–2025 (USD MILLION)
TABLE 71 FRANCE: MARKET IN AVIATION, BY DEPLOYMENT TYPE, 2018–2025 (USD MILLION)
TABLE 72 FRANCE: MRO SOFTWARE MARKETS IN AVIATION, BY END USER, 2018–2025 (USD MILLION)
TABLE 73 SPAIN: MRO SOFTWARE INDUSTRY IN AVIATION, BY SOLUTION, 2018–2025 (USD MILLION)
TABLE 74 SPAIN: MARKETS IN AVIATION, BY FUNCTION, 2018–2025 (USD MILLION)
TABLE 75 SPAIN: MARKET IN AVIATION, BY DEPLOYMENT TYPE, 2018–2025 (USD MILLION)
TABLE 76 SPAIN: MRO SOFTWARE MARKETS IN AVIATION, BY END USER, 2018–2025 (USD MILLION)
TABLE 77 SWEDEN: MARKET IN AVIATION, BY SOLUTION, 2018–2025 (USD MILLION)
TABLE 78 SWEDEN: MARKET IN AVIATION, BY FUNCTION, 2018–2025 (USD MILLION)
TABLE 79 SWEDEN: MARKETS IN AVIATION, BY DEPLOYMENT TYPE, 2018–2025 (USD MILLION)
TABLE 80 SWEDEN: MRO SOFTWARE MARKETS IN AVIATION, BY END USER, 2018–2025 (USD MILLION)
TABLE 81 NETHERLANDS: MARKET IN AVIATION, BY SOLUTION, 2018–2025 (USD MILLION)
TABLE 82 NETHERLANDS: MRO SOFTWARE INDUSTRY IN AVIATION, BY FUNCTION, 2018–2025 (USD MILLION)
TABLE 83 NETHERLANDS: MARKET IN AVIATION, BY DEPLOYMENT TYPE, 2018–2025 (USD MILLION)
TABLE 84 NETHERLANDS: MARKET IN AVIATION, BY END USER, 2018–2025 (USD MILLION)
TABLE 85 REST OF EUROPE: MARKET IN AVIATION, BY SOLUTION, 2018–2025 (USD MILLION)
TABLE 86 REST OF EUROPE: MRO SOFTWARE INDUSTRY IN AVIATION, BY FUNCTION, 2018–2025 (USD MILLION)
TABLE 87 REST OF EUROPE: MRO SOFTWARE MARKET SIZE IN AVIATION, BY DEPLOYMENT TYPE, 2018–2025 (USD MILLION)
TABLE 88 REST OF EUROPE: MARKET IN AVIATION, BY END USER, 2018–2025 (USD MILLION)
TABLE 89 ASIA PACIFIC: MRO SOFTWARE MARKETS IN AVIATION, BY SOLUTION, 2018–2025 (USD MILLION)
TABLE 90 ASIA PACIFIC: MARKETS IN AVIATION, BY FUNCTION, 2018–2025 (USD MILLION)
TABLE 91 ASIA PACIFIC: MARKET IN AVIATION, BY FUNCTION, 2018–2025 (MILLION UNITS)
TABLE 92 ASIA PACIFIC: MARKET IN AVIATION, BY DEPLOYMENT TYPE, 2018–2025 (USD MILLION)
TABLE 93 ASIA PACIFIC: MRO SOFTWARE INDUSTRY IN AVIATION, BY DEPLOYMENT TYPE, 2018–2025 (MILLION UNITS)
TABLE 94 ASIA PACIFIC: MARKET IN AVIATION, BY END USER, 2018–2025 (USD MILLION)
TABLE 95 ASIA PACIFIC: MARKET IN AVIATION, BY END USER, 2018–2025 (MILLION UNITS)
TABLE 96 ASIA PACIFIC: MRO SOFTWARE MARKET IN AVIATION, BY COUNTRY, 2018–2025 (USD MILLION)
TABLE 97 ASIA PACIFIC: MARKET IN AVIATION, BY COUNTRY, 2018–2025 (MILLION UNITS)
TABLE 98 CHINA: MARKET IN AVIATION, BY SOLUTION, 2018–2025 (USD MILLION)
TABLE 99 CHINA: MRO SOFTWARE INDUSTRY IN AVIATION, BY FUNCTION, 2018–2025 (USD MILLION)
TABLE 100 CHINA: MARKET IN AVIATION, BY DEPLOYMENT TYPE, 2018–2025 (USD MILLION)
TABLE 101 CHINA: MARKET IN AVIATION, BY END USER, 2018–2025 (USD MILLION)
TABLE 102 JAPAN: MRO SOFTWARE MARKET IN AVIATION, BY SOLUTION, 2018–2025 (USD MILLION)
TABLE 103 JAPAN: MRO SOFTWARE INDUSTRY IN AVIATION, BY FUNCTION, 2018–2025 (USD MILLION)
TABLE 104 JAPAN: MARKET IN AVIATION, BY DEPLOYMENT TYPE, 2018–2025 (USD MILLION)
TABLE 105 JAPAN: MARKET IN AVIATION, BY END USER, 2018–2025 (USD MILLION)
TABLE 106 INDIA: MRO SOFTWARE INDUSTRY IN AVIATION, BY SOLUTION, 2018–2025 (USD MILLION)
TABLE 107 INDIA: MRO SOFTWARE MARKET SHARE IN AVIATION, BY FUNCTION, 2018–2025 (USD MILLION)
TABLE 108 INDIA: MARKET IN AVIATION, BY DEPLOYMENT TYPE, 2018–2025 (USD MILLION)
TABLE 109 INDIA: MARKET IN AVIATION, BY END USER, 2018–2025 (USD MILLION)
TABLE 110 SINGAPORE: MARKET IN AVIATION, BY SOLUTION, 2018–2025 (USD MILLION)
TABLE 111 SINGAPORE: MARKET IN AVIATION, BY FUNCTION, 2018–2025 (USD MILLION)
TABLE 112 SINGAPORE: MRO SOFTWARE MARKET IN AVIATION, BY DEPLOYMENT TYPE, 2018–2025 (USD MILLION)
TABLE 113 SINGAPORE: MARKET IN AVIATION, BY END USER, 2018–2025 (USD MILLION)
TABLE 114 REST OF ASIA PACIFIC: MARKET IN AVIATION, BY SOLUTION, 2018–2025 (USD MILLION)
TABLE 115 REST OF ASIA PACIFIC: MARKET IN AVIATION, BY FUNCTION, 2018–2025 (USD MILLION)
TABLE 116 REST OF ASIA PACIFIC: MRO SOFTWARE INDUSTRY IN AVIATION, BY DEPLOYMENT TYPE, 2020–2025 (USD MILLION)
TABLE 117 REST OF ASIA PACIFIC: MRO SOFTWARE MARKET IN AVIATION, BY END USER, 2020–2025 (USD MILLION)
TABLE 118 REST OF THE WORLD: MARKET IN AVIATION, BY SOLUTION, 2018–2025 (USD MILLION)
TABLE 119 REST OF THE WORLD: MARKET IN AVIATION, BY FUNCTION, 2018–2025 (USD MILLION)
TABLE 120 REST OF THE WORLD: MARKET IN AVIATION, BY FUNCTION, 2018–2025 (MILLION UNITS)
TABLE 121 REST OF THE WORLD SIMULATORS: MARKET, BY DEPLOYMENT TYPE, 2018–2025 (USD MILLION)
TABLE 122 REST OF THE WORLD SIMULATORS: MARKET, BY DEPLOYMENT TYPE, 2018–2025 (MILLION UNITS)
TABLE 123 REST OF THE WORLD: MARKET IN AVIATION, BY END USER, 2018–2025 (USD MILLION)
TABLE 124 REST OF THE WORLD MRO SOFTWARE MARKETS IN AVIATION, BY END USER, 2018–2025 (MILLION UNITS)
TABLE 125 REST OF THE WORLD MRO SOFTWARE INDUSTRY IN AVIATION, BY REGION, 2018–2025 (USD MILLION)
TABLE 126 REST OF THE WORLD MRO SOFTWARE MARKET IN AVIATION, BY REGION, 2018–2025 (MILLION UNITS)
TABLE 127 LATIN AMERICA: MARKETS IN AVIATION, BY SOLUTION, 2018–2025 (USD MILLION)
TABLE 128 LATIN AMERICA: MARKET IN AVIATION, BY FUNCTION, 2018–2025 (USD MILLION)
TABLE 129 LATIN AMERICA: MARKET SIZE IN AVIATION, BY DEPLOYMENT TYPE, 2018–2025 (USD MILLION)
TABLE 130 LATIN AMERICA: MRO SOFTWARE MARKETS IN AVIATION, BY END USER, 2018–2025 (USD MILLION)
TABLE 131 MIDDLE EAST: MRO SOFTWARE INDUSTRY IN AVIATION, BY SOLUTION, 2018–2025 (USD MILLION)
TABLE 132 MIDDLE EAST: MARKET IN AVIATION, BY FUNCTION, 2018–2025 (USD MILLION)
TABLE 133 MIDDLE EAST: MARKET IN AVIATION, BY DEPLOYMENT TYPE, 2018–2025 (USD MILLION)
TABLE 134 MIDDLE EAST: MRO SOFTWARE MARKETS IN AVIATION, BY END USER, 2018–2025 (USD MILLION)
TABLE 135 AFRICA: MRO SOFTWARE INDUSTRY IN AVIATION, BY SOLUTION, 2018–2025 (USD MILLION)
TABLE 136 AFRICA: MARKET IN AVIATION, BY FUNCTION, 2018–2025 (USD MILLION)
TABLE 137 AFRICA: MARKET IN AVIATION, BY DEPLOYMENT TYPE, 2018–2025 (USD MILLION)
TABLE 138 AFRICA: MRO SOFTWARE MARKET IN AVIATION, BY END USER, 2018–2025 (USD MILLION)
TABLE 139 NEW PRODUCT LAUNCHES, 2016–2020
TABLE 140 CONTRACTS, 2016–2020
TABLE 141 OTHER DEVELOPMENTS, 2016–2020
TABLE 142 RAMCO SYSTEMS: SWOT ANALYSIS
LIST OF FIGURES (37 FIGURES)
FIGURE 1 MRO SOFTWARE MARKET IN AVIATION SEGMENTATION
FIGURE 2 RESEARCH PROCESS FLOW
FIGURE 3 RESEARCH DESIGN
FIGURE 4 MARKET SIZE ESTIMATION METHODOLOGY: APPROACH 1—BOTTOM-UP (DEMAND SIDE)
FIGURE 5 MARKET SIZE ESTIMATION METHODOLOGY: APPROACH 2—TOP-DOWN (SUPPLY SIDE)
FIGURE 6 MARKET SIZE ESTIMATION METHODOLOGY: TOP-DOWN APPROACH
FIGURE 7 DATA TRIANGULATION
FIGURE 8 ASSUMPTIONS FOR THE RESEARCH STUDY
FIGURE 9 ON-PREMISES SEGMENT TO ACCOUNT FOR LARGER SHARE OF MRO SOFTWARE MARKET IN AVIATION IN 2020 AS COMPARED TO CLOUD SEGMENT
FIGURE 10 MAINTENANCE MANAGEMENT SEGMENT TO REGISTER HIGHEST GROWTH RATE DURING FORECAST PERIOD
FIGURE 11 SOFTWARE SEGMENT TO LEAD MRO SOFTWARE MARKET IN AVIATION IN 2020
FIGURE 12 DEMAND FOR REDUCTION IN TURNAROUND TIME OF MRO OPERATIONS IS ONE KEY FACTOR ANTICIPATED TO DRIVE GROWTH OF MRO SOFTWARE MARKET IN AVIATION FROM 2020 TO 2025
FIGURE 13 SOFTWARE SEGMENT EXPECTED TO ACCOUNT FOR LARGER SHARE OF MRO SOFTWARE MARKET IN AVIATION AS COMPARED WITH SERVICES SEGMENT DURING FORECAST PERIOD
FIGURE 14 MAINTENANCE MANAGEMENT SEGMENT PROJECTED TO LEAD MRO SOFTWARE INDUSTRY IN AVIATION DURING FORECAST PERIOD
FIGURE 15 MRO SOFTWARE MARKET IN AVIATION EXPECTED TO GROW AT HIGHEST CAGR IN ASIA PACIFIC DURING FORECAST PERIOD
FIGURE 16 MARKET DYNAMICS: DRIVERS, RESTRAINTS, OPPORTUNITIES, AND CHALLENGES
FIGURE 17 ACTIVE CONNECTED AIRCRAFT FLEET, 2018
FIGURE 18 SOFTWARE SEGMENT EXPECTED TO LEAD MRO SOFTWARE MARKET IN AVIATION DURING FORECAST PERIOD
FIGURE 19 ON-PREMISES SEGMENT EXPECTED TO LEAD DURING FORECAST PERIOD
FIGURE 20 SUBSCRIPTION MODEL SEGMENT EXPECTED TO LEAD MRO SOFTWARE MARKET IN AVIATION FROM 2020 TO 2025
FIGURE 21 MAINTENANCE MANAGEMENT SEGMENT PROJECTED TO LEAD MRO SOFTWARE INDUSTRY IN AVIATION DURING FORECAST PERIOD
FIGURE 22 OPERATORS SEGMENT EXPECTED TO LEAD DURING FORECAST PERIOD
FIGURE 23 MRO SOFTWARE INDUSTRY IN CHINA PROJECTED TO GROW AT HIGHEST RATE FROM 2020 TO 2025
FIGURE 24 NORTH AMERICA MRO SOFTWARE MARKET IN AVIATION SNAPSHOT
FIGURE 25 EUROPE MRO SOFTWARE MARKET SIZE IN AVIATION SNAPSHOT
FIGURE 26 ASIA PACIFIC MRO SOFTWARE MARKET IN AVIATION SNAPSHOT
FIGURE 27 KEY DEVELOPMENTS BY LEADING PLAYERS IN MRO SOFTWARE MARKET IN AVIATION BETWEEN 2016 AND 2020
FIGURE 28 MRO SOFTWARE MARKET IN AVIATION: COMPETITIVE LEADERSHIP MAPPING, 2019
FIGURE 29 MARKET RANKING OF TOP PLAYERS IN MRO SOFTWARE INDUSTRY IN AVIATION, 2019
FIGURE 30 HCL TECHNOLOGIES LIMITED: COMPANY SNAPSHOT
FIGURE 31 BOEING: COMPANY SNAPSHOT
FIGURE 32 SAP SE: COMPANY SNAPSHOT
FIGURE 33 IBM: COMPANY SNAPSHOT
FIGURE 34 RAMCO SYSTEMS LIMITED: COMPANY SNAPSHOT
FIGURE 35 ORACLE: COMPANY SNAPSHOT
FIGURE 36 SOPRA STERIA: COMPANY SNAPSHOT
FIGURE 37 LUFTHANSA TECHNIK AG: COMPANY SNAPSHOT
The study considered various activities to estimate the market size for autonomous last mile delivery market. Exhaustive secondary research was undertaken to collect information on the market, the peer market, and the parent market. The next step was to validate these findings, assumptions, and sizing with industry experts across the value chain through primary research. Both, top-down and bottom-up approaches were employed to estimate the total market size. Thereafter, market breakdown and data triangulation procedures were used to estimate the market size of segments and subsegments.
Secondary Research
In the secondary research process, various secondary sources, such as Hoovers, Bloomberg, BusinessWeek, and Drone Journals & Magazines have been referred to identify and collect information for this study. Secondary sources included annual reports, press releases & investor presentations of companies, white papers, certified publications, articles by recognized authors, regulatory bodies, trade directories, and databases.
Primary Research
The autonomous last mile delivery market comprises several stakeholders, such as raw material suppliers, processors, and regulatory organizations in the supply chain. The demand side of this market is characterized by various end users, such as retail & food delivery, logistics & transportation, and healthcare & pharmacy, among others. The supply side is characterized by significant technological advancements in last mile delivery drones. Various primary sources from both, the supply and demand sides of the market were interviewed to obtain qualitative and quantitative information. Following is the breakdown of primary respondents—
To know about the assumptions considered for the study, download the pdf brochure
Market Size Estimation
Both, top-down and bottom-up approaches were used to estimate and validate the total size of the autonomous last mile delivery market. These methods were also used extensively to estimate the sizes of various subsegments in the market. The research methodology used to estimate the market size included the following:
- Key players in the market were identified through secondary research, and their market ranking determined through primary and secondary research. This included a study of annual and financial reports of the top market players and extensive interviews of leaders, including CEOs, directors, and marketing executives.
- All percentage shares, splits, and breakdowns were determined using secondary sources and verified through primary sources.
- All possible parameters that affect the markets covered in this research study were accounted for, viewed in extensive detail, verified through primary research, and analyzed to obtain the final quantitative and qualitative data. This data was consolidated, enhanced with detailed inputs, and analyzed by MarketsandMarkets and presented in this report.
Data Triangulation
After arriving at the overall market size—using the market size estimation processes explained above—the market was split into several segments and subsegments. In order to complete the overall market engineering process and arrive at the exact statistics of each market segment and subsegment, data triangulation and market breakdown procedures were employed, wherever applicable. The data was triangulated by studying various factors and trends from both, the demand and supply sides in the aerial delivery drones and ground delivery vehicles market.
Report Objectives
- To define, segment, and project the global market size for autonomous last mile delivery
- To understand the structure of the autonomous last mile delivery market by identifying the subsegments
- To provide detailed information about the key factors influencing the growth of the market (drivers, restraints, opportunities, and industry-specific challenges)
- To analyze micromarkets with respect to individual growth trends, future prospects, and their contribution to the total market
- To project the size of the market and its submarkets, in terms of value, with respect to the 6 regions (along with their respective key countries)
- To profile key players and comprehensively analyze their core competencies
- To understand the competitive landscape and identify major growth strategies adopted by players across key regions
- To analyze competitive developments, such as contracts, agreements, acquisitions & partnerships, and new product launches, developments, and product testing in the autonomous last mile delivery market
Available Customizations
With the given market data, MarketsandMarkets offers customizations according to the company’s specific needs.
Product Analysis
- Market analysis of a few countries in the Middle East and Latin American regions, subject to the availability of data
Company Information
- Detailed analysis and profiles of additional market players (up to 5)


Growth opportunities and latent adjacency in MRO Software Market
Requesting a sample report, specific to MRO software sales projections in the future. What is the cost of the full report? Name of the report: MRO and ERP Software Global forecast to 2022.