Back-end Revenue Cycle Management Market by Product and Services (Claim Processing, Denial Management, Payment Integrity), Delivery Mode (On-Premise, Cloud Based), End-User (Payer, Provider (Inpatient, Outpatient)), and Region - Global Forecasts to 2023


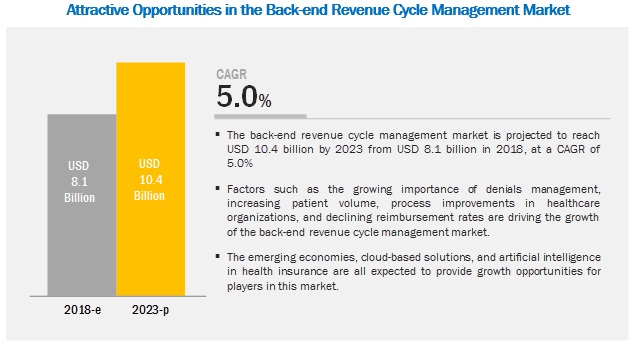
The back-end revenue cycle management market is projected to reach USD 10.4 billion by 2023, at a CAGR of 5.0%. Factors such as the growing importance of denials management, increasing patient volume, process improvements in healthcare organizations, and declining reimbursement rates are driving the growth of the market. However, the high cost of deployment, integration of back-end revenue cycle management solutions, data breaches and loss of confidentiality, and lack of skilled IT professionals in healthcare are expected to limit market growth to a certain extent in the coming years.
Back-end Revenue Cycle Management Market Dynamics
Growing importance of denials management
To reduce costs and maximize profits, insurance companies are increasingly denying claims as well as coverage to patients being treated for chronic or persistent illnesses. This is putting an extra burden on healthcare providers to manage operating costs, and in turn is supporting the adoption of back-end revenue cycle management solutions (with a growing number of healthcare providers focusing on properly analyzing denied claims and appealing them).
Many healthcare providers across the globe still use manual and paper-oriented approaches to manage denials. This results in errors, delayed follow-ups, and miscommunication between healthcare providers and insurance companies. The use of back-end revenue cycle management solutions over manual and paper-oriented approaches can not only help healthcare providers overcome these issues but also help them save significant costs. As a result, the demand for back-end revenue cycle management solutions is expected to increase among end users during the forecast period.
High cost of deployment
Back-end revenue cycle management solutions are fairly high-priced, and the maintenance and software update costs of these tools may be greater than the actual price of the software. Support and maintenance services, which include software upgrades, represent a recurring expenditure amounting to around 30% of the total cost of ownership. Moreover, a lack of internal IT expertise in the healthcare industry necessitates training for end users to maximize the efficiency of back-end revenue cycle management solutions, thereby adding to the cost of ownership.
Hospitals often prefer investing in core technologies directly linked to the quality of care for patients than on investing in technologies for allied departments. Thus, the high cost of deployment and maintenance and the low inclination on spending on non-core technologies is restricting the adoption of back-end revenue cycle management solutions, especially among smaller healthcare organizations. This trend is more evident in emerging markets across Asia and Latin America.
Emerging countries
In Asia and Australasia, the rollout of public healthcare programs, combined with the growing consumer wealth, is expected to boost healthcare spending at an average of 8.1% from 2014 to 2018 (Source: The Economist Intelligence Unit). Government initiatives for the implementation of HCIT solutions and rising government spending on healthcare systems are the major factors favoring the adoption of back-end revenue cycle management solutions in several emerging countries across the Asia Pacific region.
Mentioned below is an indicative list of pointers that showcase the potential of the Asia Pacific back-end revenue cycle management solutions market:
- The percentage of primary care physicians adopting EMR in Australia (92%) exceeded the adoption rate in the US (84%) (Source: OECD, 2015 International Profiles of Health Care Systems).
- China’s 13th Five-Year Plan (FYP), initiated in November 2015, focuses on changes in the areas of healthcare services. Government healthcare spending in China increased from 15% in 1999 to 30% in 2013, and out-of-pocket spending dropped from 60% to 34%. Also, in China, IT is being leveraged to revolutionize healthcare, drug development, and distribution. The use of mobile health technologies (mHealth) is also increasing in China to improve connectivity with rural/remote areas. Additionally, the “Big Three” Chinese internet and e-commerce companies (Baidu, Alibaba, and Tencent) are also investing in the healthcare industry (Source: China’s Healthcare Sector and US-China Health Cooperation, Council on Foreign Relations).
- The Indian Government started the Digital India campaign in 2015 to ensure that government services are made available to citizens electronically by improving IT infrastructure and improving internet connectivity. These factors are likely to encourage the adoption of healthcare IT solutions among hospitals in the country.
- Government initiatives in Japan, such as the e-Japan policy, the New IT Reform Strategy, and the iJapan Strategy 2015, are expected to encourage the adoption of back-end revenue cycle management solutions driven by the enhanced penetration of claim management solutions in hospitals.
Rapid growth in healthcare spending is expected in the Middle East and Africa, with an annual average increase of 8.7% from 2014 to 2018 (Source: The Economist Intelligence Unit, May 2014). Also, healthcare spending in Latin America is projected to increase at an average of 4.6% per annum from 2014 to 2018 (Source: World Health Organization). With the growth in healthcare spending, the healthcare infrastructure (including the HCIT infrastructure) in several countries across the Middle East, Africa, and Latin America is expected to improve in the coming years. This, in turn, is expected to provide significant growth opportunities to players operating in the back-end revenue cycle management market in the coming years.
Integration of back-end revenue cycle management solutions
The information-intensive nature of data in the healthcare industry has highlighted a need for integration at all levels to ensure that data is collated and compiled into a single exhaustive and accurate patient record. This also applies to back-end revenue cycle management solutions due to the need to maintain end-to-end records—from registration and appointment scheduling to final payment. However, integrating a new back-end revenue cycle management solution with a healthcare organization’s legacy information management systems is a difficult task for market players. This is because of the differences in data communication standards, owing to which a number of information systems are unable to exchange data. Issues related to effective integration are thus a major challenge limiting the successful utilization of back-end revenue cycle management solutions.
By product & service, the services segment is expected grow at the highest rate during the forecast period
On the basis of product & service, the market is segmented into software and services. The services segment is estimated to witness the highest CAGR during 2018–2023. The high growth of this segment is primarily due to the recurring nature of services such as training and development, installation, software upgrades, consulting, and maintenance.
By software type, the integrated software segment is expected to grow at the highest rate during the forecast period
By software, the market is broadly segmented into integrated and standalone software. In 2018, the integrated software segment is expected to account for the largest share of the market. The large share of this segment can be attributed to the ability of integrated solutions to help users to streamline and coordinate multiple financial functions through a single platform.
By end user, healthcare payers are expected to be the largest contributors to the market
By end user, the market is segmented into healthcare payers and healthcare providers. In 2018, the healthcare payers segment is expected to account for the largest share of the market. Insurance providers need to comply with various federal and regional laws and regulations. Many of these regulations have privacy and security concerns relating to patient information and strict auditing and reporting requirements. With the help of back-end revenue cycle management solutions, insurance providers adhere to regulatory requirements and reduce unnecessary penalties and punishments. The growing stringency of regulations for payers is thus driving the adoption of back-end revenue cycle management by healthcare payers.
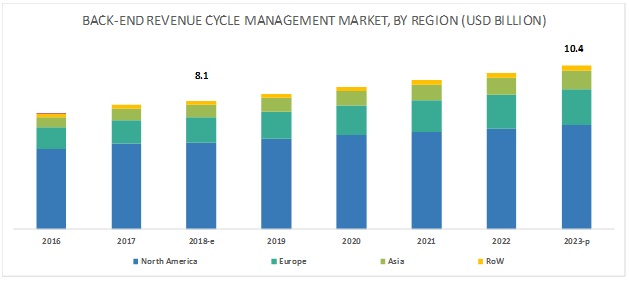
North America is expected to hold a significant share in the back-end revenue cycle management market during the forecast period
Geographically, the North American market is expected to account for the largest share of the market in 2018. The large share of North America in the market can be attributed to factors such as growing HCIT investments in the region, the presence of regulatory mandates supporting market growth in the US, and increasing digitalization and favorable funding initiatives by the Canadian government.
Key Market Players
athenahealth (US), Cerner Corporation (US), Allscripts Healthcare Solutions, Inc. (US), eClinicalWorks (US), Optum, Inc. (US), McKesson Corporation (US), Conifer Health Solutions (US), GeBBs Healthcare Solutions (US), The SSI Group (US), GE Healthcare (US), nThrive (US), DST Systems (US), Cognizant Technology Solutions (US), and Quest Diagnostics (US) are the key players in the market.
McKesson is one of the major players in the market. To sustain its leading position in the market, the company focuses on deploying products in various hospitals and institutes. In line with this, during 2016–2017, the company deployed its products at various healthcare organizations in the US, some of which include Oregon Advanced Imaging (US), Emergency Recovery (US), and the Orthopedic Institute of Wisconsin (OIW) (US).
Optum provides a variety of back-end revenue cycle management solutions and facilitates the complete lifecycle of claims processing, eliminating multiple systems and inefficient processes. The company focuses on partnerships and product deployments to enhance its presence in the market. The OptumInsight segment helps healthcare payers and providers to improve performance; achieve efficiency; reduce costs; advance quality; and meet the compliance mandates of hospital systems, physicians, health plans, governments, life science companies, and other organizations.
Get online access to the report on the World's First Market Intelligence Cloud
- Easy to Download Historical Data & Forecast Numbers
- Company Analysis Dashboard for high growth potential opportunities
- Research Analyst Access for customization & queries
- Competitor Analysis with Interactive dashboard
- Latest News, Updates & Trend analysis
Request Sample Scope of the Report
Get online access to the report on the World's First Market Intelligence Cloud
- Easy to Download Historical Data & Forecast Numbers
- Company Analysis Dashboard for high growth potential opportunities
- Research Analyst Access for customization & queries
- Competitor Analysis with Interactive dashboard
- Latest News, Updates & Trend analysis

|
Report Metric |
Details |
|
Market Size Available for Years |
2016–2023 |
|
Base Year Considered |
2017 |
|
Forecast Period |
2018–2023 |
|
Forecast Units |
Value (USD) |
|
Segments Covered |
Product & Service, Delivery Mode, End User, and Region |
|
Geographies Covered |
North America (US & Canada), Europe, Asia, RoW |
|
Companies Covered |
Athenahealth (US), Cerner Corporation (US), McKesson Corporation (US). Major 10 players covered. |
This research report categorizes the market based on product & service, delivery mode, end user, and region.
On the basis of Product & service, the back-end revenue cycle management market has been segmented as follows:
- Services
-
Software
- Integrated Software
-
Standalone Software
- Claims Processing Software
- Denial Management Software
- Coding & Auditing Software
- Billing/Billing Review Software
- Payment Integrity Software
On the basis of Delivery Mode, the back-end revenue cycle management market has been segmented as follows:
- On-premise Delivery Mode
- Cloud-based Delivery Mode
On the basis of End User, the back-end revenue cycle management market has been segmented as follows:
- Healthcare Payers
-
Healthcare Providers
- Inpatient Facilities
- Outpatient Facilities & Physician Clinics
On the basis of Region, the back-end revenue cycle management market has been segmented as follows:
-
North America
- US
- Canada
- Europe
- Asia
- Rest of the World (RoW)
Critical questions the report answers:
- Where will all these developments take the industry in the mid to long term?
- What are the upcoming back-end revenue cycle management software solutions?
- Which of the product segments will dominate the market in the future?
- Emerging countries have immense opportunities for the growth and adoption of back-end revenue cycle management solutions. Will this scenario continue in the next five years?
- Where will all the advancements in products offered by various companies take the industry in the mid to long term?
To speak to our analyst for a discussion on the above findings, click Speak to Analyst
Table of Contents
1 Introduction (Page No. - 15)
1.1 Objectives of the Study
1.2 Market Definition
1.3 Market Scope
1.3.1 Markets Covered
1.3.2 Years Considered for the Study
1.4 Currency
1.5 Limitations
1.6 Stakeholders
2 Research Methodology (Page No. - 18)
2.1 Research Data
2.1.1 Secondary Data
2.1.1.1 Secondary Sources
2.1.2 Primary Data
2.1.2.1 Key Data From Primary Sources
2.1.2.2 Breakdown of Primaries
2.1.2.3 Key Industry Insights
2.2 Market Size Estimation
2.3 Market Breakdown and Data Triangulation
2.4 Assumptions for the Study
3 Executive Summary (Page No. - 28)
4 Premium Insights (Page No. - 31)
4.1 Market Overview
4.2 Geographic Analysis: North American Market, By End User
4.3 US Market, 2018
4.4 Geographical Snapshot of the Market
5 Market Overview (Page No. - 35)
5.1 Introduction
5.2 Market Dynamics
5.2.1 Market Drivers
5.2.1.1 Growing Importance of Denials Management
5.2.1.2 Increasing Patient Volume
5.2.1.3 Process Improvements in Healthcare Organizations
5.2.1.4 Declining Reimbursement Rates
5.2.2 Market Restraints
5.2.2.1 High Cost of Deployment
5.2.3 Market Opportunities
5.2.3.1 Emerging Countries
5.2.3.2 Cloud-Based Solutions
5.2.3.3 Artificial Intelligence in Health Insurance
5.2.3.4 Rising Adoption of Electronic Health Records
5.2.4 Market Challenges
5.2.4.1 Integration of Back-end Revenue Cycle Management Solutions
5.2.4.2 Data Breaches and Loss of Confidentiality
5.2.4.3 Lack of Skilled It Professionals in Healthcare
6 Market, By Product & Service (Page No. - 41)
6.1 Introduction
6.2 Services
6.2.1 Recurring Nature of Services to Drive Market Growth
6.3 Software
6.3.1 Integrated Software
6.3.1.1 Integrated Solutions Help Users to Streamline and Coordinate Multiple Financial Functions Through A Single Platform
6.3.2 Standalone Software
6.3.2.1 Claims Processing Software
6.3.2.1.1 Claims Processing Software to Account for the Largest Share of the Standalone Software Market in 2018
6.3.2.2 Denial Management Software
6.3.2.2.1 Denial Management Software Segment to Witness the Highest Growth Rate During the Forecast Period
6.3.2.3 Coding & Auditing Software
6.3.2.3.1 Mandate to Convert From Icd-9 Classifications to the New Icd-10 Version has Resulted in the Increased Demand for Coding & Auditing Software
6.3.2.4 Billing/Billing Review Software
6.3.2.4.1 Rising Number of Billing Errors to Drive the Adoption of Billing/Billing Review Software
6.3.2.5 Payment Integrity Software
6.3.2.5.1 Payment Integrity Software Provides Advanced Analytics for Assessing Payment Compliance at A Granular Level
7 Market, By Delivery Mode (Page No. - 53)
7.1 Introduction
7.2 On-Premise Delivery Mode
7.2.1 Benefits Offered By On-Premise Delivery Models and Limited Penetration of Cloud-Based Technologies to Drive Market Growth
7.3 Cloud-Based Delivery Mode
7.3.1 Open-Access Nature of Cloud-Based Models Poses Security Challenges
8 Market, By End User (Page No. - 58)
8.1 Introduction
8.2 Healthcare Payers
8.2.1 Need to Ensure Regulatory Compliance is Aiding the Growth of the Payers Market
8.3 Healthcare Providers
8.3.1 Inpatient Facilities
8.3.1.1 Growing Need to Improve the Profitability of Healthcare Operations to Drive the Adoption of Back-End Rcm Solutions in Inpatient Facilities
8.3.2 Outpatient Facilities & Physician Clinics
8.3.2.1 Need to Improve Operational Workflows and Minimize Medical Errors to Drive Market Growth
9 Market, By Region (Page No. - 65)
9.1 Introduction
9.2 North America
9.2.1 US
9.2.1.1 Government Regulations to Support Market Growth in the US
9.2.2 Canada
9.2.2.1 Increasing Digitization and Favorable Funding Initiatives By the Canadian Government are Boosting Market Growth in Canada
9.3 Europe
9.4 Asia
9.5 Rest of the World
10 Competitive Landscape (Page No. - 93)
10.1 Overview
10.2 Competitive Scenario
10.2.1 Product Launches and Enhancements
10.2.2 Agreements, Partnerships, and Collaborations
10.2.3 Acquisitions
10.2.4 Expansions
11 Company Profile (Page No. - 97)
(Business Overview, Products Offered, Recent Developments, SWOT Analysis, MnM View)*
11.1 Athenahealth
11.2 Cerner
11.3 Allscripts Healthcare Solutions
11.4 Eclinicalworks
11.5 Optum, Inc. (A Subsidiary of Unitedhealth Group Inc.)
11.6 Mckesson (Now A Part of Change Healthcare, Inc.)
11.7 Conifer Health Solutions
11.8 Gebbs Healthcare Solutions
11.9 The SSI Group
11.10 GE Healthcare
11.11 Nthrive
11.12 DST Systems
11.13 Cognizant Technology Solutions
11.14 Quest Diagnostics
11.15 Context 4 Healthcare
11.16 Ram Technologies
11.17 Health Solutions Plus (HSP)
11.18 Plexis Healthcare Systems
*Details on Business Overview, Products Offered, Recent Developments, SWOT Analysis, MnM View Might Not Be Captured in Case of Unlisted Companies.
12 Appendix (Page No. - 129)
12.1 Discussion Guide
12.2 Knowledge Store: Marketsandmarkets’ Subscription Portal
12.3 Available Customizations
12.4 Related Reports
12.5 Author Details
List of Tables (79 Tables)
Table 1 Market, By Product & Service, 2016–2023 (USD Million)
Table 2 Back-end Revenue Cycle Management Services Market, By Region, 2016–2023 (USD Million)
Table 3 North America: Back-end Revenue Cycle Management Services Market, By Country, 2016–2023 (USD Million)
Table 4 Back-end Revenue Cycle Management Software Market, By Region, 2016–2023 (USD Million)
Table 5 North America: Back-end Revenue Cycle Management Software Market, By Country, 2016–2023 (USD Million)
Table 6 Back-end Revenue Cycle Management Software Market, By Type, 2016–2023 (USD Million)
Table 7 Back-end Revenue Cycle Management Integrated Software Market, By Region, 2016–2023 (USD Million)
Table 8 North America: Back-end Revenue Cycle Management Integrated Software Market, By Country, 2016–2023 (USD Million)
Table 9 Back-end Revenue Cycle Management Standalone Software Market, By Region, 2016–2023 (USD Million)
Table 10 North America: Back-end Revenue Cycle Management Standalone Software Market, By Country, 2016–2023 (USD Million)
Table 11 Back-end Revenue Cycle Management Standalone Software Market, By Type, 2016–2023 (USD Million)
Table 12 Claims Processing Software Market, By Region, 2016–2023 (USD Million)
Table 13 North America: Claims Processing Software Market, By Country, 2016–2023 (USD Million)
Table 14 Denial Management Software Market, By Region, 2016–2023 (USD Million)
Table 15 North America: Denial Management Software Market, By Country, 2016–2023 (USD Million)
Table 16 Coding & Auditing Software Market, By Region, 2016–2023 (USD Million)
Table 17 North America: Coding & Auditing Software Market, By Country, 2016–2023 (USD Million)
Table 18 Billing/Billing Review Software Market, By Region, 2016–2023 (USD Million)
Table 19 North America: Billing/Billing Review Software Market, By Country, 2016–2023 (USD Million)
Table 20 Payment Integrity Software Market, By Region, 2016–2023 (USD Million)
Table 21 North America: Payment Integrity Software Market, By Country, 2016–2023 (USD Million)
Table 22 Market, By Delivery Mode, 2016–2023 (USD Million)
Table 23 On-Premise Market, By Region, 2016–2023 (USD Million)
Table 24 North America: On-Premise Market, By Country, 2016–2023 (USD Million)
Table 25 Cloud-Based Market, By Region, 2016–2023 (USD Million)
Table 26 North America: Cloud-Based Market, By Country, 2016–2023 (USD Million)
Table 27 Market, By End User, 2016–2023 (USD Million)
Table 28 Market for Healthcare Payers, By Region, 2016–2023 (USD Million)
Table 29 North America: e Management Market for Healthcare Payers, By Country, 2016–2023 (USD Million)
Table 30 Market for Healthcare Providers, By Region, 2016–2023 (USD Million)
Table 31 North America: Market for Healthcare Providers, By Country, 2016–2023 (USD Million)
Table 32 Market for Healthcare Providers, By Type, 2016–2023 (USD Million)
Table 33 Market for Inpatient Facilities, By Region, 2016–2023 (USD Million)
Table 34 North America: Market for Inpatient Facilities, By Country, 2016–2023 (USD Million)
Table 35 Market for Outpatient Facilities & Physician Clinics, By Region, 2016–2023 (USD Million)
Table 36 North America: Market for Outpatient Facilities & Physician Clinics, By Country, 2016–2023 (USD Million) 64
Table 37 Market, By Region, 2016–2023 (USD Million)
Table 38 North America: Market, By Country, 2016–2023 (USD Million)
Table 39 North America: Market, By Product & Service, 2016–2023 (USD Million)
Table 40 North America: Back-end Revenue Cycle Management Software Market, By Type, 2016–2023 (USD Million)
Table 41 North America: Back-end Revenue Cycle Management Standalone Software Market, By Type, 2016–2023 (USD Million)
Table 42 North America: Market, By Delivery Mode, 2016–2023 (USD Million)
Table 43 North America: Market, By End User, 2016–2023 (USD Million)
Table 44 North America: Market for Healthcare Providers, By Type, 2016–2023 (USD Million)
Table 45 US: Market, By Product & Service, 2016–2023 (USD Million)
Table 46 Us: Back-end Revenue Cycle Management Software Market, By Type, 2016–2023 (USD Million)
Table 47 US: Back-end Revenue Cycle Management Standalone Software Market, By Type, 2016–2023 (USD Million)
Table 48 US: Market, By Delivery Mode, 2016–2023 (USD Million)
Table 49 US: Market, By End User, 2016–2023 (USD Million)
Table 50 US: Market for Healthcare Providers, By Type, 2016–2023 (USD Million)
Table 51 Canada: Market, By Product & Service, 2016–2023 (USD Million)
Table 52 Canada: Back-end Revenue Cycle Management Software Market, By Type, 2016–2023 (USD Million)
Table 53 Canada: Back-end Revenue Cycle Management Standalone Software Market, By Type, 2016–2023 (USD Million)
Table 54 Canada: Market, By Delivery Mode, 2016–2023 (USD Million)
Table 55 Canada: Market, By End User, 2016–2023 (USD Million)
Table 56 Canada: Market for Healthcare Providers, By Type, 2016–2023 (USD Million)
Table 57 Europe: Market, By Product & Service, 2016–2023 (USD Million)
Table 58 Europe: Back-end Revenue Cycle Management Software Market, By Type, 2016–2023 (USD Million)
Table 59 Europe: Back-end Revenue Cycle Management Standalone Software Market, By Type, 2016–2023 (USD Million)
Table 60 Europe: Market, By Delivery Mode, 2016–2023 (USD Million)
Table 61 Europe: Market, By End User, 2016–2023 (USD Million)
Table 62 Europe: Market for Healthcare Providers, By Type, 2016–2023 (USD Million)
Table 63 Asia: Market, By Product & Service, 2016–2023 (USD Million)
Table 64 Asia: Back-end Revenue Cycle Management Software Market, By Type, 2016–2023 (USD Million)
Table 65 Asia: Back-end Revenue Cycle Management Standalone Software Market, By Type, 2016–2023 (USD Million)
Table 66 Asia: Market, By Delivery Mode, 2016–2023 (USD Million)
Table 67 Asia: Market, By End User, 2016–2023 (USD Million)
Table 68 Asia: Market for Healthcare Providers, By Type, 2016–2023 (USD Million)
Table 69 RoW: Market, By Component, 2016–2023 (USD Million)
Table 70 RoW: Back-end Revenue Cycle Management Software Market, By Type, 2016–2023 (USD Million)
Table 71 RoW: Back-end Revenue Cycle Management Standalone Software Market, By Type, 2016–2023 (USD Million)
Table 72 RoW: Market, By Delivery Mode, 2016–2023 (USD Million)
Table 73 RoW: Market, By End User, 2016–2023 (USD Million)
Table 74 RoW: Market for Healthcare Providers, By Type, 2016–2023 (USD Million)
Table 75 Growth Strategy Matrix (2014–2018)
Table 76 Product Launches and Enhancements (2014–2018)
Table 77 Agreements, Partnerships, and Collaborations (2014–2018)
Table 78 Acquisitions, 2014–2018
Table 79 Expansions (2014–2018)
List of Figures (31 Figures)
Figure 1 Research Methodology:
Figure 2 Research Design
Figure 3 Sampling Frame: Primary Research
Figure 4 Market Size Estimation Methodology: Bottom-Up Approach (1/3)
Figure 5 Market Size Estimation Methodology: Bottom-Up Approach (2/3)
Figure 6 Market Size Estimation Methodology: Bottom-Up Approach (3/3)
Figure 7 Market Size Estimation Methodology: Top-Down Approach
Figure 8 Data Triangulation Methodology
Figure 9 Services to Dominate the Market, By Product & Service, in 2018
Figure 10 On-Premise Solutions to Account for the Larger Market Share in 2018
Figure 11 North America to Hold the Largest Share in the Market During 2018–2023
Figure 12 Growing Importance of Denials Management to Drive Market Growth During the Forecast Period
Figure 13 Healthcare Payers to Account for the Largest Share of the North American Market in 2018
Figure 14 Inpatient Settings & On-Premise Delivery Mode to Account for the Largest Market Share in 2018
Figure 15 Asia to Witness the Highest Growth Rate During the Forecast Period
Figure 16 Market: Drivers, Restraints, Opportunities, and Challenges
Figure 17 Market, By Region, 2018 Vs. 2023 (USD Million)
Figure 18 North America: Market Snapshot
Figure 19 Europe: Market Snapshot
Figure 20 Asia: Market Snapshot
Figure 21 RoW: Market Snapshot
Figure 22 Key Developments in the Market Between 2014 and 2018
Figure 23 Company Snapshot: Athenahealth (2017)
Figure 24 Company Snapshot: Cerner (2017)
Figure 25 Company Snapshot: Allscripts Healthcare Solutions (2017)
Figure 26 Company Snapshot: Optum, Inc. (2017)
Figure 27 Company Snapshot: Mckesson Corporation (2017)
Figure 28 Company Snapshot: GE Healthcare (2017)
Figure 29 Company Snapshot: DST Systems (2017)
Figure 30 Company Snapshot: Cognizant Technology Solutions (2017)
Figure 31 Company Snapshot: Quest Diagnostics Incorporated (2017)
The study involved four major activities to estimate the current market size for back-end revenue cycle management. Exhaustive secondary research was done to collect information on the market and its different subsegments. The next step was to validate these findings, assumptions, and sizing with industry experts across the value chain through primary research. Both top-down and bottom-up approaches were employed to estimate the complete market size. Thereafter, market breakdown and data triangulation procedures were used to estimate the market size of segments and subsegments.
Secondary Research
In the secondary research process, various secondary sources such as Hoovers, D&B, Bloomberg Business, and Factiva have been referred to so as to identify and collect information for this study. These secondary sources included annual reports, press releases & investor presentations of companies, white papers, certified publications, articles by recognized authors, gold-standard & silver-standard websites, regulatory bodies, and databases.
Primary Research
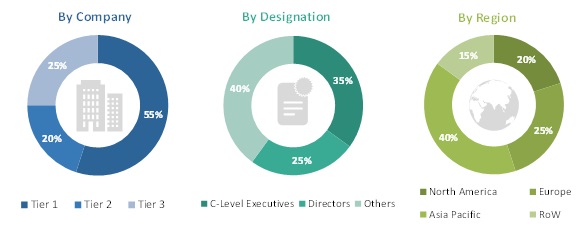
The market comprises several stakeholders such as healthcare insurance companies/payers, healthcare IT service providers, healthcare institutions/providers (hospitals, medical groups, physician practices, diagnostic centers, pharmacies, ambulatory centers, and outpatient clinics). Various primary sources from both the supply and demand sides of the market were interviewed to obtain qualitative and quantitative information. The following is a breakdown of the primary respondents:
To know about the assumptions considered for the study, download the pdf brochure
Market Size Estimation
Both top-down and bottom-up approaches were used to estimate and validate the total size of the market. These methods were also used extensively to estimate the size of various subsegments in the market. The research methodology used to estimate the market size includes the following:
- The key players in the industry and markets have been identified through extensive secondary research
- The industry’s supply chain and market size, in terms of value, have been determined through primary and secondary research processes
- All percentage shares, splits, and breakdowns have been determined using secondary sources and verified through primary sources
Data Triangulation
After arriving at the overall market size using the market size estimation processes as explained above the market was split into several segments and subsegments. In order to complete the overall market engineering process and arrive at the exact statistics of each market segment and subsegment, data triangulation and market breakdown procedures were employed, wherever applicable. The data was triangulated by studying various factors and trends from both the demand and supply sides in the back-end revenue cycle management industry.
Report Objectives
- To define, describe, and forecast the global market with respect to product & service, delivery mode, end user, and region
- To provide detailed information regarding the major factors influencing the growth of the market (drivers, restraints, opportunities, and challenges)
- To strategically analyze micromarkets with respect to individual growth trends, prospects, and contributions to the overall market
- To analyze market opportunities for stakeholders and provide details of the competitive landscape of market leaders
- To forecast the size of the market with respect to four main regions—North America, Europe, Asia Pacific, and the Rest of the World
- To profile the key players in the global market and comprehensively analyze their core competencies
- To track and analyze competitive developments such as agreements and partnerships, mergers, acquisitions, reprocessed medical device developments, and service launches of the leading players in the market
Available Customizations
With the given market data, MarketsandMarkets offers customizations as per the company’s specific needs. The following customization options are available for the report:
Geographic Analysis
- Further breakdown of the European and Asian markets
Company Information
- Detailed analysis and profiling of additional market players (up to 5)

 Generating Response ...


Growth opportunities and latent adjacency in Back-end Revenue Cycle Management Market
It manages the overall finance of the organization and keeps them going on a daily basis. Several organizations are involved in the process but offering revenue cycle management services is a responsible task and needs to be done with careful and utmost perfection.