Bag-in-Box Market by (Semi-liquid, Liquid), Capacity (<1 liter, 3-5 liters, 5-10 liters, 10-20 liters, >20 liters), Component (Bags, Boxes, Fitments), Tap (With tap, Without tap), End-use Sector ,Region � Global Forecast to 2024


Updated on : April 17, 2024
Bag-in-box Market
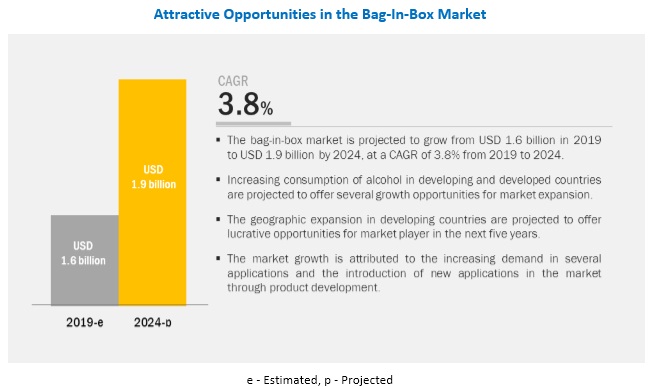
The global bag-in-box market was valued at USD 1.6 billion in 2019 and is projected to reach USD 1.9 billion by 2024, growing at 3.8% cagr from 2019 to 2024. The growth of this market is attributed to the need for innovative and sustainable packaging as well as the increase in the consumption of alcoholic beverages in developing and developed economies. Other factors driving the market include ease of handling and transportation of bag-in-box packaging, which has resulted in its use in e-commerce retail with the benefits of enhanced protection, leading to extended shelf life of the product.
In terms of value and volume, the 5–10 liters segment is projected to lead the bag-in-box market from 2019 to 2024.
Based on capacity, the 5–10 liters segment is projected to be a faster-growing market during the forecast period. The use of 5–10-liter bag-in-boxes in dispensing systems by beverage manufacturers, foodservice operators, and quick-serve restaurants has contributed to the significant growth of this segment. On the other hand, the < 1 liter segment is expected to grow at the highest CAGR during the forecast period, due to the increasing use of these bag-in-boxes for packaging wines and juices for consumer use.
In terms of value and volume, the beverage segment of the stucco market is projected to grow at the highest CAGR during the forecast period.
The beverage segment is the fastest-growing sector in the bag-in-box market. Factors such as increasing consumption of alcoholic beverages, the extended shelf life of the product, and the ease of handling and transporting are significantly contributing to the growth of this segment.
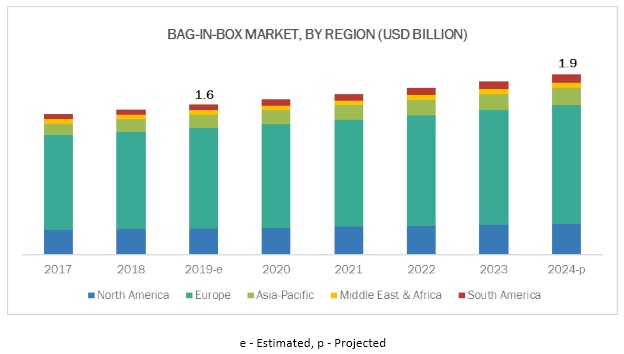
In terms of both value as well as volume, the European region is projected to account for the largest share in the global bag-in-box market during the forecast period.
The bag-in-box market is already well-established in Europe. Key factors encouraging the growth of the bag-in-boxes market in Europe include improving the global economy, expanding the working population, rising domestic demand for food products, and increasing consumption of alcohol. Moreover, the region has stringent norms for the usage of plastic and high sustainability standards, with the increasing focus on reducing packaging waste, which is also propelling the growth of the market in the region.
Bag-in-Box Market Players
Key players such as Smurfit Kappa (Ireland) and DS Smith PLC (UK) have adopted this strategy to strengthen their product portfolio and to meet & exceed their customers’ expectations in the bag-in-box market.
Smurfit Kappa is a leading company in Europe, producing corrugated packaging, bag-in-box and containerboards. They are also the only pan-American producer of containerboard and corrugated packaging. Smurfit Kappa has over 40 years of expertise in complete bag-in-box packaging solutions and is among the few providers of a complete bag-in-box packaging system. It provides clients with everything that is related to bag-in-box packaging, from films and accessories to bags, boxes, and taps. It also provides complete filling lines, which gives the clients the expertise throughout the process of packaging liquids in bag-in-box.
Bag-in-Box Market Report Scope
|
Report Metric |
Details |
|
Market size available for years |
2017–2024 |
|
Base year considered |
2018 |
|
Forecast period |
2019–2024 |
|
Forecast units |
Value (USD billion) and Volume (Million units) |
|
Segments covered |
|
|
Geographies covered |
|
|
Companies covered |
Twenty players have been covered in the study. Following are the key players in the market:
|
This research report categorizes the bag-in-box market based on material stat, components, capacity, tap, end-use sector, and region.
Bag-in-Box Market by Component
- Bags
- Boxes
- Fitments
Bag-in-Box Market by Capacity
- < 1 liter
- 3–5 liters
- 5–10 liters
- 10–20 liters
- > 20 liters
Bag-in-Box Market by Material State
- Semi-liquid
- Liquid
Bag-in-Box Market by Tab
- With Tap
- Without Tap
Bag-in-Box Market by End-Use Sector
- Food
- Beverage
- Industrial
- Others* (cosmetics & personal care and household)
Bag-in-Box Market by Region
- North America
- Europe
- Asia Pacific
- Middle East & Africa
- South America
Recent Developments
- In October 2019, Rapak increased the bag-in-box production capacity of its Auckland, New Zealand facility, in response to the growth in demand in the Asia Pacific. It is expected to increase its manufacturing output by over 125% in the upcoming years.
- In September 2019, the Rapak division of DS Smith PLC developed a durable bag-in-box solution for liquid detergents in response to the increase in the e-commerce demand of laundry detergents and other consumer packaged goods. This specially designed bag-in-box unit is comprised of biaxially-oriented nylon (BON) lamination, providing a good barrier and high puncture resistance.
- In March 2019, Liqui-Box Corp. agreed to acquire DS Smith’s (UK) plastic division. DS Smith is a leading provider of corrugated packaging worldwide. Its plastics division includes Rapak and Worldwide Dispensers business. This acquisition would provide a global footprint, design capabilities, and service platform that will offer customers the most compelling packaging solutions and drive advancements in technology and sustainability.
Key Questions Addressed by the Report:
- What are the global trends in the bag-in-box market? Would the market witness an increase or decline in demand in the coming years?
- What is the estimated demand for different capacities of bag-in-box packaging?
- Where will the strategic developments take the industry in the mid to long-term?
- What are the upcoming industry applications and trends for bag-in-box packaging?
- Who are the major players in the bag-in-box market globally?
Frequently Asked Questions (FAQ):
What are the factors influencing the growth of Bag-in-box packaging?
How is the bag-in-box market aligned?
What are the types of materials used for the manufacturing of bag-in-box packaging?
Who are the major manufacturers?
What are the major applications for bag-in-box?
What is the biggest restraint for bag-in-box packaging?
What are the factors contributing to the final price of bag-in-box packaging?
What are the opportunities for bag-in-box packaging?
How is bag-in-box more efficient than other types of packaging for liquids?
Why is bag-in-box useful for e-commerce retail packaging?
To speak to our analyst for a discussion on the above findings, click Speak to Analyst
Table of Contents
1 Introduction (Page No. - 18)
1.1 Objectives of the Study
1.2 Market Definition
1.2.1 Inclusions
1.2.2 Exclusions
1.3 Study Scope
1.3.1 Regional Scope
1.3.2 Years Considered for the Study
1.4 Currency Considered
1.5 Units Considered
1.6 Stakeholders
2 Research Methodology (Page No. - 23)
2.1 Research Data
2.2 Secondary Research: Supply Side Analysis
2.3 Primary and Secondary Research (Value Market)
2.4 Market Size Estimation
2.4.1 Bottom-Up Approach
2.4.2 Top-Down Approach
2.5 Secondary Data
2.5.1 Key Data From Secondary Sources
2.6 Primary Data
2.7 Research Assumptions & Limitations
2.7.1 Assumptions
2.7.2 Limitations
3 Executive Summary (Page No. - 28)
3.1 Introduction
4 Premium Insights (Page No. - 31)
4.1 Developing Countries to Record A Higher Growth in the Bag-In-Box Market During the Forecast Period
4.2 European Bag-In-Box Market, By End-Use Sector & Country
4.3 Bag-In-Box Market, By End-Use
4.4 Bag-In-Box Market, By Capacity From 2019 to 2024
4.5 Bag-In-Box Market, By Country
5 Market Overview (Page No. - 34)
5.1 Introduction
5.2 Market Dynamics
5.2.1 Drivers
5.2.1.1 Increasing Consumption of Alcoholic Beverages
5.2.1.2 Rise in Demand for Packaged Foods & Beverages
5.2.1.3 Need for Environmentally Safer and Sustainable Packaging
5.2.1.4 Brand Enhancement and Better Aesthetics on Shelf
5.2.2 Restraints
5.2.2.1 Availability of Cheaper Substitutes
5.2.2.2 Stringent Government Regulations
5.2.3 Opportunities
5.2.3.1 Development of New, Innovative Materials Giving Rise to New Applications
5.2.3.2 E-Commerce Retail Packaging
5.2.3.3 Penetration of Packaged Food Products in Asia
5.2.4 Challenges
5.2.4.1 High Cost of Production
5.2.4.2 Lack of Product Awareness in Many Emerging Economies
5.3 YC, YCC Drivers
6 Bag-In-Box Market, By Capacity (Page No. - 40)
6.1 Introduction
6.2 < 1 Liter
6.3 1–5 Liters
6.4 5–10 Liters
6.5 10–20 Liters
6.6 >20 Liters
7 Bag-In-Box Market, By Material State (Page No. - 43)
7.1 Introduction
7.2 Liquid
7.3 Semi-Liquid
8 Bag-In-Box Market, By Tap (Page No. - 45)
8.1 Introduction
8.2 With Tap
8.3 Without Tap
9 Bag-In-Box Market, By Component (Page No. - 47)
9.1 Introduction
9.2 Bags
9.3 Box
9.4 Fitments
10 Bag-In-Box Market, By End-Use Sector (Page No. - 49)
10.1 Introduction
10.2 Food
10.3 Dairy Products
10.4 Non-Dairy Products
10.5 Beverage
10.6 Industrial
10.7 Other End-Use Sectors
11 Bag-In-Box Market, By Region (Page No. - 53)
11.1 Introduction
11.2 Europe
11.2.1 Germany
11.2.1.1 <1 Liter to Be the Fastest-Growing Segment in the German Bag-In-Box Market
11.2.2 UK
11.2.2.1 The Increase in Food Exports and A Rise in Demand for Convenience Food Products to Drive the Market for Bag-In-Box in the UK
11.2.3 France
11.2.3.1 France to Be the Fastest-Growing Country in the European Bag-In-Box Market
11.2.4 Russia
11.2.4.1 Increase in Demand for Packaging Solutions in Food & Beverages to Drive the Demand for Bag-In-Box in Russia
11.2.5 Spain
11.2.5.1 Spain to Be the Fourth-Largest Market in Europe for Bag-In-Box
11.2.6 Rest of Europe
11.2.6.1 The Epoxy Segment is Projected to Record A Stagnant Growth in the Rest of Europe Market By 2024
11.3 North America
11.3.1 US
11.3.1.1 The US to Be the Largest Market for Bag-In-Box in North America
11.3.2 Canada
11.3.2.1 The Beverages Segment to Record the Highest CAGR, in Terms Value, in Canada
11.3.3 Mexico
11.3.3.1 Mexico to Be the Fastest-Growing Country for Bag-In-Box in North America
11.4 Asia Pacific
11.4.1 China
11.4.1.1 China to Be the Largest Market for the Bag-In-Box in Asia Pacific
11.4.2 Japan
11.4.2.1 Beverage to Be the Largest Segment in Japan’s Bag-In-Box Market, By 2024
11.4.3 India
11.4.3.1 India is Projected to Witness the Highest Growth in the Asia Pacific Market
11.4.4 Australia
11.4.4.1 The < 1 Liter Segment to Be the Fastest-Growing in the Australian Bag-In-Box Market
11.4.5 South Korea
11.4.5.1 South Korea to Be the Second-Fastest-Growing Market for Bag-In-Box in Asia Pacific
11.4.6 Rest of Asia Pacific
11.4.6.1 Rise in Consumption of Packed Food & Beverages to Drive the Bag-In-Box Market in Rest of Asia Pacific
11.5 Middle East & Africa
11.5.1 UAE
11.5.1.1 The UAE is Projected to Be the Second-Largest Country in the Middle East & Africa Bag-In-Box Market
11.5.2 Saudi Arabia
11.5.2.1 The 5–10 Liters Segment to Be the Largest Segment in the Saudi Arabian Bag-In-Box Market
11.5.3 South Africa
11.5.3.1 South Africa to Be the Fastest-Growing Country-Level Market for Bag-In-Box in the Middle East & Africa Region
11.5.4 Turkey
11.5.4.1 Turkey to Be the Largest Market for Bag-In-Box in the Middle East & Africa Region
11.5.5 Rest of Middle East & Africa
11.5.5.1 Food to Be the Fastest-Growing Segment in the Rest of Middle East & Africa Region, in Terms of Volume
11.6 South America
11.6.1 Brazil
11.6.1.1 Brazil to Account for the Largest Share in the South American Bag-In-Box Market
11.6.2 Argentina
11.6.2.1 Argentina to Be the Second-Fastest-Growing Market for Bag-In-Box in South America
11.6.3 Rest of South America
11.6.3.1 Beverages to Be the Largest Segment for Bag-In-Box in Rest of South America
12 Competitive Landscape (Page No. - 111)
12.1 Overview
12.2 Competitive Scenario
12.2.1 Expansions & Investments
12.2.2 New Product Developments
12.2.3 Mergers & Acquisitions
12.2.4 Partnerships
12.3 Microquadrant for Bag-In-Box Manufacturers
12.4 Bag-In-Box Market (Global) Competitive Leadership Mapping, 2018
12.4.1 Strength of Product Portfolio
12.4.2 Business Strategy Excellence
13 Company Profiles (Page No. - 124)
13.1 Smurfit Kappa
13.1.1 Business Overview
13.1.2 Financial Assessment
13.1.3 Operational Assessment
13.1.4 Products Offered
13.1.5 Recent Developments
13.1.6 SWOT Analysis
13.1.7 Current Focus and Strategies
13.1.8 Smurfit Kappa’s Right to Win
13.2 DS Smith PLC
13.2.1 Business Overview
13.2.2 Financial Assessment
13.2.3 Operational Assessment
13.2.4 Products Offered
13.2.5 Recent Developments
13.2.6 SWOT Analysis
13.2.7 Current Focus and Strategies
13.2.8 DS Smith PLC’s Right to Win
13.3 Liqui-Box Corp.
13.3.1 Business Overview
13.3.2 Operational Assessment
13.3.3 Products & Services Offered
13.3.4 Recent Developments
13.3.5 SWOT Analysis
13.3.6 Current Focus and Strategies
13.3.7 Liqui-Box’s Right to Win
13.4 Scholle Ipn Corp.
13.4.1 Business Overview
13.4.2 Operational Assessment
13.4.3 Products Offered
13.4.4 Recent Developments
13.4.5 SWOT Analysis
13.4.6 Scholle Ipn’s Right to Win
13.5 CDF Corporation
13.5.1 Business Overview
13.5.2 Products Offered
13.5.3 SWOT Analysis
13.5.4 CDF Corporation’s Right to Win
13.6 Aran Group
13.6.1 Business Overview
13.6.2 Products Offered
13.6.3 Recent Developments
13.6.4 Aran Group’s Right to Win
13.7 Fujimori Kogyo Ltd.
13.7.1 Business Overview
13.7.2 Products Offered
13.7.3 Fujimori Kogyo’s Right to Win
13.8 Goglio S.P.A
13.8.1 Business Overview
13.8.2 Operational Assessment
13.8.3 Products Offered
13.8.4 Goglio’s Right to Win
13.9 SLF Packaging
13.9.1 Business Overview
13.9.2 Products Offered
13.9.3 SLF Packaging Right to Win
13.10 Optopack Ltd.
13.10.1 Business Overview
13.10.2 Products Offered
13.10.3 Optopack’s Right to Win
13.11 Amcor Ltd.
13.11.1 Business Overview
13.11.2 Products Offered
13.11.3 Amcor’s Right to Win
14 Additional Company Profiles (Page No. - 154)
14.1 TPS Rental Systems
14.2 Arlington Packaging
14.3 Bernhardt Packaging
14.4 Vine Valley Ventures LLC (Astrapouch)
14.5 LGR Packaging
14.6 LD Packaging
14.7 Hearthside Food Solutions
14.8 Aspla-Platicos Espanoles S.A
14.9 Westrock Company
15 Appendix (Page No. - 158)
15.1 Discussion Guide
15.2 Knowledge Store: Marketsandmarkets’ Subscription Portal
15.3 Available Customizations
15.4 Related Reports
15.5 Author Details
List of Tables (136 Tables)
Table 1 Bag-In-Box Market Size, By Capacity, 2017–2024 (USD Million)
Table 2 Bag-In-Box Market Size, By Capacity, 2017–2024 (Million Unit)
Table 3 Bag-In-Box Market Size, By End-Use Sector, 2017–2024 (USD Million)
Table 4 Bag-In-Box Market Size, By End-Use Sector, 2017–2024 (Million Units)
Table 5 Bag-In-Box Market Size, By Region, 2017–2024 (USD Million)
Table 6 Bag-In-Box Market Size, By Region, 2017–2024 (Million Unit)
Table 7 Bag-In-Box Market Size, By Capacity, 2017–2024 (USD Million)
Table 8 Bag-In-Box Market Size, By Capacity, 2017–2024 (Million Unit)
Table 9 Bag-In-Box Market Size, By End-Use Sector, 2017–2024 (USD Million)
Table 10 Bag-In-Box Market Size, By End-Use Sector, 2017–2024 (Million Unit)
Table 11 Europe: Bag-In-Box Market Size, By Country, 2017–2024 (USD Million)
Table 12 Europe: Bag-In-Box Market Size, By Country, 2017–2024 (Million Unit)
Table 13 Europe: Bag-In-Box Market Size, By Capacity, 2017–2024 (USD Million)
Table 14 Europe: Bag-In-Box Market Size, By Capacity, 2017–2024 (Million Unit)
Table 15 Europe: Bag-In-Box Market Size, By End-Use Sector, 2017–2024 (USD Million)
Table 16 Europe: Bag-In-Box Market Size, By End-Use Sector, 2017–2024 (Million Unit)
Table 17 Germany: Bag-In-Box Market Size, By Capacity, 2017–2024 (USD Million)
Table 18 Germany: Bag-In-Box Market Size, By Capacity, 2017–2024 (Million Unit)
Table 19 Germany: Bag-In-Box Market Size, By End-Use Sector, 2017–2024 (USD Million)
Table 20 Germany: Bag-In-Box Market Size, By End-Use Sector, 2017–2024 (Million Unit)
Table 21 UK: Bag-In-Box Market Size, By Capacity, 2017–2024 (USD Million)
Table 22 UK: Bag-In-Box Market Size, By Capacity, 2017–2024 (Million Unit)
Table 23 UK: Bag-In-Box Market Size, By End-Use Sector, 2017–2024 (USD Million)
Table 24 UK: Bag-In-Box Market Size, By End-Use Sector, 2017–2024 (Million Unit)
Table 25 France: Bag-In-Box Market Size, By Capacity, 2017–2024 (USD Million)
Table 26 France: Bag-In-Box Market Size, By Capacity, 2017–2024 (Million Unit)
Table 27 France: Bag-In-Box Market Size, By End-Use Sector, 2017–2024 (USD Million)
Table 28 France: Bag-In-Box Market Size, By End-Use Sector, 2017–2024 (Million Unit)
Table 29 Russia: Bag-In-Box Market Size, By Capacity, 2017–2024 (USD Million)
Table 30 Russia: Bag-In-Box Market Size, By Capacity, 2017–2024 (Million Unit)
Table 31 Russia: Bag-In-Box Market Size, By End-Use Sector, 2017–2024 (USD Million)
Table 32 Russia: Bag-In-Box Market Size, By End-Use Sector, 2017–2024 (Million Unit)
Table 33 Spain: Bag-In-Box Market Size, By Capacity, 2017–2024 (USD Million)
Table 34 Spain: Bag-In-Box Market Size, By Capacity, 2017–2024 (Million Unit)
Table 35 Spain: Bag-In-Box Market Size, By End-Use Sector, 2017–2024 (USD Million)
Table 36 Spain: Bag-In-Box Market Size, By End-Use Sector, 2017–2024 (Million Unit)
Table 37 Rest of Europe: Bag-In-Box Market Size, By Capacity, 2017–2024 (USD Million)
Table 38 Rest of Europe: Bag-In-Box Market Size, By Capacity, 2017–2024 (Million Unit)
Table 39 Rest of Europe: Bag-In-Box Market Size, By End-Use Sector, 2017–2024 (USD Million)
Table 40 Rest of Europe: Bag-In-Box Market Size, By End-Use Sector, 2017–2024 (Million Unit)
Table 41 North America: Bag-In-Box Market Size, By Country, 2017–2024 (USD Million)
Table 42 North America: Bag-In-Box Market Size, By Country, 2017–2024 (Million Unit)
Table 43 North America: Bag-In-Box Market Size, By Capacity, 2017–2024 (USD Million)
Table 44 North America: Bag-In-Box Market Size, By Capacity, 2017–2024 (Million Unit)
Table 45 North America: Bag-In-Box Market Size, By End-Use Sector, 2017–2024 (USD Million)
Table 46 North America: Bag-In-Box Market Size, By End-Use Sector, 2017–2024 (Million Unit)
Table 47 US: Bag-In-Box Market Size, By Capacity, 2017–2024 (USD Million)
Table 48 US: Bag-In-Box Market Size, By Capacity, 2017–2024 (Million Unit)
Table 49 US: Bag-In-Box Market Size, By End-Use Sector, 2017–2024 (USD Million)
Table 50 US: Bag-In-Box Market Size, By End-Use Sector, 2017–2024 (Million Unit)
Table 51 Canada: Bag-In-Box Market Size, By Capacity, 2017–2024 (USD Million)
Table 52 Canada: Bag-In-Box Market Size, By Capacity, 2017–2024 (Million Unit)
Table 53 Canada: Bag-In-Box Market Size, By End-Use Sector, 2017–2024 (USD Million)
Table 54 Canada: Bag-In-Box Market Size, By End-Use Sector, 2017–2024 (Million Unit)
Table 55 Mexico: Bag-In-Box Market Size, By Capacity, 2017–2024 (USD Million)
Table 56 Mexico: Bag-In-Box Market Size, By Capacity, 2017–2024 (Million Unit)
Table 57 Mexico: Bag-In-Box Market Size, By End-Use Sector, 2017–2024 (USD Million)
Table 58 Mexico: Bag-In-Box Market Size, By End-Use Sector, 2017–2024 (Million Unit)
Table 59 Asia Pacific: Bag-In-Box Market Size, By Country, 2017–2024 (USD Million)
Table 60 Asia Pacific: Bag-In-Box Market Size, By Country, 2017–2024 (Million Units)
Table 61 Asia Pacific: Bag-In-Box Market Size, By Capacity, 2017–2024 (USD Million)
Table 62 Asia Pacific: Bag-In-Box Market Size, By Capacity, 2017–2024 (Million Units)
Table 63 Asia Pacific: Bag-In-Box Market Size, By End-Use Sector, 2017–2024 (USD Million)
Table 64 Asia Pacific: Bag-In-Box Market Size, By End-Use Sector, 2017–2024 (Million Units)
Table 65 China: Bag-In-Box Market Size, By Capacity, 2017–2024 (USD Million)
Table 66 China: Bag-In-Box Market Size, By Capacity, 2017–2024 (Million Units)
Table 67 China: Bag-In-Box Market Size, By End-Use Sector, 2017–2024 (USD Million)
Table 68 China: Bag-In-Box Market Size, By End-Use Sector, 2017–2024 (Million Units)
Table 69 Japan: Bag-In-Box Market Size, By Capacity, 2017–2024 (USD Million)
Table 70 Japan: Bag-In-Box Market Size, By Capacity, 2017–2024 (Million Units)
Table 71 Japan: Bag-In-Box Market Size, By End-Use Sector, 2017–2024 (USD Million)
Table 72 Japan: Bag-In-Box Market Size, By End-Use Sector, 2017–2024 (Million Units)
Table 73 India: Bag-In-Box Market Size, By Capacity, 2017–2024 (USD Million)
Table 74 India: Bag-In-Box Market Size, By Capacity, 2017–2024 (Million Units)
Table 75 India: Bag-In-Box Market Size, By End-Use Sector, 2017–2024 (USD Million)
Table 76 India: Bag-In-Box Market Size, By End-Use Sector, 2017–2024 (Million Units)
Table 77 Australia: Bag-In-Box Market Size, By Capacity, 2017–2024 (USD Million)
Table 78 Australia: Bag-In-Box Market Size, By Capacity, 2017–2024 (Million Units)
Table 79 Australia: Bag-In-Box Market Size, By End-Use Sector, 2017–2024 (USD Million)
Table 80 Australia: Bag-In-Box Market Size, By End-Use Sector, 2017–2024 (Million Units)
Table 81 South Korea: Bag-In-Box Market Size, By Capacity, 2017–2024 (USD Million)
Table 82 South Korea: Bag-In-Box Market Size, By Capacity, 2017–2024 (Million Units)
Table 83 South Korea: Bag-In-Box Market Size, By End-Use Sector, 2017–2024 (USD Million)
Table 84 South Korea: Bag-In-Box Market Size, By End-Use Sector, 2017–2024 (Million Units)
Table 85 Rest of Asia Pacific: Bag-In-Box Market Size, By Capacity, 2017–2024 (USD Million)
Table 86 Rest of Asia Pacific: Bag-In-Box Market Size, By Capacity, 2017–2024 (Million Units)
Table 87 Rest of Asia Pacific: Bag-In-Box Market Size, By End-Use Sector, 2017–2024 (USD Million)
Table 88 Rest of Asia Pacific: Bag-In-Box Market Size, By End-Use Sector, 2017–2024 (Million Units)
Table 89 Middle East & Africa: Bag-In-Box Market Size, By Country, 2017–2024 (USD Million)
Table 90 Middle East & Africa: Bag-In-Box Market Size, By Country, 2017–2024 (Million Unit)
Table 91 Middle East & Africa: Bag-In-Box Market Size, By Capacity, 2017–2024 (USD Million)
Table 92 Middle East & Africa: Bag-In-Box Market Size, By Capacity, 2017–2024 (Million Unit)
Table 93 Middle East & Africa: Bag-In-Box Market Size, By End-Use Sector, 2017–2024 (USD Million)
Table 94 Middle East & Africa: Bag-In-Box Market Size, By End-Use Sector, 2017–2024 (Million Unit)
Table 95 UAE: Bag-In-Box Market Size, By Capacity, 2017–2024 (USD Million)
Table 96 UAE: Bag-In-Box Market Size, By Capacity, 2017–2024 (Million Unit)
Table 97 UAE: Bag-In-Box Market Size, By End-Use Sector, 2017–2024 (USD Million)
Table 98 UAE: Bag-In-Box Market Size, By End-Use Sector, 2017–2024 (Million Unit)
Table 99 Saudi Arabia: Bag-In-Box Market Size, By Capacity, 2017–2024 (USD Million)
Table 100 Saudi Arabia: Bag-In-Box Market Size, By Capacity, 2017–2024 (Million Unit)
Table 101 Saudi Arabia: Bag-In-Box Market Size, By End-Use Sector, 2017–2024 (USD Million)
Table 102 Saudi Arabia: Bag-In-Box Market Size, By End-Use Sector, 2017–2024 (Million Unit)
Table 103 South Africa: Bag-In-Box Market Size, By Capacity, 2017–2024 (USD Million)
Table 104 South Africa: Bag-In-Box Market Size, By Capacity, 2017–2024 (Million Unit)
Table 105 South Africa: Bag-In-Box Market Size, By End-Use Sector, 2017–2024 (USD Million)
Table 106 South Africa: Bag-In-Box Market Size, By End-Use Sector, 2017–2024 (Million Unit)
Table 107 Turkey: Bag-In-Box Market Size, By Capacity, 2017–2024 (USD Million)
Table 108 Turkey: Bag-In-Box Market Size, By Capacity, 2017–2024 (Million Unit)
Table 109 Turkey: Bag-In-Box Market Size, By End-Use Sector, 2017–2024 (USD Million)
Table 110 Turkey: Bag-In-Box Market Size, By End-Use Sector, 2017–2024 (Million Unit)
Table 111 Rest of Middle East & Africa: Bag-In-Box Market Size, By Capacity, 2017–2024 (USD Million)
Table 112 Rest of Middle East & Africa: Bag-In-Box Market Size, By Capacity, 2017–2024 (Million Unit)
Table 113 Rest of Middle East & Africa: Bag-In-Box Market Size, By End-Use Sector, 2017–2024 (USD Million)
Table 114 Rest of Middle East & Africa: Bag-In-Box Market Size, By End-Use Sector, 2017–2024 (Million Unit)
Table 115 South America: Bag-In-Box Market Size, By Country, 2017–2024 (USD Million)
Table 116 South America: Bag-In-Box Market Size, By Country, 2017–2024 (Million Units)
Table 117 South America: Bag-In-Box Market Size, By Capacity, 2017–2024 (USD Million)
Table 118 South America: Bag-In-Box Market Size, By Capacity, 2017–2024 (Million Units)
Table 119 South America: Bag-In-Box Market Size, By End-Use Sector, 2017–2024 (USD Million)
Table 120 South America: Bag-In-Box Market Size, By Application, 2017–2024 (Million Units)
Table 121 Brazil: Bag-In-Box Market Size, By Capacity, 2017–2024 (USD Million)
Table 122 Brazil: Bag-In-Box Market Size, By Capacity, 2017–2024 (Million Units)
Table 123 Brazil: Bag-In-Box Market Size, By End-Use Sector, 2017–2024 (USD Million)
Table 124 Brazil: Bag-In-Box Market Size, By End-Use Sector, 2017–2024 (Million Units)
Table 125 Argentina: Bag-In-Box Market Size, By Capacity, 2017–2024 (USD Million)
Table 126 Argentina: Bag-In-Box Market Size, By Capacity, 2017–2024 (Million Units)
Table 127 Argentina: Bag-In-Box Market Size, By End-Use Sector, 2017–2024 (USD Million)
Table 128 Argentina: Bag-In-Box Market Size, By End-Use Sector, 2017–2024 (Million Units)
Table 129 Rest of South America: Bag-In-Box Market Size, By Capacity, 2017–2024 (USD Million)
Table 130 Rest of South America: Bag-In-Box Market Size, By Capacity, 2017–2024 (Million Units)
Table 131 Rest of South America: Bag-In-Box Market Size, By End-Use Sector, 2017–2024 (USD Million)
Table 132 Rest of South America: Bag-In-Box Market Size, By End-Use Sector, 2017–2024 (Million Units)
Table 133 Expansions & Investments, 2017–2019
Table 134 New Product Developments, 2017–2019
Table 135 Mergers & Acquisitions, 2016–2019
Table 136 Partnerships, 2019
List of Figures (37 Figures)
Figure 1 Bag-In-Box Market Segmentation
Figure 2 Bag-In-Box Market, By Region
Figure 3 Bag-In-Box Market: Bottom-Up Approach
Figure 4 Bag-In-Box Market: Top-Down Approach
Figure 5 Market for Bag-In-Box With A Capacity of 5-10 Liters Accounted for the Largest Share, in Terms of Value, in the Global Market
Figure 6 Beverages Segment, By End-Use Sector, Projected to Grow at the Highest CAGR During the Forecast Period
Figure 7 Europe Leads the Bag-In-Box Market in 2018, in Terms of Value
Figure 8 Developing Countries to Offer Attractive Opportunities in the Bag-In-Box Market During the Forecast Period
Figure 9 France Was the Largest Market for Bag-In-Box in Europe in 2018
Figure 10 The Beverage Segment is Projected to Dominate the Bag-In-Box Market During the Forecast Period
Figure 11 The < 1 Liter Segment is Projected to Be the Fastest-Growing Segment in the Bag-In-Box Market
Figure 12 The Bag-In-Box Market in India is Projected to Grow at the Highest CAGR From 2019 to 2024
Figure 13 Bag-In-Box Market Dynamics
Figure 14 New Product Developments Giving Rise to New Applications
Figure 15 Youth Environment Protection Organizations
Figure 16 Bag-In-Box Market, By Capacity, 2017 vs. 2024 (USD Million)
Figure 17 Bag-In-Box Market, By End-Use Sector, 2017 vs. 2024 (USD Million)
Figure 18 Regional Snapshot: India is Projected to Be the Fastest-Growing Country-Level Market, 2019–2024
Figure 19 Europe: Bag-In-Box Market Snapshot
Figure 20 Companies Adopted Expansions & Investments as the Key Growth Strategy Between 2016 and 2019
Figure 21 Smurfit Kappa: Company Snapshot
Figure 22 SWOT Analysis: Smurfit Kappa
Figure 23 Winning Imperatives: Smurfit Kappa
Figure 24 DS Smith PLC: Company Snapshot
Figure 25 DS Smith PLC : SWOT Analysis
Figure 26 Winning Imperatives: DS Smith PLC
Figure 27 Liqui-Box Corp.: Company Snapshot
Figure 28 Liqui-Box Corp.: SWOT Analysis
Figure 29 Winning Imperatives: Liqui-Box Corp.
Figure 30 Scholle Ipn: SWOT Analysis
Figure 31 Winning Imperatives : Scholle Ipn
Figure 32 CDF Corp.: Company Snapshot
Figure 33 CDF Corp.: SWOT Analysis
Figure 34 Aran Group: Company Snapshot
Figure 35 Fujimori Kogyo Ltd.: Company Snapshot
Figure 36 Optopack Ltd.: Company Snapshot
Figure 37 Amcor Ltd.: Company Snapshot
The study involved four major activities for estimating the current global size of the bag-in-box market. The exhaustive secondary research was carried out to collect information on the market, the peer market, and the parent market. The next step was to validate these findings, assumptions, and sizes with the industry experts across the value chain of bag-in-box through primary research. Both the top-down and bottom-up approaches were employed to estimate the overall size of the bag-in-box market. Thereafter, market breakdown and data triangulation procedures were used to estimate the size of different segments and subsegments of the market.
Secondary Research
In the secondary research process, various secondary sources such as Hoovers, Factiva, Bloomberg BusinessWeek, and Dun & Bradstreet were referred to, so as to identify and collect information for this study on the bag-in-box market. These secondary sources included annual reports, press releases & investor presentations of companies, white papers, certified publications, articles by recognized authors, regulatory bodies, trade directories, and databases.
Primary Research
Various primary sources from both the supply and demand sides of the bag-in-box market were interviewed to obtain qualitative and quantitative information. The primary sources from the supply-side included industry experts, such as chief executive officers (CEOs), vice presidents, marketing directors, sales professionals, and related key executives from various leading companies and organizations operating in the bag-in-box industry. The primary sources from the demand-side included key executives from banks, government organizations, and educational institutions.
The breakdown of the profiles of primary respondents is as follows:
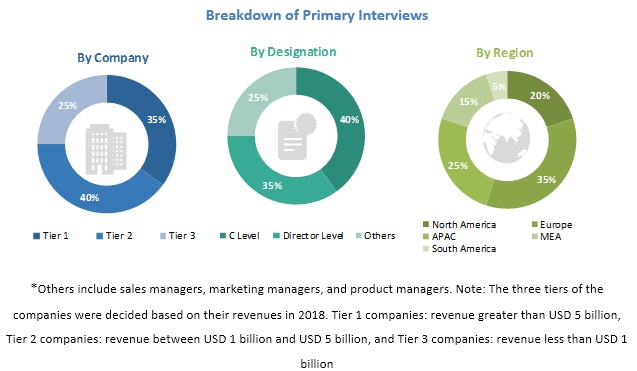
To know about the assumptions considered for the study, download the pdf brochure
Market Size Estimation
Both the top-down and bottom-up approaches were used to estimate and validate the global size of the bag-in-box market. These approaches were also used extensively to estimate the size of various dependent segments of the market. The research methodology used to estimate the market size included the following details:
- The key players were identified through extensive secondary research.
- The industry’s supply chain and market size, in terms of value, were determined through primary and secondary research processes.
- All percentage shares, splits, and breakdowns were determined using secondary sources and verified through primary sources.
Data Triangulation
After arriving at the overall market size from the estimation process explained above, the total market was split into several segments and subsegments. The data triangulation and market breakdown procedures were employed, wherever applicable, to complete the overall market engineering process and arrive at the exact statistics for all segments and subsegments of the bag-in-box market. The data was triangulated by studying various factors and trends from both the demand- and supply-side.
Research Objectives
- To define, analyze, and project the size of the bag-in-box market in terms of value and volume, based on material state, components, capacity, tap, end-use sector, and region
- To project the size of the market and its segments in terms of value and volume, with respect to the five main regions, namely, North America, Europe, Asia Pacific, the Middle East & Africa, and South America
- To provide detailed information about the key factors, such as drivers, restraints, opportunities, and challenges, influencing the growth of the market
- To strategically analyze the micromarkets with respect to individual growth trends, future prospects, and their contribution to the total market
- To analyze the opportunities in the market for stakeholders and provide a detailed competitive landscape of the market leaders
- To analyze the competitive developments, such as new product launches and acquisitions in the bag-in-box market
- To strategically profile the key players operating in the market and comprehensively analyze their market shares and core competencies
Available Customizations
With the given market data, MarketsandMarkets offers customizations according to client-specific needs.
The following customization options are available for the Bag-in-box report:
Product Analysis
- Product matrix, which offers a detailed comparison of the product portfolio of companies
Regional Analysis
- Further analysis of the Bag-in-box market for additional countries
Company Information
- Detailed analysis and profiling of additional market players (up to five)


Growth opportunities and latent adjacency in Bag-in-Box Market