Battery Energy Storage System Market

Battery Energy Storage System Market Size, Share, Statistics and Industry Growth Analysis Report by Element, Battery Type (Lithium-ion, Advanced Lead Acid, Flow), Connection Type (On-Grid and Off-Grid), Ownership (Customer Owned, Third-Party Owned, Utility Owned), Energy Capacity - Global Forecast to 2028

Report Code: SE 4200 Jun, 2023, by marketsandmarkets.com

[287 Pages Report] The global Battery Energy Storage System Market Size is estimated to be worth USD 5.4 Billion in 2023 and is projected to reach USD 17.5 Billion by 2028, at a CAGR of 26.4% during the forecast period.

The market is expanding due to several factors. These include the rising demand for grid energy storage systems as part of ongoing grid modernization efforts, the increasing use of lithium-ion batteries, and the growing adoption of low-carbon and less fossil fuel-dependent economies. Additionally, the ongoing revolution in renewable energy is contributing to this battery energy storage system industry growth.
Battery Energy Storage Market

Battery Energy Storage Market

Battery Energy Storage Market Forecast to 2028

To know about the assumptions considered for the study, Request for Free Sample Report

Battery Energy Storage System Market Trends

Driver: Accelerated deployment of grid energy storage systems in ongoing grid modernization on projects

Grid modernization initiatives often involve the integration of renewable energy, such as solar and wind power, into the grid. However, renewable sources are intermittent in nature, which can lead to fluctuations in power supply. Battery energy storage systems help address this challenge by storing excess energy during periods of high generation and releasing it during times of high demand or when renewable sources are not actively generating electricity. This helps to stabilize the grid and ensure a reliable power supply. These systems help grid operators to save electricity when the electricity generated exceeds the electricity demand. The adoption of these systems improves the reliability and flexibility of electricity supply systems with respect to the generation, transmission, and distribution of electric power. During the transmission and distribution of electricity, battery energy storage systems can handle asset deferral, ensure frequency regulation, carry out harmonic suppression, offer voltage support, and ensure power quality. Electric energy time-shifting, baseload leveling and peak shaving, renewable energy time-shifting, and renewable capacity firming are other benefits offered by battery energy storage systems for grid-connected solutions.

Restraint: High initial investment costs of installing battery energy storage systems

Battery energy storage technologies, including lithium-ion batteries, flow batteries, and lead-acid batteries, require increased installation investment owing to the high energy density and improved performance offered by them. Lithium-ion batteries are costly as they offer high energy density, have a low rate of self-discharge, and require less maintenance. However, the costs of lithium-ion batteries are expected to decline in the future. These batteries are also used in electric vehicles (EVs) as they are lightweight and compact, as well as have a large capacity. Besides, the high initial investment cost required for the manufacturing of flow batteries can also act as a major restraint for the growth of the market. Additionally, battery energy storage systems require supporting infrastructure, such as power conversion systems, control systems, thermal management systems, and safety measures. These components add to the overall cost of the system. The overall cost associated with the flow battery includes capital costs, component costs, material costs, installation costs, and repair & maintenance costs, which is an extensive investment for small- and medium-sized enterprises.

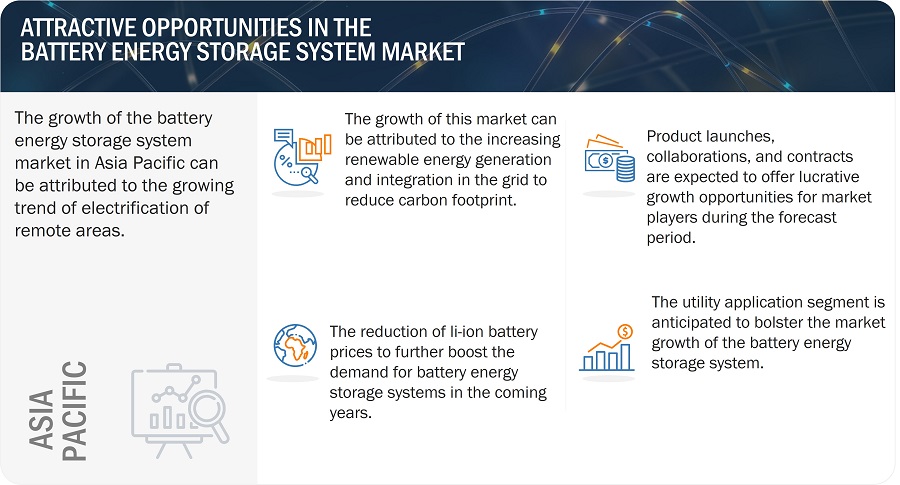
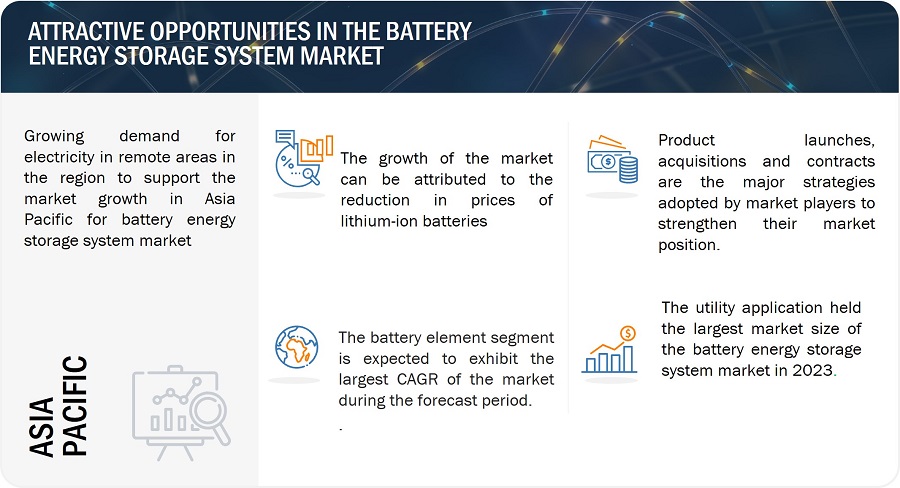
Opportunity: Reduction in prices of lithium-ion batteries

There has been a notable decline in the cost of lithium-ion batteries, driven by advancements in technology, economies of scale, and increased manufacturing efficiency. This price reduction has made battery energy storage systems more affordable and accessible for various applications. The lower cost per kilowatt-hour (kWh) of energy storage enables businesses to invest in larger and more robust systems, ensuring they have sufficient capacity to meet their power needs during outages or peak demand periods. Moreover, the reduction in prices of lithium-ion batteries is having a major impact on the BESS market growth. This is because lower battery prices are making BESS more affordable, more competitive, and a more attractive solution for ensuring reliable and uninterrupted power supply.

Challenge: Difficulties pertaining to installation of battery energy storage systems in remote and isolated locations

Installing battery energy storage systems in remote areas can be challenging due to the limited or unreliable availability of grid power. Establishing a reliable power source for the initial installation and subsequent maintenance activities may be necessary, which could involve alternative energy sources like solar panels. Moreover, providing regular maintenance and servicing for battery energy storage systems in remote areas can be difficult due to the lack of local service providers and limited access to spare parts. Subsequently, remote, and isolated locations may have harsh environmental conditions, such as extreme temperatures, high humidity, or corrosive atmospheres. These conditions can impact the performance and lifespan of the battery system and require additional measures for protection and durability.

Battery Energy Storage System Market Ecosystem

Battery Energy Storage Market by Ecosystem

Battery Energy Storage System Market: Key Trends

BYD Company Limited, SAMSUNG SDI Co., Ltd., LG Energy Solutions Co., Ltd., and Panasonic Corporation are the top players in the BESS market. These BESS companies boast battery technology trends with a comprehensive product portfolio and solid geographic footprint.

Lithium-ion batteries accounted for the largest share of the Battery Energy Storage Systems Market in 2022.

Lithium-ion batteries hold the largest share in the battery energy storage system market as they offer a high energy density, due to which they can store a significant amount of energy in a relatively small and lightweight package. Secondly, lithium-ion batteries have a longer cycle life compared to other battery technologies. They can withstand many charge-discharge cycles without significant degradation in performance. Furthermore, lithium-ion batteries exhibit excellent efficiency, with a high energy conversion rate during charging and discharging processes. This efficiency translates into reduced energy losses and higher overall system performance, making lithium-ion batteries a cost-effective solution.

Utility-Owned battery energy storage system to account for the largest share in the market during forecast period.

The growing demand to meet peak electricity requirements is a key driver for the expansion of the utility application market. Utility battery energy storage systems (BESS) play a crucial role in providing power quality, frequency, and voltage control services in response to sudden fluctuations in energy supply. These systems enable grid operators to store excess electricity generated from renewable sources, ensuring efficient energy management. The increasing need for reliable and efficient electricity supply in various regions, coupled with the growing demand for renewable energy, is fueling the high market demand for battery energy storage systems in the utility sector.

Battery Energy Storage System for above 500 MWh capacity to contribute the largest market size in the market during 2023 to 2028.

Battery energy storage systems with capacities exceeding 500 MWh accounted for the largest share in the battery energy storage system market primarily due to their suitability for utility-scale applications, their ability to support grid stability and reliability, and their role in efficiently integrating and balancing intermittent renewable energy sources. These larger systems can store and release significant amounts of energy, meeting the demands of large-scale power grids and enabling the efficient utilization of renewable energy. Additionally, economies of scale and the increasing focus on decarbonization and clean energy systems have further propelled the demand for battery energy storage systems with capacities above 500 MWh, driving their dominant position in the market.

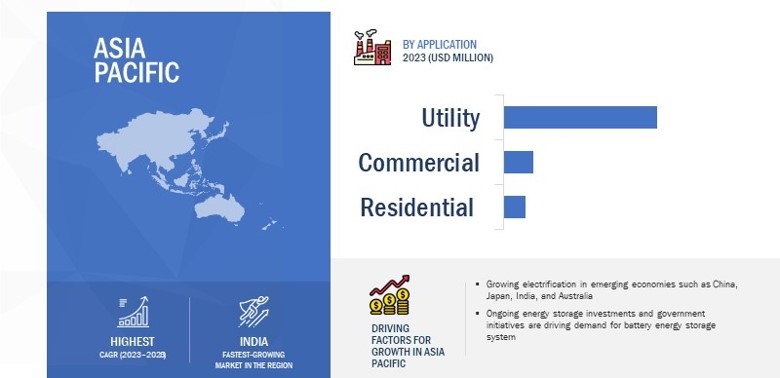
Asia Pacific held the largest share of the Battery Energy Storage System Market in 2022.
Battery Energy Storage Market by Region

Battery Energy Storage Market Statistics by Region

To know about the assumptions considered for the study, download the pdf brochure

Key Market Players

The major companies in the battery energy storage system companies include BYD Company Limited, SAMSUNG SDI Co., Ltd., LG Energy Solutions Co., Ltd., and Panasonic Corporation. These companies have used both organic and inorganic growth strategies such as product launches, acquisitions, and partnerships to strengthen their position in the battery energy storage system market.

Battery Energy Storage System Market Report Scope:

Report Metric

Details

Estimated Market Size in 2023

USD 5.4 Billion

Projected Market Size in 2028

USD 17.5 Billion

Growth Rate

CAGR of 26.4%

Years Considered

2019–2028

Base year considered

2022

Forecast period

2023–2028

Forecast units

Value (USD million/billion)

Segments Covered

Element, Battery Type, Connection Type, Ownership, Energy Capacity, and Application

Regions covered

North America, Asia Pacific, Europe, and Rest of the World

Companies covered

BYD Company Limited (China), General Electric (US), LG Energy Solutions CO., Ltd. (South Korea), Panasonic Corporation (Japan), SAMSUNG SDI Co., Ltd. (South Korea).
A total of 25 players are covered.

Battery Energy Storage Market Highlights

In this report, the overall battery energy storage system market has been segmented based on Input energy sources, storage system, element, battery type, connection type, ownership, energy capacity, application, and region.

Segment

Subsegment

By Element

  • Battery
  • Other Elements

By Battery Type

  • Lithium-Ion Batteries
  • Advanced Lead-Acid Batteries
  • Flow Batteries
  • Others

By Connection Type

  • On-grid
  • Off-grid

By Ownership

  • Customer-Owned
  • Third-Party Owned
  • Utility-Owned

By Energy Capacity

  • Below 100 MWh
  • Between 100 to 500 MWh
  • Above 500 MWh

By Application

  • Residential
  • Commercial
  • Utility

By Region

  • North America
    • US
    • Canada
    • Mexico
  • Europe
    • UK
    • Germany
    • France
    • Ireland
    • Rest of Europe
  • Asia Pacific
    • China
    • Japan
    • Australia
    • India
    • South Korea
    • Rest of Asia Pacific
  • Rest of the World
    • Middle East & Africa
    • South America

Recent Developments

  • In June 2022, General Electric announced its recent renewable hybrid factory that expand its manufacturing capacity for power electronics systems in solar and battery energy storage to 9 GW per year, tripling its current capacity.
  • In May 2022, Toshiba Corporation introduced the 125VDC SCiB Energy Storage System (ESS), which combines the dependability of Lithium Titanium Oxide (LTO) battery chemistry with a flexible and expandable cabinet design. It is made suitable for integration with Uninterruptible Power Systems (UPS) or DC Load applications.
  • In February 2022, LG Energy Solution has successfully acquired NEC Energy Solutions, a grid battery integrator based in the United States, from its parent company, NEC Corporation. This strategic move aims to enhance LG Energy Solution's Energy Storage System (ESS) business portfolio by expanding its offerings.

Frequently Asked Questions (FAQ):

To speak to our analyst for a discussion on the above findings, click Speak to Analyst

TABLE OF CONTENTS
 
1 INTRODUCTION (Page No. - 35)
    1.1 STUDY OBJECTIVES 
    1.2 MARKET DEFINITION 
    1.3 INCLUSIONS AND EXCLUSIONS 
    1.4 STUDY SCOPE 
           1.4.1 MARKETS COVERED
                    FIGURE 1 BATTERY ENERGY STORAGE SYSTEM MARKET: SEGMENTATION
           1.4.2 REGIONAL SCOPE
           1.4.3 YEARS CONSIDERED
    1.5 CURRENCY 
    1.6 STAKEHOLDERS 
    1.7 SUMMARY OF CHANGES 
 
2 RESEARCH METHODOLOGY (Page No. - 40)
    2.1 RESEARCH DATA 
           FIGURE 2 BATTERY ENERGY STORAGE SYSTEM MARKET: RESEARCH DESIGN
           2.1.1 SECONDARY DATA
                    2.1.1.1 List of major secondary sources
                    2.1.1.2 Key data from secondary sources
           2.1.2 PRIMARY DATA
                    2.1.2.1 Primary interviews with experts
                    2.1.2.2 Breakdown of primaries
                    2.1.2.3 Key data from primary sources
           2.1.3 SECONDARY AND PRIMARY RESEARCH
                    2.1.3.1 Key industry insights
    2.2 MARKET SIZE ESTIMATION 
           2.2.1 BOTTOM-UP APPROACH
                    2.2.1.1 Approach to derive market size using bottom-up analysis (demand side)
                               FIGURE 3 BATTERY ENERGY STORAGE SYSTEM MARKET: BOTTOM-UP APPROACH
           2.2.2 TOP-DOWN APPROACH
                    2.2.2.1 Approach to derive market size using top-down analysis (supply side)
                               FIGURE 4 MARKET: TOP-DOWN APPROACH
                               FIGURE 5 MARKET SIZE ESTIMATION METHODOLOGY: APPROACH (SUPPLY SIDE): REVENUE FROM PRODUCTS/SOLUTIONS/SERVICES IN MARKET
    2.3 MARKET BREAKDOWN AND DATA TRIANGULATION 
           FIGURE 6 DATA TRIANGULATION
    2.4 RESEARCH ASSUMPTIONS 
    2.5 PARAMETERS CONSIDERED TO ANALYZE IMPACT OF RECESSION ON MARKET 
    2.6 LIMITATIONS 
    2.7 RISK ASSESSMENT 
 
3 EXECUTIVE SUMMARY (Page No. - 52)
    FIGURE 7 BATTERY ENERGY STORAGE SYSTEM MARKET
    FIGURE 8 LITHIUM-ION BATTERIES LARGEST SEGMENT OF MARKET IN 2022
    FIGURE 9 BATTERY SEGMENT TO CONTRIBUTE LARGER SHARE TO MARKET IN 2023
    FIGURE 10 UTILITY APPLICATION SEGMENT ACCOUNTED FOR LARGEST MARKET SIZE IN 2022
    FIGURE 11 ASIA PACIFIC HELD LARGEST MARKET SHARE IN 2022
 
4 PREMIUM INSIGHTS (Page No. - 56)
    4.1 ATTRACTIVE GROWTH OPPORTUNITIES IN BATTERY ENERGY STORAGE SYSTEM MARKET 
           FIGURE 12 GROWING DEMAND FOR CONTINUOUS POWER SUPPLY AND RISING ADOPTION OF BATTERY ENERGY STORAGE SYSTEMS FOR ELECTRIFICATION IN RURAL AREAS TO DRIVE MARKET
    4.2 MARKET, BY BATTERY TYPE 
           FIGURE 13 LITHIUM-ION BATTERIES SEGMENT HELD LARGEST SHARE IN 2022
    4.3 MARKET, BY ENERGY CAPACITY 
           FIGURE 14 ABOVE 500 MWH ENERGY CAPACITY SEGMENT TO DOMINATE MARKET DURING FORECAST PERIOD
    4.4 MARKET, BY APPLICATION 
           FIGURE 15 UTILITY TO BE LARGEST APPLICATION SEGMENT OF MARKET IN 2023
    4.5 MARKET, BY REGION 
           FIGURE 16 MARKET IN INDIA TO REGISTER HIGHEST CAGR DURING FORECAST PERIOD
 
5 MARKET OVERVIEW (Page No. - 59)
    5.1 INTRODUCTION 
    5.2 MARKET DYNAMICS 
           FIGURE 17 BATTERY ENERGY STORAGE SYSTEM MARKET: DRIVERS, RESTRAINTS, OPPORTUNITIES, AND CHALLENGES
           5.2.1 DRIVERS
                    5.2.1.1 Accelerated deployment of grid energy storage systems in ongoing grid modernization projects
                    5.2.1.2 Adoption of lithium-ion batteries in renewable energy sector
                    5.2.1.3 Renewable energy revolution and transition toward low carbon-based economy
                               FIGURE 18 BATTERY ENERGY STORAGE SYSTEM MARKET: IMPACT ANALYSIS OF DRIVERS
           5.2.2 RESTRAINTS
                    5.2.2.1 High cost of installing battery energy storage systems
                               FIGURE 19 BATTERY ENERGY STORAGE SYSTEM MARKET: IMPACT ANALYSIS OF RESTRAINTS
           5.2.3 OPPORTUNITIES
                    5.2.3.1 Rapid adoption of battery energy storage systems in rural electrification projects worldwide
                    5.2.3.2 Increased demand for continuous power supply from data centers
                    5.2.3.3 Reduction in price of lithium-ion batteries
                               FIGURE 20 BATTERY ENERGY STORAGE SYSTEM MARKET: IMPACT ANALYSIS OF OPPORTUNITIES
           5.2.4 CHALLENGES
                    5.2.4.1 Difficulties pertaining to installation of battery energy storage systems in remote and isolated locations
                    5.2.4.2 Overheating of lithium-ion batteries due to abnormal discharges and short circuits
                    5.2.4.3 Aging of lithium-ion batteries due to complex chemical reactions between electrodes and electrolytes
                               FIGURE 21 BATTERY ENERGY STORAGE SYSTEM MARKET: IMPACT ANALYSIS OF CHALLENGES
    5.3 VALUE CHAIN ANALYSIS 
           FIGURE 22 MARKET: VALUE CHAIN ANALYSIS
    5.4 ECOSYSTEM ANALYSIS 
           FIGURE 23 MARKET: ECOSYSTEM ANALYSIS
           FIGURE 24 BATTERY TECHNOLOGIES: ECOSYSTEM ANALYSIS
           TABLE 1 MARKET: ECOSYSTEM ANALYSIS
    5.5 PRICING ANALYSIS 
           5.5.1 AVERAGE SELLING PRICE TREND
                    FIGURE 25 BATTERY ENERGY STORAGE SYSTEM: PRICING BREAKDOWN
                    FIGURE 26 AVERAGE PRICE OF LITHIUM-ION BATTERY PACKS FOR ENERGY STORAGE
                    TABLE 2 AVERAGE SELLING PRICE OF LITHIUM-ION BATTERY PACKS FOR ENERGY STORAGE, BY REGION
           5.5.2 AVERAGE SELLING PRICE OF BATTERY TYPES, BY KEY PLAYER
                    FIGURE 27 AVERAGE SELLING PRICE OF BATTERY TYPES, BY KEY PLAYER
                    TABLE 3 AVERAGE SELLING PRICE OF BATTERY TYPES, BY KEY PLAYER (USD)
    5.6 TRENDS/DISRUPTIONS IMPACTING CUSTOMER BUSINESS 
           FIGURE 28 TRENDS/DISRUPTIONS IMPACTING CUSTOMER’S BUSINESS
    5.7 TECHNOLOGY ANALYSIS 
           TABLE 4 COMPARISON OF ENERGY STORAGE TECHNOLOGIES
           TABLE 5 CHARACTERISTICS OF TECHNOLOGIES IN BATTERY ENERGY STORAGE SYSTEMS
           5.7.1 SODIUM-SULFUR BATTERY
           5.7.2 COBALT-FREE BATTERY
           5.7.3 METAL-AIR BATTERY
           5.7.4 LIQUID METAL BATTERY
           5.7.5 POTASSIUM METAL BATTERY
           5.7.6 ZINC-MANGANESE BATTERY
           5.7.7 LITHIUM-SULFUR BATTERY
           5.7.8 LITHIUM METAL BATTERY
    5.8 PORTER’S FIVE FORCES ANALYSIS 
           FIGURE 29 BATTERY ENERGY STORAGE SYSTEM MARKET: PORTER’S FIVE FORCES ANALYSIS
           TABLE 6 MARKET: PORTER’S FIVE FORCES ANALYSIS
           5.8.1 THREAT OF NEW ENTRANTS
           5.8.2 THREAT OF SUBSTITUTES
           5.8.3 BARGAINING POWER OF SUPPLIERS
           5.8.4 BARGAINING POWER OF BUYERS
           5.8.5 INTENSITY OF COMPETITIVE RIVALRY
    5.9 KEY STAKEHOLDERS AND BUYING CRITERIA 
           5.9.1 KEY STAKEHOLDERS IN BUYING PROCESS
                    FIGURE 30 INFLUENCE OF STAKEHOLDERS ON BUYING PROCESS FOR TOP THREE APPLICATIONS
                    TABLE 7 INFLUENCE OF STAKEHOLDERS ON BUYING PROCESS FOR TOP THREE APPLICATIONS (%)
           5.9.2 BUYING CRITERIA
                    FIGURE 31 KEY BUYING CRITERIA FOR TOP THREE APPLICATIONS
                    TABLE 8 KEY BUYING CRITERIA FOR TOP THREE APPLICATIONS
    5.10 CASE STUDY ANALYSIS 
           5.10.1 GENERAL ELECTRIC TO DELIVER BATTERY ENERGY STORAGE SYSTEMS TO CONVERGENT
           5.10.2 ADOPTION OF BATTERY ENERGY STORAGE SYSTEMS BY UTILITY PROVIDER COMPANY
           5.10.3 DEPLOYMENT OF MICROGRID BATTERY ENERGY STORAGE SYSTEMS FOR RURAL ELECTRIFICATION IN NIGERIA
           5.10.4 DEPLOYMENT OF OFF-GRID BATTERY ENERGY STORAGE SYSTEMS FOR RENEWABLE ENERGY PROJECT
           5.10.5 ABB TO INSTALL BATTERY ENERGY STORAGE SYSTEMS IN PHILIPPINES
    5.11 TRADE ANALYSIS 
           5.11.1 IMPORT SCENARIO
                    FIGURE 32 IMPORT DATA, BY KEY COUNTRY, 2017–2021 (USD MILLION)
           5.11.2 EXPORT SCENARIO
                    FIGURE 33 EXPORT DATA, BY KEY COUNTRY, 2017–2021 (USD MILLION)
    5.12 PATENT ANALYSIS 
           FIGURE 34 TOP 10 COMPANIES WITH HIGHEST NUMBER OF PATENT APPLICATIONS IN LAST 10 YEARS
           FIGURE 35 NO. OF PATENTS GRANTED IN BATTERY ENERGY STORAGE SYSTEM MARKET ANNUALLY OVER LAST 10 YEARS
           TABLE 9 TOP 20 PATENT OWNERS IN LAST 10 YEARS
           TABLE 10 LIST OF PATENTS RELATED TO MARKET
    5.13 KEY CONFERENCES & EVENTS IN 2023–2024 
           TABLE 11 BATTERY ENERGY STORAGE SYSTEM MARKET: CONFERENCES AND EVENTS
    5.14 REGULATORY LANDSCAPE 
           5.14.1 REGULATORY BODIES, GOVERNMENT AGENCIES, AND OTHER ORGANIZATIONS
                    TABLE 12 NORTH AMERICA: LIST OF REGULATORY BODIES, GOVERNMENT AGENCIES, AND OTHER ORGANIZATIONS
                    TABLE 13 EUROPE: LIST OF REGULATORY BODIES, GOVERNMENT AGENCIES, AND OTHER ORGANIZATIONS
                    TABLE 14 ASIA PACIFIC: LIST OF REGULATORY BODIES, GOVERNMENT AGENCIES, AND OTHER ORGANIZATIONS
                    TABLE 15 REST OF THE WORLD: LIST OF REGULATORY BODIES, GOVERNMENT AGENCIES, AND OTHER ORGANIZATIONS
           5.14.2 STANDARDS AND REGULATIONS RELATED TO BATTERY ENERGY STORAGE SYSTEM MARKET
                    TABLE 16 REGULATIONS AND STANDARDS FOR BATTERY ENERGY STORAGE SYSTEMS
 
6 MAJOR INPUT ENERGY SOURCES AND RECENT TRENDS RELATED TO BESS (Page No. - 98)
    6.1 INTRODUCTION 
    6.2 INPUT ENERGY SOURCES 
           6.2.1 SOLAR PANELS
           6.2.2 WIND TURBINES
           6.2.3 GRID POWER
           6.2.4 DIESEL GENERATORS
           6.2.5 OTHERS
    6.3 RECENT TRENDS RELATED TO MARKET 
           6.3.1 RENEWABLE ENERGY SOURCES
           6.3.2 ADVANCEMENTS IN BATTERY TECHNOLOGIES
           6.3.3 AI AND ML
           6.3.4 MICROGRIDS
           6.3.5 HYBRID ENERGY STORAGE SYSTEMS
    6.4 ANALYSIS OF VARIOUS BATTERY TECHNOLOGIES AND BESS 
           6.4.1 COMPREHENSIVE ANALYSIS OF VARIOUS TYPES OF BATTERY TECHNOLOGIES
                    TABLE 17 DIFFERENT TYPES OF BATTERY TECHNOLOGIES
           6.4.2 COMPREHENSIVE ANALYSIS OF VARIOUS TYPES OF ENERGY STORAGE SYSTEMS
                    TABLE 18 VARIOUS TYPES OF ENERGY STORAGE SYSTEMS
    6.5 TYPES OF SYSTEMS FOR BATTERY ENERGY STORAGE 
           6.5.1 FRONT-OF-THE-METER (FTM) SYSTEM
           6.5.2 BEHIND-THE-METER (BTM) SYSTEM
 
7 BATTERY ENERGY STORAGE SYSTEM MARKET, BY ELEMENT (Page No. - 113)
    7.1 INTRODUCTION 
           FIGURE 36 MARKET, BY ELEMENT
           FIGURE 37 SUPPLIERS INVOLVED IN BATTERY ENERGY STORAGE SYSTEM ECOSYSTEM
           FIGURE 38 BATTERY ELEMENT SEGMENT TO HOLD LARGER SHARE OF MARKET DURING FORECAST PERIOD
           TABLE 19 MARKET, BY ELEMENT, 2019–2022 (USD MILLION)
           TABLE 20 MARKET, BY ELEMENT, 2023–2028 (USD MILLION)
    7.2 BATTERY 
           7.2.1 INCREASED USE IN BUILDING SUSTAINABLE AND RESILIENT ENERGY INFRASTRUCTURE TO DRIVE SEGMENT
           FIGURE 39 CRITERIA FOR BATTERY SELECTION
    7.3 OTHER ELEMENTS 
           7.3.1 HARDWARE
                    7.3.1.1 Use in facilitating proper communication of system with users to boost demand
           FIGURE 40 LAYOUT OF BATTERY ENERGY STORAGE SYSTEM
           7.3.2 OTHERS
                    7.3.2.1 Significance in proper functioning of BESS to propel demand
 
8 BATTERY ENERGY STORAGE SYSTEM MARKET, BY BATTERY TYPE (Page No. - 119)
    8.1 INTRODUCTION 
           FIGURE 41 MARKET, BY BATTERY TYPE
           TABLE 21 COMPARISON BETWEEN LITHIUM-ION AND LEAD-ACID BATTERIES
           FIGURE 42 LITHIUM-ION BATTERIES TO BE LARGEST SEGMENT OF MARKET DURING FORECAST PERIOD
           TABLE 22 MARKET, BY BATTERY TYPE, 2019–2022 (USD MILLION)
           TABLE 23 MARKET, BY BATTERY TYPE, 2023–2028 (USD MILLION)
    8.2 LITHIUM-ION BATTERIES 
           8.2.1 PROPERTIES SUCH AS HIGH ENERGY DENSITY AND EFFICIENCY TO DRIVE DEMAND
                    TABLE 24 LITHIUM-ION BATTERIES: MARKET, BY CONNECTION TYPE, 2019–2022 (USD MILLION)
                    TABLE 25 LITHIUM-ION BATTERIES: MARKET, BY CONNECTION TYPE, 2023–2028 (USD MILLION)
                    TABLE 26 LITHIUM-ION BATTERIES: MARKET, BY ENERGY CAPACITY, 2019–2022 (USD MILLION)
                    TABLE 27 LITHIUM-ION BATTERIES: MARKET, BY ENERGY CAPACITY, 2023–2028 (USD MILLION)
                    TABLE 28 LITHIUM-ION BATTERIES: MARKET, BY REGION, 2019–2022 (USD MILLION)
                    TABLE 29 LITHIUM-ION BATTERIES: MARKET, BY REGION, 2023–2028 (USD MILLION)
    8.3 ADVANCED LEAD-ACID BATTERIES 
           8.3.1 EXTENSIVE ADOPTION IN GRID ENERGY STORAGE TO PROPEL DEMAND
                    TABLE 30 ADVANCED LEAD-ACID BATTERIES: BATTERY ENERGY STORAGE SYSTEM MARKET, BY CONNECTION TYPE, 2019–2022 (USD MILLION)
                    TABLE 31 ADVANCED LEAD-ACID BATTERIES: MARKET, BY CONNECTION TYPE, 2023–2028 (USD MILLION)
                    TABLE 32 ADVANCED LEAD-ACID MARKET, BY ENERGY CAPACITY, 2019–2022 (USD MILLION)
                    TABLE 33 ADVANCED LEAD-ACID BATTERIES: MARKET, BY ENERGY CAPACITY, 2023–2028 (USD MILLION)
                    TABLE 34 ADVANCED LEAD-ACID BATTERIES: MARKET, BY REGION, 2019–2022 (USD MILLION)
                    TABLE 35 ADVANCED LEAD-ACID BATTERIES: MARKET, BY REGION, 2023–2028 (USD MILLION)
    8.4 FLOW BATTERIES 
           8.4.1 VARIOUS ADVANTAGES OVER CONVENTIONAL BATTERIES TO BOOST DEMAND
                    TABLE 36 FLOW BATTERIES: BATTERY ENERGY STORAGE SYSTEM MARKET, BY CONNECTION TYPE, 2019–2022 (USD MILLION)
                    TABLE 37 FLOW BATTERIES: MARKET, BY CONNECTION TYPE, 2023–2028 (USD MILLION)
                    TABLE 38 FLOW BATTERIES: MARKET, BY ENERGY CAPACITY, 2019–2022 (USD MILLION)
                    TABLE 39 FLOW BATTERIES: MARKET, BY ENERGY CAPACITY, 2023–2028 (USD MILLION)
                    TABLE 40 FLOW BATTERIES: MARKET, BY REGION, 2019–2022 (USD MILLION)
                    TABLE 41 FLOW BATTERIES: MARKET, BY REGION, 2023–2028 (USD MILLION)
    8.5 OTHERS 
           TABLE 42 OTHERS: BATTERY ENERGY STORAGE SYSTEM MARKET, BY CONNECTION TYPE, 2019–2022 (USD MILLION)
           TABLE 43 OTHERS: MARKET, BY CONNECTION TYPE, 2023–2028 (USD MILLION)
           TABLE 44 OTHERS: MARKET, BY ENERGY CAPACITY, 2019–2022 (USD MILLION)
           TABLE 45 OTHERS: MARKET, BY ENERGY CAPACITY, 2023–2028 (USD MILLION)
           TABLE 46 OTHERS: MARKET, BY REGION, 2019–2022 (USD MILLION)
           TABLE 47 OTHERS: MARKET, BY REGION, 2023–2028 (USD MILLION)
           8.5.1 SODIUM-SULFUR BATTERY
           FIGURE 43 COMPARISON OF SODIUM-SULFUR BATTERIES WITH OTHER BATTERIES
           8.5.2 NICKEL-CADMIUM BATTERY
           8.5.3 NICKEL-METAL HYDRIDE BATTERY
           8.5.4 NICKEL-IRON BATTERY
           8.5.5 FLYWHEEL BATTERY
 
9 BATTERY ENERGY STORAGE SYSTEM MARKET, BY CONNECTION TYPE (Page No. - 135)
    9.1 INTRODUCTION 
           FIGURE 44 IMPORTANCE OF BATTERY ENERGY STORAGE SYSTEMS IN GRID CONNECTION
           FIGURE 45 APPLICATIONS OF BATTERY ENERGY STORAGE SYSTEMS ON GRID
           FIGURE 46 ON-GRID CONNECTION SEGMENT TO REGISTER HIGHER CAGR DURING FORECAST PERIOD
           TABLE 48 MARKET, BY CONNECTION TYPE, 2019–2022 (USD MILLION)
           TABLE 49 MARKET, BY CONNECTION TYPE, 2023–2028 (USD MILLION)
    9.2 ON-GRID CONNECTION 
           9.2.1 SURGE IN GLOBAL ELECTRICITY DEMAND TO BOOST DEMAND
                        FIGURE 47 ON-GRID CONNECTION
                        TABLE 50 ON-GRID: BATTERY ENERGY STORAGE SYSTEM MARKET, BY BATTERY TYPE, 2019–2022 (USD MILLION)
                        TABLE 51 ON-GRID: MARKET, BY BATTERY TYPE, 2023–2028 (USD MILLION)
                        TABLE 52 ON-GRID: MARKET, BY APPLICATION, 2019–2022 (USD MILLION)
                        TABLE 53 ON-GRID: MARKET, BY APPLICATION, 2023–2028 (USD MILLION)
    9.3 OFF-GRID CONNECTION 
           9.3.1 EMERGING ADOPTION IN PROVIDING ENERGY SUPPLY TO REMOTE AREAS TO PROPEL SEGMENT
                        FIGURE 48 BASIC OFF-GRID SYSTEMS
                        TABLE 54 OFF-GRID: MARKET, BY BATTERY TYPE, 2019–2022 (USD MILLION)
                        TABLE 55 OFF-GRID: MARKET, BY BATTERY TYPE, 2023–2028 (USD MILLION)
                        TABLE 56 OFF-GRID: MARKET, BY APPLICATION, 2019–2022 (USD MILLION)
                        TABLE 57 OFF-GRID: MARKET, BY APPLICATION, 2023–2028 (USD MILLION)
 
10 BATTERY ENERGY STORAGE SYSTEM MARKET, BY OWNERSHIP (Page No. - 144)
     10.1 INTRODUCTION 
             FIGURE 49 MARKET, BY OWNERSHIP
             FIGURE 50 UTILITY OWNED SEGMENT TO HOLD LARGEST SHARE DURING FORECAST PERIOD
             TABLE 58 MARKET, BY OWNERSHIP, 2019–2022 (USD MILLION)
             TABLE 59 MARKET, BY OWNERSHIP, 2023–2028 (USD MILLION)
     10.2 CUSTOMER OWNED 
             10.2.1 REDUCED ELECTRICITY COSTS IN RESIDENTIAL APPLICATIONS TO DRIVE ADOPTION
                        FIGURE 51 LAYOUT OF BATTERY ENERGY STORAGE SYSTEM INSTALLATION IN RESIDENTIAL AREA
                        TABLE 60 CUSTOMER OWNED: MARKET, BY APPLICATION, 2019–2022 (USD MILLION)
                        TABLE 61 CUSTOMER OWNED: MARKET, BY APPLICATION, 2023–2028 (USD MILLION)
     10.3 THIRD-PARTY OWNED 
             10.3.1 REDUCTION IN ELECTRICITY BILLS WITH USE OF SOLAR ENERGY SYSTEMS TO PROPEL DEMAND
                        TABLE 62 THIRD-PARTY OWNED: MARKET, BY APPLICATION, 2019–2022 (USD MILLION)
                        TABLE 63 THIRD-PARTY OWNED: MARKET, BY APPLICATION, 2023–2028 (USD MILLION)
     10.4 UTILITY OWNED 
             10.4.1 RISE IN DEMAND FOR RENEWABLE ENERGY SOURCES TO DRIVE SEGMENT
                        TABLE 64 UTILITY OWNED: MARKET, BY APPLICATION, 2019–2022 (USD MILLION)
                        TABLE 65 UTILITY OWNED: MARKET, BY APPLICATION, 2023–2028 (USD MILLION)
 
11 BATTERY ENERGY STORAGE SYSTEM MARKET, BY ENERGY CAPACITY (Page No. - 151)
     11.1 INTRODUCTION 
             FIGURE 52 ENERGY CAPACITY RANGES OF BATTERY ENERGY STORAGE SYSTEMS
             FIGURE 53 BATTERY ENERGY STORAGE SYSTEMS MARKET FOR ABOVE 500 MWH ENERGY CAPACITY TO REGISTER HIGHEST CAGR FROM 2023 TO 2028
             TABLE 66 MARKET, BY ENERGY CAPACITY, 2019–2022 (USD MILLION)
             TABLE 67 MARKET, BY ENERGY CAPACITY, 2023–2028 (USD MILLION)
     11.2 BELOW 100 MWH 
             11.2.1 HIGH DEMAND FROM RESIDENTIAL APPLICATIONS TO FOSTER DEMAND
                        TABLE 68 BELOW 100 MWH: MARKET, BY CONNECTION TYPE, 2019–2022 (USD MILLION)
                        TABLE 69 BELOW 100 MWH: MARKET, BY CONNECTION TYPE, 2023–2028 (USD MILLION)
                        TABLE 70 BELOW 100 MWH: MARKET, BY APPLICATION, 2019–2022 (USD MILLION)
                        TABLE 71 BELOW 100 MWH: MARKET, BY APPLICATION, 2023–2028 (USD MILLION)
     11.3 BETWEEN 100 AND 500 MWH 
             11.3.1 INCREASED ADOPTION TO MANAGE UNCERTAINTIES IN POWER SYSTEMS TO PROPEL DEMAND
                        TABLE 72 BETWEEN 100 MWH AND 500 MWH: MARKET, BY CONNECTION TYPE, 2019–2022 (USD MILLION)
                        TABLE 73 BETWEEN 100 MWH AND 500 MWH: MARKET, BY CONNECTION TYPE, 2023–2028 (USD MILLION)
                        TABLE 74 BETWEEN 100 MWH AND 500 MWH: MARKET, BY APPLICATION, 2019–2022 (USD MILLION)
                        TABLE 75 BETWEEN 100 MWH AND 500 MWH: MARKET, BY APPLICATION, 2023–2028 (USD MILLION)
     11.4 ABOVE 500 MWH 
             11.4.1 EXTENSIVE USE IN SMOOTHENING ENERGY FLUCTUATIONS WHILE SERVING ENERGY DEMANDS TO BOOST ADOPTION
                        TABLE 76 ABOVE 500 MWH: MARKET, BY CONNECTION TYPE, 2019–2022 (USD MILLION)
                        TABLE 77 ABOVE 500 MWH: MARKET, BY CONNECTION TYPE, 2023–2028 (USD MILLION)
                        TABLE 78 ABOVE 500 MWH: MARKET, BY APPLICATION, 2019–2022 (USD MILLION)
                        TABLE 79 ABOVE 500 MWH: MARKET, BY APPLICATION, 2023–2028 (USD MILLION)
 
12 BATTERY ENERGY STORAGE SYSTEM MARKET, BY APPLICATION (Page No. - 159)
     12.1 INTRODUCTION 
             FIGURE 54 MARKET, BY APPLICATION
             FIGURE 55 UTILITY TO BE LARGEST SEGMENT OF MARKET DURING FORECAST PERIOD
             TABLE 80 MARKET, BY APPLICATION, 2019–2022 (USD MILLION)
             TABLE 81 MARKET, BY APPLICATION, 2023–2028 (USD MILLION)
     12.2 RESIDENTIAL 
             12.2.1 GOVERNMENT INITIATIVES ENCOURAGING VARIOUS RESIDENTIAL ENERGY STORAGE PROJECTS TO BOOST DEMAND
                        FIGURE 56 TESLA POWERWALL INSTALLED FOR RESIDENTIAL APPLICATIONS
                        TABLE 82 RESIDENTIAL: BATTERY ENERGY STORAGE SYSTEM MARKET, BY BATTERY TYPE, 2019–2022 (USD MILLION)
                        TABLE 83 RESIDENTIAL: MARKET, BY BATTERY TYPE, 2023–2028 (USD MILLION)
                        TABLE 84 RESIDENTIAL: MARKET, BY CONNECTION TYPE, 2019–2022 (USD MILLION)
                        TABLE 85 RESIDENTIAL: MARKET, BY CONNECTION TYPE, 2023–2028 (USD MILLION)
                        TABLE 86 RESIDENTIAL: MARKET, BY ENERGY CAPACITY, 2019–2022 (USD MILLION)
                        TABLE 87 RESIDENTIAL: MARKET, BY ENERGY CAPACITY, 2023–2028 (USD MILLION)
                        TABLE 88 RESIDENTIAL: MARKET, BY OWNERSHIP, 2019–2022 (USD MILLION)
                        TABLE 89 RESIDENTIAL: MARKET, BY OWNERSHIP, 2023–2028 (USD MILLION)
                        TABLE 90 RESIDENTIAL: MARKET, BY REGION, 2019–2022 (USD MILLION)
                        TABLE 91 RESIDENTIAL: MARKET, BY REGION, 2023–2028 (USD MILLION)
     12.3 COMMERCIAL 
             12.3.1 INCREASED DEMAND FOR UPS SYSTEMS TO PROPEL ADOPTION
                        TABLE 92 COMMERCIAL: BATTERY ENERGY STORAGE SYSTEM MARKET, BY BATTERY TYPE, 2019–2022 (USD MILLION)
                        TABLE 93 COMMERCIAL: MARKET, BY BATTERY TYPE, 2023–2028 (USD MILLION)
                        TABLE 94 COMMERCIAL: MARKET, BY CONNECTION TYPE, 2019–2022 (USD MILLION)
                        TABLE 95 COMMERCIAL: MARKET, BY CONNECTION TYPE, 2023–2028 (USD MILLION)
                        TABLE 96 COMMERCIAL: MARKET, BY ENERGY CAPACITY, 2019–2022 (USD MILLION)
                        TABLE 97 COMMERCIAL: MARKET, BY ENERGY CAPACITY, 2023–2028 (USD MILLION)
                        TABLE 98 COMMERCIAL: MARKET, BY OWNERSHIP, 2019–2022 (USD MILLION)
                        TABLE 99 COMMERCIAL: MARKET, BY OWNERSHIP, 2023–2028 (USD MILLION)
                        TABLE 100 COMMERCIAL: MARKET, BY REGION, 2019–2022 (USD MILLION)
                        TABLE 101 COMMERCIAL: MARKET, BY REGION, 2023–2028 (USD MILLION)
     12.4 UTILITY 
             12.4.1 INCREASED DEMAND FOR RENEWABLE ENERGY SOURCES IN ELECTRIC GRIDS TO DRIVE SEGMENT
                        TABLE 102 UTILITY: BATTERY ENERGY STORAGE SYSTEM MARKET, BY BATTERY TYPE, 2019–2022 (USD MILLION)
                        TABLE 103 UTILITY: MARKET, BY BATTERY TYPE, 2023–2028 (USD MILLION)
                        TABLE 104 UTILITY: MARKET, BY CONNECTION TYPE, 2019–2022 (USD MILLION)
                        TABLE 105 UTILITY: MARKET, BY CONNECTION TYPE, 2023–2028 (USD MILLION)
                        TABLE 106 UTILITY: MARKET, BY ENERGY CAPACITY, 2019–2022 (USD MILLION)
                        TABLE 107 UTILITY: MARKET, BY ENERGY CAPACITY, 2023–2028 (USD MILLION)
                        TABLE 108 UTILITY: MARKET, BY OWNERSHIP, 2019–2022 (USD MILLION)
                        TABLE 109 UTILITY: MARKET, BY OWNERSHIP, 2023–2028 (USD MILLION)
                        TABLE 110 UTILITY: MARKET, BY REGION, 2019–2022 (USD MILLION)
                        TABLE 111 UTILITY: MARKET, BY REGION, 2023–2028 (USD MILLION)
 
13 BATTERY ENERGY STORAGE SYSTEM MARKET, BY REGION (Page No. - 173)
     13.1 INTRODUCTION 
             FIGURE 57 MARKET IN INDIA TO REGISTER HIGHEST CAGR FROM 2023 TO 2028
             TABLE 112 MARKET, BY REGION, 2019–2022 (USD MILLION)
             TABLE 113 MARKET, BY REGION, 2023–2028 (USD MILLION)
     13.2 NORTH AMERICA 
             13.2.1 NORTH AMERICA: RECESSION IMPACT
                        FIGURE 58 NORTH AMERICA: SNAPSHOT OF BATTERY ENERGY STORAGE SYSTEM MARKET
                        TABLE 114 NORTH AMERICA: MARKET, BY APPLICATION, 2019–2022 (USD MILLION)
                        TABLE 115 NORTH AMERICA: MARKET, BY APPLICATION, 2023–2028 (USD MILLION)
                        TABLE 116 NORTH AMERICA: MARKET, BY COUNTRY, 2019–2022 (USD MILLION)
                        TABLE 117 NORTH AMERICA: MARKET, BY COUNTRY, 2023–2028 (USD MILLION)
             13.2.2 US
                        13.2.2.1 Extensive adoption of large-scale systems in power grids to accelerate market
             13.2.3 CANADA
                        13.2.3.1 Increased investments in battery technology to fulfill peak energy demand in urban areas to propel market
             13.2.4 MEXICO
                        13.2.4.1 Increased demand for electricity to drive market
     13.3 EUROPE 
             13.3.1 EUROPE: RECESSION IMPACT
                        FIGURE 59 EUROPE: SNAPSHOT OF BATTERY ENERGY STORAGE SYSTEM MARKET
                        TABLE 118 EUROPE: MARKET, BY APPLICATION, 2019–2022 (USD MILLION)
                        TABLE 119 EUROPE: MARKET, BY APPLICATION, 2023–2028 (USD MILLION)
                        TABLE 120 EUROPE: MARKET, BY COUNTRY, 2019–2022 (USD MILLION)
                        TABLE 121 EUROPE: MARKET, BY COUNTRY, 2023–2028 (USD MILLION)
             13.3.2 GERMANY
                        13.3.2.1 Increased focus on energy storage in residential applications to boost market
             13.3.3 UK
                        13.3.3.1 Rise in government initiatives for energy storage to propel market
             13.3.4 FRANCE
                        13.3.4.1 Increased use of renewable energy resources across sectors to drive market
             13.3.5 REST OF EUROPE
     13.4 ASIA PACIFIC 
             13.4.1 ASIA PACIFIC: RECESSION IMPACT
                        FIGURE 60 ASIA PACIFIC: SNAPSHOT OF BATTERY ENERGY STORAGE SYSTEM MARKET
                        TABLE 122 ASIA PACIFIC: MARKET, BY APPLICATION, 2019–2022 (USD MILLION)
                        TABLE 123 ASIA PACIFIC: MARKET, BY APPLICATION, 2023–2028 (USD MILLION)
                        TABLE 124 ASIA PACIFIC: MARKET, BY COUNTRY, 2019–2022 (USD MILLION)
                        TABLE 125 ASIA PACIFIC: MARKET, BY COUNTRY, 2023–2028 (USD MILLION)
             13.4.2 CHINA
                        13.4.2.1 Increased energy demand and ongoing battery energy storage projects to support market
             13.4.3 JAPAN
                        13.4.3.1 Increased investments in solar and wind energy projects to boost market
             13.4.4 INDIA
                        13.4.4.1 Significant government investments in development of low-cost batteries to drive market
             13.4.5 AUSTRALIA
                        13.4.5.1 Government subsidies for deployment of large-scale battery storage projects to support market
             13.4.6 SOUTH KOREA
                        13.4.6.1 Rise in adoption of battery energy storage systems in electric grids to fuel market
             13.4.7 REST OF ASIA PACIFIC
     13.5 REST OF THE WORLD (ROW) 
             13.5.1 ROW: RECESSION IMPACT
                        TABLE 126 ROW: BATTERY ENERGY STORAGE SYSTEM MARKET, BY APPLICATION, 2019–2022 (USD MILLION)
                        TABLE 127 ROW: MARKET, BY APPLICATION, 2023–2028 (USD MILLION)
                        TABLE 128 ROW: MARKET, BY REGION, 2019–2022 (USD MILLION)
                        TABLE 129 ROW: MARKET, BY REGION, 2023–2028 (USD MILLION)
             13.5.2 SOUTH AMERICA
                        13.5.2.1 Rise in government investments to deploy renewable energy to support market
             13.5.3 MIDDLE EAST & AFRICA
                        13.5.3.1 Increased adoption due to growth of manufacturing sector to propel market
 
14 COMPETITIVE LANDSCAPE (Page No. - 198)
     14.1 OVERVIEW 
     14.2 STRATEGIES ADOPTED BY KEY PLAYERS 
             TABLE 130 KEY DEVELOPMENTS IN BATTERY ENERGY STORAGE SYSTEM MARKET
     14.3 REVENUE ANALYSIS OF TOP COMPANIES 
             FIGURE 61 FIVE-YEAR REVENUE ANALYSIS OF TOP 5 PLAYERS IN MARKET
     14.4 MARKET SHARE ANALYSIS 
             TABLE 131 MARKET SHARE ANALYSIS (2022)
             FIGURE 62 MARKET: SHARE OF KEY PLAYERS
     14.5 COMPETITIVE EVALUATION QUADRANT 
             14.5.1 STARS
             14.5.2 EMERGING LEADERS
             14.5.3 PERVASIVE PLAYERS
             14.5.4 PARTICIPANTS
                        FIGURE 63 BATTERY ENERGY STORAGE SYSTEM MARKET (GLOBAL): COMPETITIVE EVALUATION QUADRANT, 2022
     14.6 SMALL AND MEDIUM-SIZED ENTERPRISES (SMES) EVALUATION QUADRANT 
             14.6.1 PROGRESSIVE COMPANIES
             14.6.2 RESPONSIVE COMPANIES
             14.6.3 DYNAMIC COMPANIES
             14.6.4 STARTING BLOCKS
                        FIGURE 64 MARKET (GLOBAL): SME EVALUATION QUADRANT, 2022
     14.7 BATTERY ENERGY STORAGE SYSTEM MARKET: COMPANY FOOTPRINT 
             TABLE 132 COMPANY FOOTPRINT
             TABLE 133 COMPANY FOOTPRINT: APPLICATION
             TABLE 134 COMPANY FOOTPRINT: REGION
     14.8 COMPETITIVE BENCHMARKING 
             TABLE 135 MARKET: LIST OF KEY STARTUPS/SMES
             TABLE 136 MARKET: COMPETITIVE BENCHMARKING OF KEY STARTUPS/SMES
     14.9 COMPETITIVE SCENARIO 
             TABLE 137 MARKET: PRODUCT LAUNCHES, 2021–2022
             TABLE 138 MARKET: DEALS, 2021–2023
             TABLE 139 MARKET: OTHERS, 2022
 
15 COMPANY PROFILES (Page No. - 217)
     15.1 KEY PLAYERS 
(Business Overview, Products Offered, Recent Developments, and MnM View)*  
             15.1.1 BYD COMPANY LIMITED
                        TABLE 140 BYD COMPANY LIMITED: BUSINESS OVERVIEW
                        FIGURE 65 BYD COMPANY LIMITED: COMPANY SNAPSHOT
                        TABLE 141 BYD COMPANY LIMITED: PRODUCTS OFFERED
                        TABLE 142 BYD COMPANY LIMITED: DEALS
             15.1.2 LG ENERGY SOLUTIONS CO., LTD.
                        TABLE 143 LG ENERGY SOLUTIONS CO., LTD.: BUSINESS OVERVIEW
                        FIGURE 66 LG ENERGY SOLUTIONS CO., LTD.: COMPANY SNAPSHOT
                        TABLE 144 LG ENERGY SOLUTIONS CO., LTD.: PRODUCTS OFFERED
                        TABLE 145 LG ENERGY SOLUTIONS CO., LTD.: DEALS
             15.1.3 PANASONIC CORPORATION
                        TABLE 146 PANASONIC CORPORATION: BUSINESS OVERVIEW
                        FIGURE 67 PANASONIC CORPORATION: COMPANY SNAPSHOT
                        TABLE 147 PANASONIC CORPORATION: PRODUCTS OFFERED
                        TABLE 148 PANASONIC CORPORATION: PRODUCT LAUNCHES
                        TABLE 149 PANASONIC CORPORATION: DEALS
             15.1.4 SAMSUNG SDI CO., LTD.
                        TABLE 150 SAMSUNG SDI CO., LTD.: BUSINESS OVERVIEW
                        FIGURE 68 SAMSUNG SDI CO., LTD.: COMPANY SNAPSHOT
                        TABLE 151 SAMSUNG SDI CO., LTD.: PRODUCTS OFFERED
                        TABLE 152 SAMSUNG SDI CO., LTD.: PRODUCT LAUNCHES
             15.1.5 TESLA, INC.
                        TABLE 153 TESLA, INC.: BUSINESS OVERVIEW
                        FIGURE 69 TESLA, INC.: COMPANY SNAPSHOT
                        TABLE 154 TESLA, INC.: PRODUCTS OFFERED
                        TABLE 155 TESLA, INC.: PRODUCT LAUNCHES
             15.1.6 ABB
                        TABLE 156 ABB: BUSINESS OVERVIEW
                        FIGURE 70 ABB: COMPANY SNAPSHOT
                        TABLE 157 ABB: PRODUCTS OFFERED
                        TABLE 158 ABB: DEALS
             15.1.7 AEG POWER SOLUTIONS
                        TABLE 159 AEG POWER SOLUTIONS: BUSINESS OVERVIEW
                        TABLE 160 AEG POWER SOLUTIONS: PRODUCTS OFFERED
                        TABLE 161 AEG POWER SOLUTIONS: DEALS
             15.1.8 DELTA ELECTRONICS INC.
                        TABLE 162 DELTA ELECTRONICS INC.: BUSINESS OVERVIEW
                        FIGURE 71 DELTA ELECTRONICS INC.: COMPANY SNAPSHOT
                        TABLE 163 DELTA ELECTRONICS INC.: PRODUCTS OFFERED
             15.1.9 GENERAL ELECTRIC
                        TABLE 164 GENERAL ELECTRIC: BUSINESS OVERVIEW
                        FIGURE 72 GENERAL ELECTRIC: COMPANY SNAPSHOT
                        TABLE 165 GENERAL ELECTRIC: PRODUCTS OFFERED
                        TABLE 166 GENERAL ELECTRIC: PRODUCT LAUNCHES
                        TABLE 167 GENERAL ELECTRIC: DEALS
                        TABLE 168 GENERAL ELECTRIC: OTHERS
             15.1.10 HITACHI, LTD.
                        TABLE 169 HITACHI, LTD.: BUSINESS OVERVIEW
                        FIGURE 73 HITACHI, LTD.: COMPANY SNAPSHOT
                        TABLE 170 HITACHI, LTD.: PRODUCTS OFFERED
                        TABLE 171 HITACHI, LTD.: DEALS
             15.1.11 HONEYWELL INTERNATIONAL, INC.
                        TABLE 172 HONEYWELL INTERNATIONAL, INC.: BUSINESS OVERVIEW
                        FIGURE 74 HONEYWELL INTERNATIONAL, INC.: COMPANY SNAPSHOT
                        TABLE 173 HONEYWELL INTERNATIONAL, INC: PRODUCTS OFFERED
                        TABLE 174 HONEYWELL INTERNATIONAL, INC.: PRODUCT LAUNCHES
                        TABLE 175 HONEYWELL INTERNATIONAL, INC.: DEALS
             15.1.12 NEC CORPORATION
                        TABLE 176 NEC CORPORATION: BUSINESS OVERVIEW
                        FIGURE 75 NEC CORPORATION: COMPANY SNAPSHOT
                        TABLE 177 NEC CORPORATION: PRODUCTS OFFERED
             15.1.13 NGK INSULATORS, LTD.
                        TABLE 178 NGK INSULATORS, LTD.: BUSINESS OVERVIEW
                        FIGURE 76 NGK INSULATORS, LTD.: COMPANY SNAPSHOT
                        TABLE 179 NGK INSULATORS, LTD.: PRODUCTS OFFERED
             15.1.14 SIEMENS AG
                        TABLE 180 SIEMENS AG: BUSINESS OVERVIEW
                        FIGURE 77 SIEMENS AG: COMPANY SNAPSHOT
                        TABLE 181 SIEMENS AG: PRODUCTS OFFERED
                        TABLE 182 SIEMENS AG: PRODUCT LAUNCHES
             15.1.15 TOSHIBA CORPORATION
                        TABLE 183 TOSHIBA CORPORATION: BUSINESS OVERVIEW
                        FIGURE 78 TOSHIBA CORPORATION: COMPANY SNAPSHOT
                        TABLE 184 TOSHIBA CORPORATION: PRODUCTS OFFERED
                        TABLE 185 TOSHIBA CORPORATION: PRODUCT LAUNCHES
                        TABLE 186 TOSHIBA CORPORATION: DEALS
     * Business Overview, Products Offered, Recent Developments, and MnM View might not be captured in case of unlisted companies.  
     15.2 OTHER PLAYERS 
             15.2.1 EAST PENN MANUFACTURING COMPANY
             15.2.2 ENERDEL, INC.
             15.2.3 EXERGONIX
             15.2.4 JOHNSON CONTROLS
             15.2.5 NEXTERA ENERGY, INC.
             15.2.6 PARKER HANNIFIN CORP
             15.2.7 PRIMUS POWER
             15.2.8 SOLAREDGE
             15.2.9 THE AES CORPORATION
             15.2.10 TRINABESS
 
16 ADJACENT MARKETS (Page No. - 270)
     16.1 SOLID-STATE BATTERY MARKET 
             16.1.1 INTRODUCTION
                        FIGURE 79 SOLID-STATE BATTERY MARKET, BY TYPE
                        TABLE 187 SOLID-STATE BATTERY MARKET, BY TYPE, 2017–2021 (USD MILLION)
                        TABLE 188 SOLID-STATE BATTERY MARKET, BY TYPE, 2022–2028 (USD MILLION)
             16.1.2 SINGLE-CELL BATTERY
                        16.1.2.1 Single-cell battery technology well-adopted in medical devices
                                     TABLE 189 SINGLE-CELL SOLID-STATE BATTERY MARKET, BY APPLICATION, 2017–2021 (USD MILLION)
                                     TABLE 190 SINGLE-CELL SOLID-STATE BATTERY MARKET, BY APPLICATION, 2022–2028 (USD MILLION)
             16.1.3 MULTI-CELL BATTERY
                        16.1.3.1 Multi-cell battery most trending battery technology for electric vehicles due to its high power density
                                     TABLE 191 MULTI-CELL SOLID-STATE BATTERY MARKET, BY APPLICATION, 2017–2021 (USD MILLION)
                                     TABLE 192 MULTI-CELL SOLID-STATE BATTERY MARKET, BY APPLICATION, 2022–2028 (USD MILLION)
     16.2 SOLID-STATE BATTERY MARKET, BY RECHARGEABILITY 
             16.2.1 INTRODUCTION
                        FIGURE 80 SOLID-STATE BATTERY MARKET, BY RECHARGEABILITY
                        FIGURE 81 MARKET FOR SECONDARY SOLID-STATE BATTERY TO GROW AT HIGHER CAGR DURING 2022–2028
                        TABLE 193 SOLID-STATE BATTERY MARKET, BY RECHARGEABILITY, 2017–2021 (USD MILLION)
                        TABLE 194 SOLID-STATE BATTERY MARKET, BY RECHARGEABILITY, 2022–2028 (USD MILLION)
             16.2.2 PRIMARY BATTERY
                        16.2.2.1 Primary solid-state batteries to hold larger share of market during forecast period
                                     TABLE 195 PRIMARY SOLID-STATE BATTERY MARKET, BY APPLICATION, 2017–2021 (USD MILLION)
                                     TABLE 196 PRIMARY SOLID-STATE BATTERY MARKET, BY APPLICATION, 2022–2028 (USD MILLION)
             16.2.3 SECONDARY BATTERY
                        16.2.3.1 Secondary solid-state batteries to witness higher growth rate during forecast period
                                     TABLE 197 SECONDARY SOLID-STATE BATTERY MARKET, BY APPLICATION, 2017–2021 (USD MILLION)
                                     TABLE 198 SECONDARY SOLID-STATE BATTERY MARKET, BY APPLICATION, 2022–2028 (USD MILLION)
 
17 APPENDIX (Page No. - 280)
     17.1 INSIGHTS FROM INDUSTRY EXPERTS 
     17.2 DISCUSSION GUIDE 
     17.3 KNOWLEDGESTORE: MARKETSANDMARKETS’ SUBSCRIPTION PORTAL 
     17.4 CUSTOMIZATION OPTIONS 
     17.5 RELATED REPORTS 
     17.6 AUTHOR DETAILS 


The study involves four major activities that estimate the size of the battery energy storage system market. Exhaustive secondary research was conducted to collect information related to the market. Following this was validating these findings, assumptions, and sizing with the industry experts across the value chain through primary research. Both top-down and bottom-up approaches were employed to estimate the overall size of the battery energy storage system market. Subsequently, market breakdown and data triangulation procedures were used to determine the extent of different segments and subsegments of the market.

Secondary Research

Secondary sources in this research study include corporate filings (such as annual reports, investor presentations, and financial statements); trade, business, and professional associations; white papers, certified publications, articles from recognized authors; directories; and databases. The secondary data were collected and analyzed to estimate the overall market size, further validated by primary research.

Primary Research

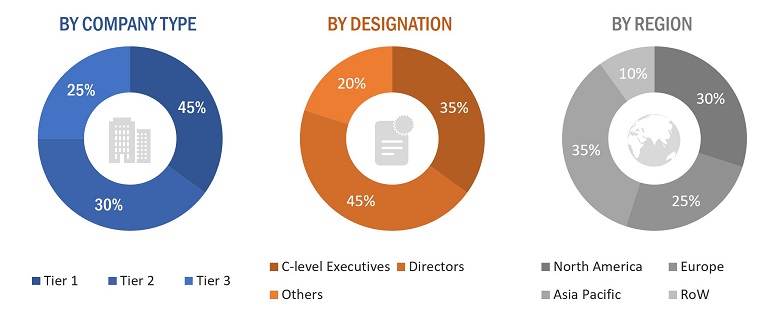
In the primary research process, numerous sources from both supply and demand sides were interviewed to obtain qualitative and quantitative information about this report. The primary sources from the supply-side included various industry experts such as Chief X Officers (CXOs), Vice Presidents (VPs), and Directors from business development, marketing, product development/innovation teams, and related key executives from battery energy storage system providers, such as BYD Company Limited (China), SAMSUNG SDI Co., Ltd. (South Korea), LG Energy Solutions Co., Ltd. (South Korea), and Panasonic Corporation (Japan).; research organizations, distributors, professional and managed service providers, industry associations, and key opinion leaders. Approximately 25% of the primary interviews were conducted with the demand side and 75% with the supply side. These data were collected mainly through questionnaires, emails, and telephonic interviews, accounting for 80% of the primary interviews.
Battery Energy Storage Market Size, and Share

To know about the assumptions considered for the study, download the pdf brochure

Market Size Estimation

In the market engineering process, both top-down and bottom-up approaches were implemented, along with several data triangulation methods, to estimate and validate the size of the battery energy storage system market and other dependent submarkets listed in this report.

  • The key players in the industry and markets were identified through extensive secondary research.
  • Both the supply chain of the industry and the market size, in terms of value, were determined through primary and secondary research.
  • All percentage shares, splits, and breakdowns were determined using secondary sources and verified through primary sources.

Market Size Estimation Methodology-Bottom-up Approach

Battery Energy Storage Market Size, and Share

Data Triangulation

After estimating the overall market size, the total market was split into several segments. The market breakdown and data triangulation procedures were employed wherever applicable to complete the overall market engineering process and gauge exact statistics for all segments. The data were triangulated by studying various factors and trends from both the demand and supply sides. The market was also validated using both top-down and bottom-up approaches.

Market Definition

A battery energy storage system is embedded with a rechargeable battery in the form of battery packs and modules. The system stores energy from solar arrays, wind, or the electric grid and then discharges that energy later to provide electricity or other grid services when needed. Rechargeable batteries are usually expensive and have less environmental impact than non-rechargeable (disposable) batteries. However, rechargeable batteries incur a high upfront cost as they can be charged several times after the initial purchase. Battery energy storage systems are used in low-peak periods to store surplus energy and provide this energy to the end users during the time of high peak demand for electricity.

Stakeholders

  • Government bodies and policymakers
  • Industry organizations, forums, alliances, and associations
  • Market research and consulting firms
  • Raw material suppliers and distributors
  • Research institutes and organizations
  • Original equipment manufacturers (OEMs) of battery energy storage systems
  • Traders and suppliers
  • Battery energy storage system manufacturers
  • Energy storage solutions and service providers
  • Energy storage research institutions
  • Government and research organizations
  • Grid operators
  • Retail service providers
  • Lithium-ion battery, electrochemical capacitor, and other energy storage products manufacturers
  • Utility providers
  • Power distribution and IT consultants
  • Research organizations and consulting companies
  • Technology investors
  • Technology standard organizations, forums, alliances, and associations
  • Associations and industrial bodies
  • End-user industries
  • Power bank manufacturers
  • Power bank traders and suppliers

The main objectives of this study are as follows:

  • To define, describe, and forecast the battery energy storage system market based on input energy sources, storage system, element, battery type, connection type, ownership, energy capacity, and application
  • To describe and forecast the size of the battery energy storage system market based on four regions, namely, North America, Europe, Asia Pacific, and the Rest of the World (RoW), along with their respective countries
  • To provide detailed information regarding factors (drivers, restraints, opportunities, and challenges) influencing the market growth
  • To provide a detailed overview of the process flow of the battery energy storage system market
  • To analyze opportunities for stakeholders by identifying high-growth segments of the battery energy storage system market
  • To study the complete value chain of the battery energy storage system market
  • To strategically analyze micromarkets1 with respect to individual growth trends, prospects, and contributions to the overall market size
  • To strategically profile the key players and comprehensively analyze their market positions in terms of their ranking and core competencies2, along with detailing the competitive landscape for market leaders
  • To analyze competitive developments, such as product launches, acquisitions, collaborations, agreements, and partnerships, in the battery energy storage system market

Available Customizations:

With the given market data, MarketsandMarkets offer customizations according to the specific requirements of companies. The following customization options are available for the report:

Country-wise Information:

  • Analysis for additional countries (up to five)

Company Information:

  • Detailed analysis and profiling of different market players (up to five)
Custom Market Research Services

We will customize the research for you, in case the report listed above does not meet with your exact requirements. Our custom research will comprehensively cover the business information you require to help you arrive at strategic and profitable business decisions.

Request Customization

Instant Answers with GPT - Ask Now!

Ask real questions. Get complete answers !
Report Code
SE 4200
Published ON
Jun, 2023
Choose License Type
BUY NOW
  • SHARE
X
Request Customization
Speak to Analyst
Speak to Analyst
OR FACE-TO-FACE MEETING
PERSONALIZE THIS RESEARCH
  • Triangulate with your Own Data
  • Get Data as per your Format and Definition
  • Gain a Deeper Dive on a Specific Application, Geography, Customer or Competitor
  • Any level of Personalization
REQUEST A FREE CUSTOMIZATION
LET US HELP YOU!
  • What are the Known and Unknown Adjacencies Impacting the Battery Energy Storage System Market
  • What will your New Revenue Sources be?
  • Who will be your Top Customer; what will make them switch?
  • Defend your Market Share or Win Competitors
  • Get a Scorecard for Target Partners
CUSTOMIZED WORKSHOP REQUEST
+1-888-600-6441
  • Call Us
  • +1-888-600-6441 (Corporate office hours)
  • +1-888-600-6441 (US/Can toll free)
  • +44-800-368-9399 (UK office hours)
CONNECT WITH US
ABOUT TRUST ONLINE
©2024 MarketsandMarkets Research Private Ltd. All rights reserved
DMCA.com Protection Status Website Feedback