Battery Recycling Market

Battery Recycling Market by Source (Automotive Batteries, Industrial Batteries, Consumer & Electronic Appliance Batteries), Chemistry (Lead Acid, Lithium-based, Nickel-based), Material (Metals, Electrolyte, Plastics) and Region - Global Forecast to 2030

Report Code: CH 5182 Jun, 2023, by marketsandmarkets.com

Battery Recycling Market

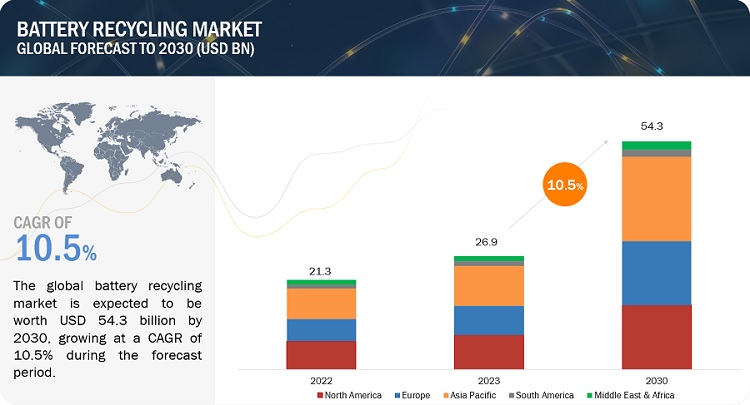
The global battery recycling market is valued at USD 26.9 billion in 2023 and is projected to reach USD 54.3 billion by 2030, growing at 10.5% cagr during the forecast period. The market has observed stable growth throughout the study period and is anticipated to continue with the same trend during the forecast period. Rising investments in the development of electric vehicles, stringent EPA guidelines, and government regulations & initiatives to encourage battery recycling are expected to drive the growth of the market in the upcoming years.

Attractive Opportunities in the Battery Recycling Market
Battery Recycling Market

To know about the assumptions considered for the study, Request for Free Sample Report
Battery Recycling Market

Battery Recycling Market Dynamics

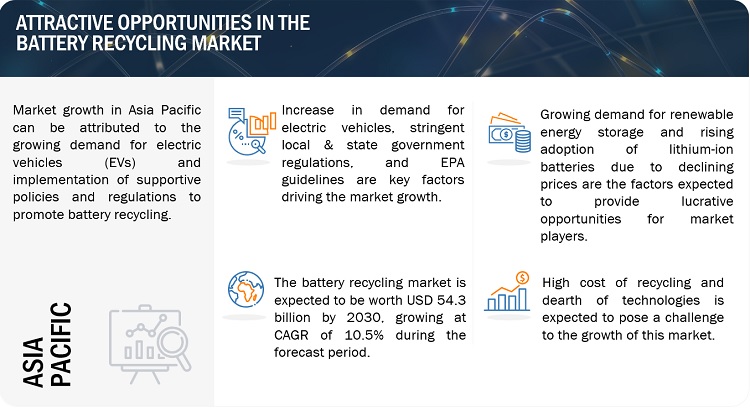
Driver: Increase in demand for electric vehicles

Shifting consumer preference towards more sustainable and environmentally friendly transportation alternatives is propelling the demand for electric vehicles. Also, the use of electric vehicles is increasing owing to factors such as energy efficiency, and pollution control that are driving up the adoption of batteries. The development of advanced battery technologies, improvements in energy density, charging capabilities, and minimal maintenance requirements are other factors contributing to the growth of electric vehicles. Hence, it is anticipated that the market for battery recycling would continue to expand as a result of the growing use of electric vehicles.

Restraint: Safety issues related to the storage and transportation of spent batteries

Spent batteries contain various hazardous materials including acids and heavy metals such as mercury and lead that can be harmful to human health and the environment. Improper storage or transportation can result in chemical leakage, leading to the release of toxic substances. Owing to these issues, state or federal governments restrict the transportation and storage of spent batteries.

Opportunity: Rising demand for renewable energy storage

The renewable energy sector, including solar and wind power, is witnessing rapid expansion. Most of the renewable energy storage systems utilize batteries such as lithium-ion, lead acid, and sodium-sulfur, to perform essential operations. Therefore, with the rise in renewable energy installations, there is a corresponding need for battery recycling to manage the end-of-life batteries and extract valuable materials for reuse.

Challenge: High cost of recycling and dearth of technologies

High cost of recycling and the dearth of technologies can pose a significant challenge for the battery recycling industry. The recycling of batteries involves a number of time-consuming and expensive phases, including collecting, sorting, disassembly, and the extraction of valuable materials including nickel, cobalt, lithium, and rare earth metals. The expense is further increased by the need to ensure safe handling and disposal of hazardous compounds found in batteries. The lack of efficient battery recycling methods is another problem. It is crucial to create scalable and effective procedures which can manage multiple battery types, including different chemistries. Additionally, recycling techniques must advance along with battery technology in order to efficiently recover valuable materials and reduce waste. Thus, investment in R&D for efficient battery recycling technologies is necessary to meet these challenges.

Battery Recycling Market Ecosystem

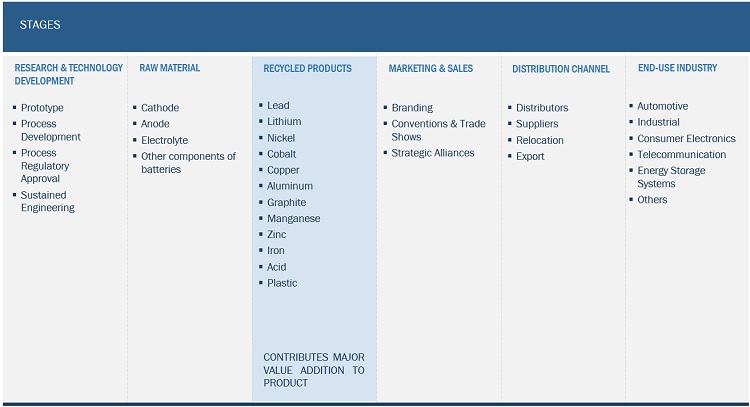
Prominent companies in this market include well-established, and financially stable recyclers of batteries. These companies have been operating in the market for several years and possess a diversified product portfolio and strong global sales and marketing networks. Prominent companies in this market include Call2Recycle, Inc. (US), Cirba Solutions (US), Element Resources (US), Umicore (Belgium), Contemporary Amperex Technology Co., Limited (China), and Exide Industries Ltd. (India).
Battery Recycling Market Ecosystem

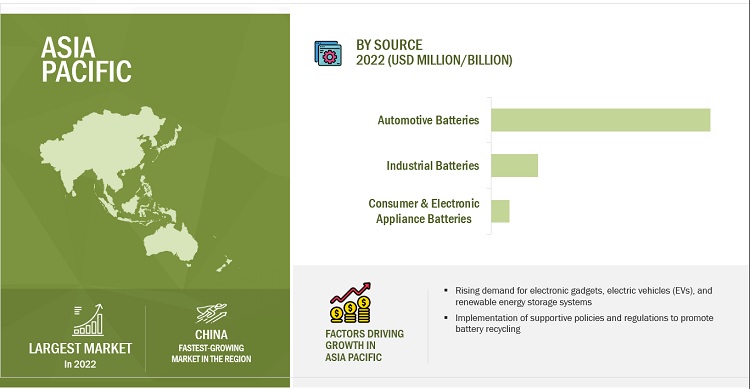
Based on source, the automotive batteries segment is projected to account for the largest share in 2023.

The automotive batteries segment is estimated to have the largest share of the global battery recycling market in 2023. The global market for automotive battery recycling is significantly being driven by the rising popularity of electric vehicles. The quantity of used batteries that need proper disposal and recycling is increasing along with the growth in EV sales. A sustainable infrastructure for end-of-life battery management and recycling is required as more people switch to electric vehicles, which will further boost the growth of this segment.

Based on chemistry, the lead acid batteries segment is projected to account for the largest share in 2023.

The lead acid batteries segment is estimated to have the largest share of the global battery recycling market in 2023. Lead acid batteries are categorized as hazardous waste as they contain lead and sulfuric acid. Proper management and recycling of lead acid batteries helps control the potential environmental and health risks associated with improper disposal. The growth of this segment can be attributed to the rising need for recycling facilities to handle hazardous materials and lower the possibility of pollution and contamination.

Based on region, Asia Pacific region is projected to account for the largest share in 2023.

Due to the expanding population, industrialization, urbanization, and rising demand for electronic gadgets, electric vehicles (EVs), and renewable energy storage systems, battery consumption is on the rise in the Asia Pacific region. Because of this increased battery use, there is a critical need for efficient battery recycling to handle the rising number of used batteries and reduce their negative effects on the environment. The growth is further aided by the implementation of supportive policies and regulations to promote battery recycling.
Battery Recycling Market by Region

To know about the assumptions considered for the study, download the pdf brochure

Battery Recycling Market Players

ACCUREC Recycling GmbH (Germany), American Battery Technology Company (US), Aqua Metals, Inc. (US), Call2Recycle, Inc. (US), Cirba Solutions (US), Contemporary Amperex Technology Co., Limited (China), East Penn Manufacturing Company (US), Ecobat (US), Element Resources (US), EnerSys (US), Exide Industries Ltd. (India), Fortum (Finland), GEM Co., Ltd. (China), Glencore (Switzerland), Gopher Resource (US), Gravita India Limited (India), Li-Cycle Corp. (Canada), Neometals Ltd. (Australia), Raw Materials Company (Canada), RecycLiCo Battery Materials Inc. (Canada), Redwood Materials Inc. (US), Shenzhen Highpower Technology Co., Ltd. (China), Stena Recycling (Sweden), TES (Singapore), Terrapure (Canada), The Doe Run Company (US), The International Metals Reclamation Company (US),  and Umicore (Belgium), and others are among the major players leading the market through their innovative offerings, enhanced recycling capacities, and efficient distribution channels.

Battery Recycling Market Report Scope

Report Metric

Details

Market Size Value in 2023

USD 26.9 billion

Revenue Forecast in 2030

USD 54.3 billion

CAGR

10.5%

Market Size Available for Years

2018 to 2030

Base Year Considered

2022

Forecast Period

2023–2030

Forecast Units

Value (USD Million/Billion)

Segments Covered

Recycling Process, Processing State, Material, Source, Chemistry, and Region

Geographies Covered

Europe, Asia Pacific, North America, South America, and the Middle East & Africa

Companies Covered

The major market players include ACCUREC Recycling GmbH (Germany), American Battery Technology Company (US), Aqua Metals, Inc. (US), Call2Recycle, Inc. (US), Cirba Solutions (US), Contemporary Amperex Technology Co., Limited (China), East Penn Manufacturing Company (US), Ecobat (US), Element Resources (US), EnerSys (US), Exide Industries Ltd. (India), Fortum (Finland), GEM Co., Ltd. (China), Glencore (Switzerland), Gopher Resource (US), Gravita India Limited (India), Li-Cycle Corp. (Canada), Neometals Ltd. (Australia), Raw Materials Company (Canada), RecycLiCo Battery Materials Inc. (Canada), Redwood Materials Inc. (US), Shenzhen Highpower Technology Co., Ltd. (China), Stena Recycling (Sweden), TES (Singapore), Terrapure (Canada), The Doe Run Company (US), The International Metals Reclamation Company (US),  and Umicore (Belgium), and others

This research report categorizes the battery recycling market based on recycling processes, processing state, material, source, chemistry, and region.

Based on recycling process, the battery recycling market industry has been segmented as follows:
  • Hydrometallurgical Process
  • Pyrometallurgical Process
  • Lead Acid Battery Recycling Process
  • Lithium-ion Battery Recycling Process
Based on processing state, the battery recycling market has been segmented as follows:
  • Extraction Of Material
  • Reuse, Repackaging, & Second Life
  • Disposal
Based on material, the battery recycling market industry has been segmented as follows:
Based on source, the battery recycling market has been segmented as follows:
  • Automotive Batteries
  • Industrial Batteries
  • Consumer & electric appliance Batteries
Based on chemistry, the battery recycling market industry has been segmented as follows:
  • Lead Acid Batteries
  • Lithium-based Batteries
  • Nickel-based Batteries
  • Others
Based on the region, the battery recycling market has been segmented as follows:
  • Asia Pacific
    • Australia
    • China
    • India
    • Indonesia
    • Japan
    • Malaysia
    • South Korea
    • Taiwan
    • Thailand
    • Rest of Asia Pacific
  • Europe
    • France
    • Germany
    • Italy
    • Netherlands
    • Spain
    • UK
    • Rest of Europe
  • North America
    • US
    • Canada
    • Mexico
  • Middle East & Africa
    • South Africa
    • Saudi Arabia
    • UAE
    • Egypt
    • Rest of Middle East & Africa
  • South America
    • Brazil
    • Argentina
    • Chile
    • Reast of South America

Recent Developments

  • In April 2023, Cirba Solutions signed a Memorandum of Understanding (MoU) with Honda to collect, process, and return recycled battery materials to be used as raw material for Honda’s battery supply chain for application in future EV batteries.
  • In February 2023, Contemporary Amperex Technology Co., Limited, Mercedes-Benz, and GEM Co., Ltd. signed a memorandum of understanding for the recycling of cobalt, nickel, manganese, and lithium metals from spent EV batteries of Mercedes-Benz and remanufacture them into battery cathode materials.
  • In January 2023, Aqua Metals, Inc. announced its plans to develop a lithium battery recycling facility in Nevada (US), which can process more than 20 million pounds of lithium-ion batteries per year.

Frequently Asked Questions (FAQ):

To speak to our analyst for a discussion on the above findings, click Speak to Analyst

TABLE OF CONTENTS
 
1 INTRODUCTION (Page No. - 33)
    1.1 STUDY OBJECTIVES 
    1.2 MARKET DEFINITION 
           1.2.1 INCLUSIONS AND EXCLUSIONS
                    TABLE 1 BATTERY RECYCLING MARKET: INCLUSIONS AND EXCLUSIONS
    1.3 MARKET SCOPE 
          FIGURE 1 BATTERY RECYCLING MARKET SEGMENTATION
           1.3.1 REGIONAL SCOPE
           1.3.2 YEARS CONSIDERED
    1.4 CURRENCY CONSIDERED 
    1.5 UNITS CONSIDERED 
    1.6 LIMITATIONS 
    1.7 STAKEHOLDERS 
    1.8 SUMMARY OF CHANGES 
 
2 RESEARCH METHODOLOGY (Page No. - 38)
    2.1 RESEARCH DATA 
          FIGURE 2 BATTERY RECYCLING MARKET: RESEARCH DESIGN
           2.1.1 SECONDARY DATA
                    2.1.1.1 Key data from secondary sources
           2.1.2 PRIMARY DATA
                    2.1.2.1 Key data from primary sources
                    2.1.2.2 Participating companies for primary research
                    2.1.2.3 Breakdown of primary interviews
                    2.1.2.4 Key industry insights
    2.2 MATRIX CONSIDERED FOR ASSESSING DEMAND 
          FIGURE 3 MAIN MATRIX CONSIDERED FOR ASSESSING DEMAND FOR BATTERY RECYCLING
    2.3 MARKET SIZE ESTIMATION 
           2.3.1 BOTTOM-UP APPROACH
                    FIGURE 4 MARKET SIZE ESTIMATION: BOTTOM-UP APPROACH
           2.3.2 TOP-DOWN APPROACH
                    FIGURE 5 MARKET SIZE ESTIMATION: TOP-DOWN APPROACH
    2.4 METHODOLOGY FOR SUPPLY-SIDE SIZING OF BATTERY RECYCLING MARKET (1/2) 
    2.5 METHODOLOGY FOR SUPPLY-SIDE SIZING OF BATTERY RECYCLING MARKET (2/2) 
           2.5.1 CALCULATIONS BASED ON SUPPLY-SIDE ANALYSIS
           2.5.2 GROWTH RATE ASSUMPTIONS/GROWTH FORECAST
    2.6 MARKET BREAKDOWN AND DATA TRIANGULATION 
          FIGURE 6 BATTERY RECYCLING MARKET: DATA TRIANGULATION
    2.7 IMPACT OF RECESSION 
    2.8 RESEARCH ASSUMPTIONS 
    2.9 RESEARCH LIMITATIONS 
    2.10 RISK ANALYSIS 
 
3 EXECUTIVE SUMMARY (Page No. - 49)
    TABLE 2 BATTERY RECYCLING MARKET SNAPSHOT: 2023 VS. 2030
    FIGURE 7 AUTOMOTIVE BATTERIES SEGMENT TO HOLD LARGEST MARKET SHARE DURING FORECAST PERIOD
    FIGURE 8 EUROPE TO WITNESS HIGHEST CAGR DURING FORECAST PERIOD
 
4 PREMIUM INSIGHTS (Page No. - 52)
    4.1 ATTRACTIVE OPPORTUNITIES IN BATTERY RECYCLING MARKET 
          FIGURE 9 HIGH OUTPUT OF SPENT BATTERIES FROM ELECTRIC VEHICLES TO DRIVE BATTERY RECYCLING MARKET
    4.2 BATTERY RECYCLING MARKET, BY REGION 
          FIGURE 10 ASIA PACIFIC SEGMENT TO ACCOUNT FOR LARGEST SHARE DURING  FORECAST PERIOD
    4.3 BATTERY RECYCLING MARKET, BY SOURCE 
          FIGURE 11 AUTOMOTIVE BATTERIES TO REGISTER HIGHEST CAGR FROM 2023 TO 2030
    4.4 BATTERY RECYCLING MARKET, BY CHEMISTRY 
          FIGURE 12 LITHIUM-BASED SEGMENT TO HOLD LARGEST MARKET SHARE DURING FORECAST PERIOD
 
5 MARKET OVERVIEW (Page No. - 54)
    5.1 MARKET DYNAMICS 
          FIGURE 13 DRIVERS, RESTRAINTS, OPPORTUNITIES, AND CHALLENGES IN BATTERY RECYCLING MARKET
           5.1.1 DRIVERS
                    5.1.1.1 Increasing demand for electric vehicles
                    5.1.1.2 Stringent government regulations and EPA guidelines
                    5.1.1.3 Rising demand for recycled products and materials
                    5.1.1.4 Increasing awareness of resource conservation
           5.1.2 RESTRAINTS
                    5.1.2.1 Safety issues related to storage and transportation of spent batteries
           5.1.3 OPPORTUNITIES
                    5.1.3.1 Growing demand for renewable energy storage
                    5.1.3.2 Increasing adoption of lithium-ion batteries due to decline in price
           5.1.4 CHALLENGES
                    5.1.4.1 High cost of recycling and dearth of technologies
    5.2 VALUE CHAIN ANALYSIS 
          FIGURE 14 VALUE CHAIN ANALYSIS OF BATTERY RECYCLING MARKET
    5.3 ECOSYSTEM MAP 
          FIGURE 15 ECOSYSTEM MAP OF BATTERY RECYCLING MARKET
          TABLE 3 ECOSYSTEM OF BATTERY RECYCLING MARKET
    5.4 PORTER'S FIVE FORCES MODEL 
           5.4.1 PORTER'S FIVE FORCES ANALYSIS FOR LEAD ACID BATTERY RECYCLING
                    FIGURE 16 LEAD ACID BATTERY RECYCLING MARKET: PORTER'S FIVE FORCES ANALYSIS
                    TABLE 4 LEAD ACID BATTERY RECYCLING MARKET: PORTER'S FIVE FORCES ANALYSIS
                    5.4.1.1 Bargaining power of suppliers
                    5.4.1.2 Threat of new entrants
                    5.4.1.3 Threat of substitutes
                    5.4.1.4 Bargaining power of buyers
                    5.4.1.5 Intensity of competitive rivalry
           5.4.2 PORTER'S FIVE FORCES ANALYSIS FOR LITHIUM-ION BATTERY RECYCLING
                    FIGURE 17 LITHIUM-ION BATTERY RECYCLING MARKET: PORTER'S FIVE FORCES ANALYSIS
                    TABLE 5 LITHIUM-ION BATTERY RECYCLING MARKET: PORTER'S FIVE FORCES ANALYSIS
                    5.4.2.1 Bargaining power of suppliers
                    5.4.2.2 Threat of new entrants
                    5.4.2.3 Threat of substitutes
                    5.4.2.4 Bargaining power of buyers
                    5.4.2.5 Intensity of competitive rivalry
    5.5 TECHNOLOGY ANALYSIS 
           5.5.1 INTRODUCTION
           5.5.2 TECHNOLOGY
                    5.5.2.1 Hydrometallurgy
           5.5.3 PYROMETALLURGY
           5.5.4 PYROLYSIS
           5.5.5 MECHANICAL THERMODYNAMIC RECYCLING
           5.5.6 COMPARATIVE ANALYSIS
    5.6 TARIFF AND REGULATORY LANDSCAPE 
          TABLE 6 REGULATIONS AND STANDARDS FOR BATTERIES
           5.6.1 NORTH AMERICA BATTERY RECYCLING REGULATIONS
           5.6.2 EUROPE BATTERY RECYCLING REGULATIONS
           5.6.3 ASIA PACIFIC BATTERY RECYCLING REGULATIONS
    5.7 PATENT ANALYSIS 
           5.7.1 METHODOLOGY
           5.7.2 DOCUMENT TYPE
                    FIGURE 18 NUMBER OF GRANTED PATENTS, PATENT APPLICATIONS, AND LIMITED PATENTS
                    FIGURE 19 PUBLICATION TRENDS – LAST 10 YEARS
           5.7.3 INSIGHTS
                    FIGURE 20 LEGAL STATUS OF PATENTS
           5.7.4 JURISDICTION ANALYSIS
                    FIGURE 21 TOP JURISDICTION, BY DOCUMENT
           5.7.5 TOP COMPANIES/APPLICANTS
                    FIGURE 22 TOP 10 PATENT APPLICANTS
                    TABLE 7 RECENT PATENTS BY GUANGDONG BRUNP RECYCLING TECHNOLOGY CO., LTD.
                    TABLE 8 RECENT PATENTS BY UNIV CENTRAL SOUTH
                    TABLE 9 RECENT PATENTS BY AQUA METALS, INC.
                    TABLE 10 TOP 10 PATENT OWNERS IN LAST 10 YEARS
    5.8 CASE STUDY: ATTERO RECYCLING 
           5.8.1 KEY HIGHLIGHTS
    5.9 KEY CONFERENCES AND EVENTS (2023–2024) 
          TABLE 11 BATTERY RECYCLING MARKET: KEY CONFERENCES AND EVENTS (2023–2024)
    5.10 KEY STAKEHOLDERS AND BUYING CRITERIA 
           5.10.1 KEY STAKEHOLDERS IN BUYING PROCESS
                     FIGURE 23 INFLUENCE OF STAKEHOLDERS ON BUYING PROCESS FOR TOP THREE END-USE INDUSTRIES
                     TABLE 12 INFLUENCE OF STAKEHOLDERS ON BUYING PROCESS FOR TOP THREE END-USE INDUSTRIES (%)
           5.10.2 BUYING CRITERIA
                     FIGURE 24 KEY BUYING CRITERIA FOR TOP THREE END-USE INDUSTRIES
                     TABLE 13 KEY BUYING CRITERIA FOR TOP THREE END-USE INDUSTRIES
    5.11 TRENDS/DISRUPTIONS IMPACTING CUSTOMER BUSINESS 
           FIGURE 25 TRENDS/DISRUPTIONS IMPACTING LITHIUM-ION BATTERY ECOSYSTEM
    5.12 PRICING ANALYSIS OF RAW MATERIALS 
           5.12.1 LITHIUM
                     FIGURE 26 PRICE OF LITHIUM CARBONATE, JANUARY 2019 TO APRIL 2023
           5.12.2 LEAD
                     FIGURE 27 PRICE OF LEAD, JANUARY 2019 TO APRIL 2023
           5.12.3 NICKEL
                     FIGURE 28 PRICE OF NICKEL, JANUARY 2019 TO APRIL 2023
           5.12.4 COBALT
                     FIGURE 29 PRICE OF COBALT, JANUARY 2019 TO APRIL 2023
    5.13 TRADE DATA 
           TABLE 14 IMPORT DATA OF BATTERIES, 2021
           TABLE 15 EXPORT DATA OF BATTERIES, 2021
 
6 BATTERY RECYCLING MARKET, BY PROCESSING STATE (Page No. - 87)
    6.1 EXTRACTION OF MATERIAL 
    6.2 REUSE, REPACKAGING, AND SECOND LIFE 
    6.3 DISPOSAL 
 
7 BATTERY RECYCLING MARKET, BY RECYCLING PROCESS (Page No. - 89)
    7.1 INTRODUCTION 
    7.2 HYDROMETALLURGY 
    7.3 PYROMETALLURGY 
          TABLE 16 COMPARISON OF GENERIC RECYCLING METHODS USED TO RECOVER BATTERY COMPONENTS
          TABLE 17 BATTERY RECYCLING PROCESSES USED BY DIFFERENT COMPANIES
    7.4 LEAD ACID BATTERY RECYCLING PROCESS 
    7.5 LITHIUM-ION BATTERY RECYCLING PROCESS 
           7.5.1 GROWTH OPPORTUNITIES FOR LITHIUM-ION BATTERY RECYCLING MARKET
                    TABLE 18 OVERALL BATTERY RECYCLING CAPACITIES OF VARIOUS COUNTRIES
 
8 BATTERY RECYCLING MARKET, BY MATERIAL (Page No. - 94)
    8.1 INTRODUCTION 
    8.2 METALS 
          TABLE 19 METALS BY WEIGHT PERCENTAGE IN MOST COMMON BATTERY CHEMISTRIES
          TABLE 20 MAJOR RECOVERABLE METALS FROM VARIOUS BATTERY CHEMISTRIES AFTER RECYCLING
    8.3 ELECTROLYTES 
    8.4 PLASTICS 
    8.5 OTHER COMPONENTS 
 
9 BATTERY RECYCLING MARKET, BY CHEMISTRY (Page No. - 96)
    9.1 INTRODUCTION 
          FIGURE 30 LITHIUM-BASED SEGMENT TO LEAD BATTERY RECYCLING MARKET DURING FORECAST PERIOD
          TABLE 21 BATTERY RECYCLING MARKET, BY CHEMISTRY, 2018–2020 (USD MILLION)
          TABLE 22 BATTERY RECYCLING MARKET, BY CHEMISTRY, 2021–2030 (USD MILLION)
    9.2 LEAD ACID 
           9.2.1 LOW RECYCLING COSTS AND HIGH RECOVERY RATE TO DRIVE MARKET
                    TABLE 23 LEAD ACID BATTERIES: BATTERY RECYCLING MARKET, BY REGION, 2018–2020 (USD MILLION)
                    TABLE 24 LEAD ACID BATTERIES: BATTERY RECYCLING MARKET, BY REGION, 2021–2030 (USD MILLION)
    9.3 NICKEL-BASED 
           9.3.1 HIGHER POWER DENSITY TO DRIVE SEGMENT GROWTH
                    TABLE 25 NICKEL-BASED BATTERIES: BATTERY RECYCLING MARKET, BY REGION,  2018–2020 (USD MILLION)
                    TABLE 26 NICKEL-BASED BATTERIES: BATTERY RECYCLING MARKET, BY REGION,  2021–2030 (USD MILLION)
    9.4 LITHIUM-BASED 
           9.4.1 INCREASING GLOBAL CONSUMPTION TO DRIVE MARKET
                    TABLE 27 LITHIUM-BASED BATTERIES: BATTERY RECYCLING MARKET, BY REGION,  2018–2020 (USD MILLION)
                    TABLE 28 LITHIUM-BASED BATTERIES: BATTERY RECYCLING MARKET, BY REGION,  2021–2030 (USD MILLION)
                    TABLE 29 AUTOMOTIVE LITHIUM-BASED: BATTERY RECYCLING MARKET, BY REGION,  2018–2020 (UNITS)
                    TABLE 30 AUTOMOTIVE LITHIUM-BASED: BATTERY RECYCLING MARKET, BY REGION,  2021–2030 (UNITS)
    9.5 OTHERS 
          TABLE 31 OTHERS: BATTERY RECYCLING MARKET, BY REGION, 2018–2020 (USD MILLION)
          TABLE 32 OTHERS: BATTERY RECYCLING MARKET, BY REGION, 2021–2030 (USD MILLION)
 
10 BATTERY RECYCLING MARKET, BY SOURCE (Page No. - 104)
     10.1 INTRODUCTION 
             FIGURE 31 AUTOMOTIVE BATTERIES SEGMENT TO DOMINATE BATTERY RECYCLING MARKET DURING FORECAST PERIOD
             TABLE 33 BATTERY RECYCLING MARKET, BY SOURCE, 2018–2020 (USD MILLION)
             TABLE 34 BATTERY RECYCLING MARKET, BY SOURCE, 2021–2030 (USD MILLION)
     10.2 AUTOMOTIVE BATTERIES 
             10.2.1 HIGH DEMAND FOR ELECTRIC VEHICLES TO DRIVE MARKET GROWTH
                        TABLE 35 AUTOMOTIVE BATTERIES: BATTERY RECYCLING MARKET, BY REGION, 2018–2020 (USD MILLION)
                        TABLE 36 AUTOMOTIVE BATTERIES: BATTERY RECYCLING MARKET, BY REGION, 2021–2030 (USD MILLION)
     10.3 INDUSTRIAL BATTERIES 
             10.3.1 NEED FOR POWER BACKUP IN INDUSTRIAL SECTOR TO SUPPORT MARKET GROWTH
                        TABLE 37 INDUSTRIAL BATTERIES: BATTERY RECYCLING MARKET, BY REGION, 2018–2020 (USD MILLION)
                        TABLE 38 INDUSTRIAL BATTERIES: BATTERY RECYCLING MARKET, BY REGION, 2021–2030 (USD MILLION)
     10.4 CONSUMER & ELECTRONIC APPLIANCE BATTERIES 
             10.4.1 GROWING USE OF CONSUMER & ELECTRONIC APPLIANCES TO PROPEL MARKET DEMAND
                        TABLE 39 CONSUMER & ELECTRONIC APPLIANCE BATTERIES: BATTERY RECYCLING MARKET,  BY REGION, 2018–2020 (USD MILLION)
                        TABLE 40 CONSUMER & ELECTRONIC APPLIANCE BATTERIES: BATTERY RECYCLING MARKET,  BY REGION, 2021–2030 (USD MILLION)
 
11 BATTERY RECYCLING MARKET, BY REGION (Page No. - 110)
     11.1 INTRODUCTION 
             FIGURE 32 BATTERY RECYCLING MARKET, BY REGION (USD MILLION)
             TABLE 41 BATTERY RECYCLING MARKET, BY REGION, 2018–2020 (USD MILLION)
             TABLE 42 BATTERY RECYCLING MARKET, BY REGION, 2021–2030 (USD MILLION)
     11.2 ASIA PACIFIC 
             11.2.1 IMPACT OF RECESSION
                        FIGURE 33 ASIA PACIFIC BATTERY RECYCLING MARKET SNAPSHOT
                        TABLE 43 ASIA PACIFIC: BATTERY RECYCLING MARKET, BY COUNTRY, 2018–2020 (USD MILLION)
                        TABLE 44 ASIA PACIFIC: BATTERY RECYCLING MARKET, BY COUNTRY, 2021–2030 (USD MILLION)
                        TABLE 45 ASIA PACIFIC: BATTERY RECYCLING MARKET, BY CHEMISTRY, 2018–2020 (USD MILLION)
                        TABLE 46 ASIA PACIFIC: BATTERY RECYCLING MARKET, BY CHEMISTRY, 2021–2030 (USD MILLION)
                        TABLE 47 ASIA PACIFIC: BATTERY RECYCLING MARKET, BY SOURCE, 2018–2020 (USD MILLION)
                        TABLE 48 ASIA PACIFIC: BATTERY RECYCLING MARKET, BY SOURCE, 2021–2030 (USD MILLION)
             11.2.2 CHINA
                        11.2.2.1 Growing electric vehicle market to propel battery recycling in China
                                      TABLE 49 CHINA: BATTERY RECYCLING MARKET, BY SOURCE, 2018–2020 (USD MILLION)
                                      TABLE 50 CHINA: BATTERY RECYCLING MARKET, BY SOURCE, 2021–2030 (USD MILLION)
             11.2.3 INDIA
                        11.2.3.1 Increasing cleaner energy initiatives to drive market
                                      TABLE 51 INDIA: BATTERY RECYCLING MARKET, BY SOURCE, 2018–2020 (USD MILLION)
                                      TABLE 52 INDIA: BATTERY RECYCLING MARKET, BY SOURCE, 2021–2030 (USD MILLION)
             11.2.4 JAPAN
                        11.2.4.1 Growth in battery manufacturing to create demand for recycling
                                      TABLE 53 JAPAN: BATTERY RECYCLING MARKET, BY SOURCE, 2018–2020 (USD MILLION)
                                      TABLE 54 JAPAN: BATTERY RECYCLING MARKET, BY SOURCE, 2021–2030 (USD MILLION)
             11.2.5 SOUTH KOREA
                        11.2.5.1 Substantial growth in automotive sector to positively impact market
                                      TABLE 55 SOUTH KOREA: BATTERY RECYCLING MARKET, BY SOURCE, 2018–2020 (USD MILLION)
                                      TABLE 56 SOUTH KOREA: BATTERY RECYCLING MARKET, BY SOURCE, 2021–2030 (USD MILLION)
             11.2.6 INDONESIA
                        11.2.6.1 Lead-acid batteries to drive growth
                                      TABLE 57 INDONESIA: BATTERY RECYCLING MARKET, BY SOURCE, 2018–2020 (USD MILLION)
                                      TABLE 58 INDONESIA: BATTERY RECYCLING MARKET, BY SOURCE, 2021–2030 (USD MILLION)
             11.2.7 MALAYSIA
                        11.2.7.1 Requirement of energy storage to increase demand for battery recycling
                                      TABLE 59 MALAYSIA: BATTERY RECYCLING MARKET, BY SOURCE, 2018–2020 (USD MILLION)
                                      TABLE 60 MALAYSIA: BATTERY RECYCLING MARKET, BY SOURCE, 2021–2030 (USD MILLION)
             11.2.8 AUSTRALIA
                        11.2.8.1 Supportive government policies to aid market growth
                                      TABLE 61 AUSTRALIA: BATTERY RECYCLING MARKET, BY SOURCE, 2018–2020 (USD MILLION)
                                      TABLE 62 AUSTRALIA: BATTERY RECYCLING MARKET, BY SOURCE, 2021–2030 (USD MILLION)
             11.2.9 TAIWAN
                        11.2.9.1 Increasing number of vehicles to support market growth
                                      TABLE 63 TAIWAN: BATTERY RECYCLING MARKET, BY SOURCE, 2018–2020 (USD MILLION)
                                      TABLE 64 TAIWAN: BATTERY RECYCLING MARKET, BY SOURCE, 2021–2030 (USD MILLION)
             11.2.10 THAILAND
                        11.2.10.1 Electric mobility sector to drive market
                                      TABLE 65 THAILAND: BATTERY RECYCLING MARKET, BY SOURCE, 2018–2020 (USD MILLION)
                                      TABLE 66 THAILAND: BATTERY RECYCLING MARKET, BY SOURCE, 2021–2030 (USD MILLION)
             11.2.11 REST OF ASIA PACIFIC
                        TABLE 67 REST OF ASIA PACIFIC: BATTERY RECYCLING MARKET, BY SOURCE,  2018–2020 (USD MILLION)
                        TABLE 68 REST OF ASIA PACIFIC: BATTERY RECYCLING MARKET, BY SOURCE,  2021–2030 (USD MILLION)
     11.3 NORTH AMERICA 
             11.3.1 IMPACT OF RECESSION
                        FIGURE 34 NORTH AMERICA BATTERY RECYCLING MARKET SNAPSHOT
                        TABLE 69 NORTH AMERICA: BATTERY RECYCLING MARKET, BY COUNTRY,  2018–2020 (USD MILLION)
                        TABLE 70 NORTH AMERICA: BATTERY RECYCLING MARKET, BY COUNTRY,  2021–2030 (USD MILLION)
                        TABLE 71 NORTH AMERICA: BATTERY RECYCLING MARKET, BY CHEMISTRY,  2018–2020 (USD MILLION)
                        TABLE 72 NORTH AMERICA: BATTERY RECYCLING MARKET, BY CHEMISTRY,  2021–2030 (USD MILLION)
                        TABLE 73 NORTH AMERICA: BATTERY RECYCLING MARKET, BY SOURCE,  2018–2020 (USD MILLION)
                        TABLE 74 NORTH AMERICA: BATTERY RECYCLING MARKET, BY SOURCE,  2021–2030 (USD MILLION)
             11.3.2 US
                        11.3.2.1 US to lead market in North America
                                      TABLE 75 US: BATTERY RECYCLING MARKET, BY SOURCE, 2018–2020 (USD MILLION)
                                      TABLE 76 US: BATTERY RECYCLING MARKET, BY SOURCE, 2021–2030 (USD MILLION)
             11.3.3 CANADA
                        11.3.3.1 Battery recycling programs to support market
                                      TABLE 77 CANADA: BATTERY RECYCLING MARKET, BY SOURCE, 2018–2020 (USD MILLION)
                                      TABLE 78 CANADA: BATTERY RECYCLING MARKET, BY SOURCE, 2021–2030 (USD MILLION)
             11.3.4 MEXICO
                        11.3.4.1 Government initiatives to fuel demand
                                      TABLE 79 MEXICO: BATTERY RECYCLING MARKET, BY SOURCE, 2018–2020 (USD MILLION)
                                      TABLE 80 MEXICO: BATTERY RECYCLING MARKET, BY SOURCE, 2021–2030 (USD MILLION)
     11.4 EUROPE 
             11.4.1 IMPACT OF RECESSION
                        FIGURE 35 EUROPE BATTERY RECYCLING MARKET SNAPSHOT
                        TABLE 81 EUROPE: BATTERY RECYCLING MARKET, BY COUNTRY, 2018–2020 (USD MILLION)
                        TABLE 82 EUROPE: BATTERY RECYCLING MARKET, BY COUNTRY, 2021–2030 (USD MILLION)
                        TABLE 83 EUROPE: BATTERY RECYCLING MARKET, BY CHEMISTRY, 2018–2020 (USD MILLION)
                        TABLE 84 EUROPE: BATTERY RECYCLING MARKET, BY CHEMISTRY, 2021–2030 (USD MILLION)
                        TABLE 85 EUROPE: BATTERY RECYCLING MARKET, BY SOURCE, 2018–2020 (USD MILLION)
                        TABLE 86 EUROPE: BATTERY RECYCLING MARKET, BY SOURCE, 2021–2030 (USD MILLION)
             11.4.2 GERMANY
                        11.4.2.1 Shift toward renewable energy to drive market
                                      TABLE 87 GERMANY: BATTERY RECYCLING MARKET, BY SOURCE, 2018–2020 (USD MILLION)
                                      TABLE 88 GERMANY: BATTERY RECYCLING MARKET, BY SOURCE, 2021–2030 (USD MILLION)
             11.4.3 UK
                        11.4.3.1 Growth of electric vehicles to propel demand
                                      TABLE 89 UK: BATTERY RECYCLING MARKET, BY SOURCE, 2018–2020 (USD MILLION)
                                      TABLE 90 UK: BATTERY RECYCLING MARKET, BY SOURCE, 2021–2030 (USD MILLION)
             11.4.4 FRANCE
                        11.4.4.1 Development in battery recycling technologies to fuel market growth
                                      TABLE 91 FRANCE: BATTERY RECYCLING MARKET, BY SOURCE, 2018–2020 (USD MILLION)
                                      TABLE 92 FRANCE: BATTERY RECYCLING MARKET, BY SOURCE, 2021–2030 (USD MILLION)
             11.4.5 ITALY
                        11.4.5.1 Increasing capacity to recycle batteries and electric vehicles sales to drive market
                                      TABLE 93 ITALY: BATTERY RECYCLING MARKET, BY SOURCE, 2018–2020 (USD MILLION)
                                      TABLE 94 ITALY: BATTERY RECYCLING MARKET, BY SOURCE, 2021–2030 (USD MILLION)
             11.4.6 SPAIN
                        11.4.6.1 Growing investments to promote electric vehicle sales to propel market
                                      TABLE 95 SPAIN: BATTERY RECYCLING MARKET, BY SOURCE, 2018–2020 (USD MILLION)
                                      TABLE 96 SPAIN: BATTERY RECYCLING MARKET, BY SOURCE, 2021–2030 (USD MILLION)
             11.4.7 NETHERLANDS
                        11.4.7.1 Growing consumer electronics industry to support market growth
                                      TABLE 97 NETHERLANDS: BATTERY RECYCLING MARKET, BY SOURCE, 2018–2020 (USD MILLION)
                                      TABLE 98 NETHERLANDS: BATTERY RECYCLING MARKET, BY SOURCE, 2021–2030 (USD MILLION)
             11.4.8 REST OF EUROPE
                        TABLE 99 REST OF EUROPE: BATTERY RECYCLING MARKET, BY SOURCE,  2018–2020 (USD MILLION)
                        TABLE 100 REST OF EUROPE: BATTERY RECYCLING MARKET, BY SOURCE,  2021–2030 (USD MILLION)
     11.5 SOUTH AMERICA 
             11.5.1 IMPACT OF RECESSION
                        TABLE 101 SOUTH AMERICA: BATTERY RECYCLING MARKET, BY COUNTRY,  2018–2020 (USD MILLION)
                        TABLE 102 SOUTH AMERICA: BATTERY RECYCLING MARKET, BY COUNTRY,  2021–2030 (USD MILLION)
                        TABLE 103 SOUTH AMERICA: BATTERY RECYCLING MARKET, BY CHEMISTRY,  2018–2020 (USD MILLION)
                        TABLE 104 SOUTH AMERICA BATTERY RECYCLING MARKET, BY CHEMISTRY,  2021–2030 (USD MILLION)
                        TABLE 105 SOUTH AMERICA BATTERY RECYCLING MARKET, BY SOURCE, 2018–2020 (USD MILLION)
                        TABLE 106 SOUTH AMERICA BATTERY RECYCLING MARKET, BY SOURCE, 2021–2030 (USD MILLION)
             11.5.2 BRAZIL
                        11.5.2.1 Brazil to lead market in South America during forecast period
                                      TABLE 107 BRAZIL: BATTERY RECYCLING MARKET, BY SOURCE, 2018–2020 (USD MILLION)
                                      TABLE 108 BRAZIL: BATTERY RECYCLING MARKET, BY SOURCE, 2021–2030 (USD MILLION)
             11.5.3 ARGENTINA
                        11.5.3.1 Development of battery recycling facilities to drive market
                                      TABLE 109 ARGENTINA: BATTERY RECYCLING MARKET, BY SOURCE, 2018–2020 (USD MILLION)
                                      TABLE 110 ARGENTINA: BATTERY RECYCLING MARKET, BY SOURCE, 2021–2030 (USD MILLION)
             11.5.4 CHILE
                        11.5.4.1 Battery recycling market to register second-highest CAGR in South America
                                      TABLE 111 CHILE: BATTERY RECYCLING MARKET, BY SOURCE, 2018–2020 (USD MILLION)
                                      TABLE 112 CHILE: BATTERY RECYCLING MARKET, BY SOURCE, 2021–2030 (USD MILLION)
             11.5.5 REST OF SOUTH AMERICA
                        TABLE 113 REST OF SOUTH AMERICA: BATTERY RECYCLING MARKET, BY SOURCE,  2018–2020 (USD MILLION)
                        TABLE 114 REST OF SOUTH AMERICA: BATTERY RECYCLING MARKET, BY SOURCE,  2021–2030 (USD MILLION)
     11.6 MIDDLE EAST & AFRICA 
             11.6.1 IMPACT OF RECESSION
                        TABLE 115 MIDDLE EAST & AFRICA: BATTERY RECYCLING MARKET, BY COUNTRY,  2018–2020 (USD MILLION)
                        TABLE 116 MIDDLE EAST & AFRICA: BATTERY RECYCLING MARKET, BY COUNTRY,  2021–2030 (USD MILLION)
                        TABLE 117 MIDDLE EAST & AFRICA: BATTERY RECYCLING MARKET, BY CHEMISTRY,  2018–2020 (USD MILLION)
                        TABLE 118 MIDDLE EAST & AFRICA: BATTERY RECYCLING MARKET, BY CHEMISTRY,  2021–2030 (USD MILLION)
                        TABLE 119 MIDDLE EAST & AFRICA: BATTERY RECYCLING MARKET, BY SOURCE,  2018–2020 (USD MILLION)
                        TABLE 120 MIDDLE EAST & AFRICA: BATTERY RECYCLING MARKET, BY SOURCE,  2021–2030 (USD MILLION)
             11.6.2 SAUDI ARABIA
                        11.6.2.1 Government initiatives toward renewable energy sector to drive demand for battery recycling
                                      TABLE 121 SAUDI ARABIA: BATTERY RECYCLING MARKET, BY SOURCE, 2018–2020 (USD MILLION)
                                      TABLE 122 SAUDI ARABIA: BATTERY RECYCLING MARKET, BY SOURCE, 2021–2030 (USD MILLION)
             11.6.3 UAE
                        11.6.3.1 Government support to enhance electric vehicles to drive market
                                      TABLE 123 UAE: BATTERY RECYCLING MARKET, BY SOURCE, 2018–2020 (USD MILLION)
                                      TABLE 124 UAE: BATTERY RECYCLING MARKET, BY SOURCE, 2021–2030 (USD MILLION)
             11.6.4 SOUTH AFRICA
                        11.6.4.1 Automotive batteries segment to lead market
                                      TABLE 125 SOUTH AFRICA: BATTERY RECYCLING MARKET, BY SOURCE, 2018–2020 (USD MILLION)
                                      TABLE 126 SOUTH AFRICA: BATTERY RECYCLING MARKET, BY SOURCE, 2021–2030 (USD MILLION)
             11.6.5 EGYPT
                        11.6.5.1 Focus on electronic waste management to enhance market growth
                                      TABLE 127 EGYPT: BATTERY RECYCLING MARKET, BY SOURCE, 2018–2020 (USD MILLION)
                                      TABLE 128 EGYPT: BATTERY RECYCLING MARKET, BY SOURCE, 2021–2030 (USD MILLION)
             11.6.6 REST OF MIDDLE EAST & AFRICA
                        TABLE 129 REST OF MIDDLE EAST & AFRICA: BATTERY RECYCLING MARKET, BY SOURCE,  2018–2020 (USD MILLION)
                        TABLE 130 REST OF MIDDLE EAST & AFRICA: BATTERY RECYCLING MARKET, BY SOURCE,  2021–2030 (USD MILLION)
 
12 COMPETITIVE LANDSCAPE (Page No. - 152)
     12.1 INTRODUCTION 
     12.2 STRATEGIES ADOPTED BY KEY PLAYERS 
             TABLE 131 OVERVIEW OF STRATEGIES ADOPTED BY KEY MANUFACTURERS
     12.3 MARKET SHARE ANALYSIS 
             12.3.1 RANKING OF KEY MARKET PLAYERS, 2022
                        FIGURE 36 RANKING OF TOP SIX PLAYERS IN BATTERY RECYCLING MARKET, 2022
             12.3.2 MARKET SHARE OF KEY PLAYERS
                        FIGURE 37 BATTERY RECYCLING MARKET SHARE ANALYSIS
                        TABLE 132 BATTERY RECYCLING MARKET: DEGREE OF COMPETITION
                        12.3.2.1 Call2Recycle, Inc.
                        12.3.2.2 Cirba Solutions
                        12.3.2.3 Element Resources
                        12.3.2.4 Umicore
                        12.3.2.5 Contemporary Amperex Technology Co., Limited
                        12.3.2.6 Exide Industries Ltd.
             12.3.3 REVENUE ANALYSIS OF TOP 6 PLAYERS
                        FIGURE 38 REVENUE ANALYSIS OF KEY COMPANIES (2018–2022)
     12.4 COMPANY PRODUCT FOOTPRINT ANALYSIS 
             FIGURE 39 BATTERY RECYCLING MARKET: COMPANY FOOTPRINT
             TABLE 133 BATTERY RECYCLING MARKET: CHEMISTRY FOOTPRINT
             TABLE 134 BATTERY RECYCLING MARKET: RECYCLING PROCESS FOOTPRINT
             TABLE 135 BATTERY RECYCLING MARKET: COMPANY REGION FOOTPRINT
     12.5 COMPANY EVALUATION MATRIX (TIER 1) 
             12.5.1 STARS
             12.5.2 EMERGING LEADERS
             12.5.3 PERVASIVE PLAYERS
             12.5.4 PARTICIPANTS
                       FIGURE 40 COMPANY EVALUATION QUADRANT: BATTERY RECYCLING MARKET  (TIER 1 COMPANIES)
     12.6 COMPETITIVE BENCHMARKING 
             TABLE 136 BATTERY RECYCLING MARKET: DETAILED LIST OF KEY STARTUPS/SMES
             TABLE 137 BATTERY RECYCLING MARKET: COMPETITIVE BENCHMARKING OF KEY STARTUPS/SMES
     12.7 STARTUP/SME EVALUATION QUADRANT 
             12.7.1 PROGRESSIVE COMPANIES
             12.7.2 RESPONSIVE COMPANIES
             12.7.3 DYNAMIC COMPANIES
             12.7.4 STARTING BLOCKS
                        FIGURE 41 STARTUP/SM EVALUATION QUADRANT: BATTERY RECYCLING MARKET
     12.8 RECENT DEVELOPMENTS 
             12.8.1 PRODUCT LAUNCHES
                        TABLE 138 BATTERY RECYCLING MARKET: PRODUCT LAUNCHES (2019–APRIL 2023)
             12.8.2 DEALS
                        TABLE 139 BATTERY RECYCLING MARKET: DEALS (2019–APRIL 2023)
             12.8.3 OTHER DEVELOPMENTS
                        TABLE 140 BATTERY RECYCLING MARKET: EXPANSIONS, INVESTMENTS, AND INNOVATIONS  (2019–APRIL 2023)
 
13 COMPANY PROFILES (Page No. - 188)
(Business overview, Products offered, Recent Developments, MNM view)*
     13.1 KEY COMPANIES 
             13.1.1 CALL2RECYCLE, INC.
                        TABLE 141 CALL2RECYCLE, INC.: COMPANY OVERVIEW
                        TABLE 142 CALL2RECYCLE, INC.: PRODUCTS OFFERED
                        TABLE 143 CALL2RECYCLE, INC.: DEALS
             13.1.2 CIRBA SOLUTIONS
                        TABLE 144 CIRBA SOLUTIONS: COMPANY OVERVIEW
                        TABLE 145 CIRBA SOLUTIONS: PRODUCTS OFFERED
                        TABLE 146 CIRBA SOLUTIONS: DEALS
                        TABLE 147 CIRBA SOLUTIONS: OTHERS
             13.1.3 ELEMENT RESOURCES
                        TABLE 148 ELEMENT RESOURCES: COMPANY OVERVIEW
                        TABLE 149 ELEMENT RESOURCES: PRODUCTS OFFERED
             13.1.4 UMICORE
                        TABLE 150 UMICORE: COMPANY OVERVIEW
                        FIGURE 42 UMICORE: COMPANY SNAPSHOT
                        TABLE 151 UMICORE: PRODUCTS OFFERED
                        TABLE 152 UMICORE: DEALS
             13.1.5 CONTEMPORARY AMPEREX TECHNOLOGY CO., LIMITED
                        TABLE 153 CONTEMPORARY AMPEREX TECHNOLOGY CO., LIMITED: COMPANY OVERVIEW
                        TABLE 154 CONTEMPORARY AMPEREX TECHNOLOGY CO., LIMITED: PRODUCTS OFFERED
                        TABLE 155 CONTEMPORARY AMPEREX TECHNOLOGY CO., LIMITED: DEALS
                        TABLE 156 CONTEMPORARY AMPEREX TECHNOLOGY CO., LIMITED: OTHERS
             13.1.6 EXIDE INDUSTRIES LTD.
                        TABLE 157 EXIDE INDUSTRIES LTD.: COMPANY OVERVIEW
                        FIGURE 43 EXIDE INDUSTRIES LTD.: COMPANY SNAPSHOT
                        TABLE 158 EXIDE INDUSTRIES LTD.: PRODUCTS OFFERED
                        TABLE 159 EXIDE INDUSTRIES LTD.: OTHERS
             13.1.7 ACCUREC RECYCLING GMBH
                        TABLE 160 ACCUREC RECYCLING GMBH: COMPANY OVERVIEW
                        TABLE 161 ACCUREC RECYCLING GMBH: PRODUCTS OFFERED
                        TABLE 162 ACCUREC RECYCLING GMBH: OTHERS
             13.1.8 AMERICAN BATTERY TECHNOLOGY COMPANY
                        TABLE 163 AMERICAN BATTERY TECHNOLOGY COMPANY: COMPANY OVERVIEW
                        TABLE 164 AMERICAN BATTERY TECHNOLOGY COMPANY: PRODUCTS OFFERED
                        TABLE 165 AMERICAN BATTERY TECHNOLOGY COMPANY: DEALS
                        TABLE 166 AMERICAN BATTERY TECHNOLOGY COMPANY: OTHERS
             13.1.9 AQUA METALS, INC.
                        TABLE 167 AQUA METALS, INC.: COMPANY OVERVIEW
                        FIGURE 44 AQUA METALS, INC.: COMPANY SNAPSHOT
                        TABLE 168 AQUA METALS, INC.: PRODUCTS OFFERED
                        TABLE 169 AQUA METALS, INC.: DEALS
                        TABLE 170 AQUA METALS, INC.: OTHERS
             13.1.10 EAST PENN MANUFACTURING COMPANY
                        TABLE 171 EAST PENN MANUFACTURING COMPANY: COMPANY OVERVIEW
                        TABLE 172 EAST PENN MANUFACTURING COMPANY: PRODUCTS OFFERED
             13.1.11 ECOBAT
                        TABLE 173 ECOBAT: COMPANY OVERVIEW
                        TABLE 174 ECOBAT: PRODUCTS OFFERED
                        TABLE 175 ECOBAT: DEALS
                        TABLE 176 ECOBAT: OTHERS
             13.1.12 ENERSYS
                        TABLE 177 ENERSYS: COMPANY OVERVIEW
                        FIGURE 45 ENERSYS: COMPANY SNAPSHOT
                        TABLE 178 ENERSYS: PRODUCTS OFFERED
             13.1.13 FORTUM
                        TABLE 179 FORTUM: COMPANY OVERVIEW
                        FIGURE 46 FORTUM: COMPANY SNAPSHOT
                        TABLE 180 FORTUM: PRODUCTS OFFERED
                        TABLE 181 FORTUM: DEALS
                        TABLE 182 FORTUM: OTHERS
             13.1.14 GEM CO., LTD.
                        TABLE 183 GEM CO., LTD.: COMPANY OVERVIEW
                        TABLE 184 GEM CO., LTD.: PRODUCTS OFFERED
                        TABLE 185 GEM CO., LTD.: DEALS
             13.1.15 GLENCORE
                        TABLE 186 GLENCORE: COMPANY OVERVIEW
                        FIGURE 47 GLENCORE: COMPANY SNAPSHOT
                        TABLE 187 GLENCORE: PRODUCTS OFFERED
                        TABLE 188 GLENCORE: DEALS
             13.1.16 GOPHER RESOURCE
                        TABLE 189 GOPHER RESOURCE: COMPANY OVERVIEW
                        TABLE 190 GOPHER RESOURCE: PRODUCTS OFFERED
                        TABLE 191 GOPHER RESOURCE: DEALS
             13.1.17 GRAVITA INDIA LTD.
                        TABLE 192 GRAVITA INDIA LTD.: COMPANY OVERVIEW
                        FIGURE 48 GRAVITA INDIA LTD.: COMPANY SNAPSHOT
                        TABLE 193 GRAVITA INDIA LTD.: PRODUCTS OFFERED
                        TABLE 194 GRAVITA INDIA LTD.: OTHERS
             13.1.18 LI-CYCLE CORP.
                        TABLE 195 LI-CYCLE CORP.: COMPANY OVERVIEW
                        FIGURE 49 LI-CYCLE CORP.: COMPANY SNAPSHOT
                        TABLE 196 LI-CYCLE CORP.: PRODUCTS OFFERED
                        TABLE 197 LI-CYCLE CORP.: DEALS
                        TABLE 198 LI-CYCLE CORP.: OTHERS
             13.1.19 NEOMETALS LTD.
                        TABLE 199 NEOMETALS LTD.: COMPANY OVERVIEW
                        TABLE 200 NEOMETALS LTD.: PRODUCTS OFFERED
                        TABLE 201 NEOMETALS LTD.: PRODUCT LAUNCHES
                        TABLE 202 NEOMETALS LTD.: DEALS
                        TABLE 203 NEOMETALS LTD.: OTHERS
             13.1.20 RAW MATERIALS COMPANY
                        TABLE 204 RAW MATERIALS COMPANY: COMPANY OVERVIEW
                        TABLE 205 RAW MATERIALS COMPANY: PRODUCTS OFFERED
             13.1.21 RECYCLICO BATTERY MATERIALS INC.
                        TABLE 206 RECYCLICO BATTERY MATERIALS INC.: COMPANY OVERVIEW
                        TABLE 207 RECYCLICO BATTERY MATERIALS INC.: PRODUCTS OFFERED
                        TABLE 208 RECYCLICO BATTERY MATERIALS INC.: PRODUCT LAUNCHES
                        TABLE 209 RECYCLICO BATTERY MATERIALS INC.: DEALS
             13.1.22 REDWOOD MATERIALS INC.
                        TABLE 210 REDWOOD MATERIALS INC.: COMPANY OVERVIEW
                        TABLE 211 REDWOOD MATERIALS INC.: PRODUCTS OFFERED
                        TABLE 212 REDWOOD MATERIALS INC.: DEALS
                        TABLE 213 REDWOOD MATERIALS INC.: OTHERS
             13.1.23 SHENZHEN HIGHPOWER TECHNOLOGY CO., LTD.
                        TABLE 214 SHENZHEN HIGHPOWER TECHNOLOGY CO., LTD.: COMPANY OVERVIEW
                        TABLE 215 SHENZHEN HIGHPOWER TECHNOLOGY CO., LTD.: PRODUCTS OFFERED
             13.1.24 STENA RECYCLING
                        TABLE 216 STENA RECYCLING: COMPANY OVERVIEW
                        TABLE 217 STENA RECYCLING: PRODUCTS OFFERED
                        TABLE 218 STENA RECYCLING: DEALS
                        TABLE 219 STENA RECYCLING: OTHERS
             13.1.25 TERRAPURE
                        TABLE 220 TERRAPURE: COMPANY OVERVIEW
                        TABLE 221 TERRAPURE: PRODUCTS OFFERED
             13.1.26 TES
                        TABLE 222 TES: COMPANY OVERVIEW
                        TABLE 223 TES: PRODUCTS OFFERED
                        TABLE 224 TES: DEALS
                        TABLE 225 TES: OTHERS
             13.1.27 THE DOE RUN COMPANY
                        TABLE 226 THE DOE RUN COMPANY: COMPANY OVERVIEW
                        TABLE 227 THE DOE RUN COMPANY: PRODUCTS OFFERED
             13.1.28 THE INTERNATIONAL METALS RECLAMATION COMPANY
                        TABLE 228 THE INTERNATIONAL METALS RECLAMATION COMPANY: COMPANY OVERVIEW
                        TABLE 229 THE INTERNATIONAL METALS RECLAMATION COMPANY: PRODUCTS OFFERED
     13.2 OTHER COMPANIES 
             13.2.1 BATREC INDUSTRIE
                        TABLE 230 BATREC INDUSTRIE: COMPANY OVERVIEW
             13.2.2 BATTERY RECYCLING MADE EASY (BRME)
                        TABLE 231 BATTERY RECYCLING MADE EASY (BRME): COMPANY OVERVIEW
             13.2.3 DUESENFELD GMBH
                        TABLE 232 DUESENFELD GMBH: COMPANY OVERVIEW
             13.2.4 ENVIROSTREAM AUSTRALIA PTY LTD.
                        TABLE 233 ENVIROSTREAM AUSTRALIA PTY LTD.: COMPANY OVERVIEW
                        13.2.4.1 Recent developments
                        TABLE 234 ENVIROSTREAM AUSTRALIA PTY LTD.: OTHERS
             13.2.5 EURO DIEUZE INDUSTRIE (E.D.I.)
                        TABLE 235 EURO DIEUZE INDUSTRIE (E.D.I.): COMPANY OVERVIEW
             13.2.6 LITHION RECYCLING
                        TABLE 236 LITHION RECYCLING: COMPANY OVERVIEW
             13.2.7 METALEX PRODUCTS LTD.
                        TABLE 237 METALEX PRODUCTS LTD.: COMPANY OVERVIEW
             13.2.8 ONTO TECHNOLOGY
                        TABLE 238 ONTO TECHNOLOGY: COMPANY OVERVIEW
             13.2.9 SITRASA
                        TABLE 239 SITRASA: COMPANY OVERVIEW
             13.2.10 SMC RECYCLING
                        TABLE 240 SMC RECYCLING: COMPANY OVERVIEW
             13.2.11 TATA CHEMICALS LIMITED
                        TABLE 241 TATA CHEMICALS LIMITED: COMPANY OVERVIEW
 
*Details on Business overview, Products offered, Recent Developments, MNM view might not be captured in case of unlisted companies.
 
14 ADJACENT AND RELATED MARKETS (Page No. - 263)
     14.1 INTRODUCTION 
     14.2 LIMITATIONS 
     14.3 LITHIUM-ION BATTERY RECYCLING MARKET 
             14.3.1 MARKET DEFINITION
             14.3.2 MARKET OVERVIEW
             14.3.3 LITHIUM-ION BATTERY RECYCLING MARKET, BY SOURCE
                        TABLE 242 AUTOMOTIVE: LITHIUM-ION BATTERY RECYCLING MARKET, BY REGION,  2017–2020 (USD MILLION)
                        TABLE 243 AUTOMOTIVE: LITHIUM-ION BATTERY RECYCLING MARKET, BY REGION,  2021–2031 (USD MILLION)
                        TABLE 244 AUTOMOTIVE: LITHIUM-ION BATTERY RECYCLING MARKET,  BY REGION, 2017–2020 (UNITS)
                        TABLE 245 AUTOMOTIVE: LITHIUM-ION BATTERY RECYCLING MARKET, BY REGION,  2021–2031 (UNITS)
                        TABLE 246 NON-AUTOMOTIVE: LITHIUM-ION BATTERY RECYCLING MARKET, BY SOURCE, 2017–2020 (USD MILLION)
                        TABLE 247 NON-AUTOMOTIVE: LITHIUM-ION BATTERY RECYCLING MARKET, BY SOURCE, 2021–2031 (USD MILLION)
 
15 APPENDIX (Page No. - 267)
     15.1 DISCUSSION GUIDE 
     15.2 KNOWLEDGESTORE: MARKETSANDMARKETS’  SUBSCRIPTION PORTAL 
     15.3 CUSTOMIZATION OPTIONS 
     15.4 RELATED REPORTS 
     15.5 AUTHOR DETAILS 

The study involved four major activities in estimating the current market size of battery recycling. Exhaustive secondary research was done to collect information on the market, the peer market, and the parent market. The next step was to validate these findings, assumptions, and sizes with industry experts across the value chain of battery recycling through primary research. Both top-down and bottom-up approaches were employed to estimate the complete market size. After that, market breakdown and data triangulation were used to estimate the size of the segments and sub-segments of the market.

Secondary Research

The research methodology used to estimate and forecast the access control market begins with capturing data on revenues of key vendors in the market through secondary research. In the secondary research process, various secondary sources, such as Hoovers, Bloomberg BusinessWeek, Factiva, World Bank, and Industry Journals, were referred to for identifying and collecting information for this study. These secondary sources included annual reports, press releases & investor presentations of companies; white papers; certified publications; articles by recognized authors; notifications by regulatory bodies; trade directories; and databases. Vendor offerings have also been taken into consideration to determine market segmentation.

Primary Research

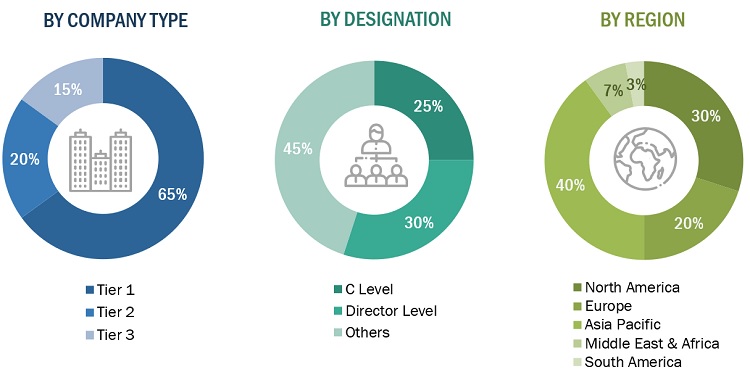
The battery recycling market comprises several stakeholders, such as such as battery suppliers, processors, recycling companies, and regulatory organizations in the supply chain. Various primary sources from both the supply and demand sides of the market were interviewed to obtain qualitative and quantitative information. Primary sources from the supply side included industry experts such as Chief Executive Officers (CEOs), vice presidents, marketing directors, technology and innovation directors, and related key executives from various key companies and organizations operating in the battery recycling industry. Primary sources from the demand side included directors, marketing heads, and purchase managers from various sourcing industries. Following is the breakdown of the primary respondents:
Battery Recycling Market Size, and Share

To know about the assumptions considered for the study, download the pdf brochure

Market Size Estimation

Both the top-down and bottom- up approaches were used to estimate and validate the total size of the battery recycling industry. These methods were also used extensively to determine the size of various sub-segments in the market. The research methodology used to estimate the market size included the following:

  • The key players were identified through extensive primary and secondary research.
  • The value chain and market size of the battery recycling market, in terms of value, were determined through primary and secondary research.
  • All percentage shares, splits, and breakdowns were determined using secondary sources and verified through primary sources.
  • All possible parameters that affect the market covered in this research study were accounted for, viewed in extensive detail, verified through primary research, and analyzed to obtain the final quantitative and qualitative data.
  • The research included the study of reports, reviews, and newsletters of top market players, along with extensive interviews for opinions from key leaders, such as CEOs, directors, and marketing executives.

Global Battery Recycling Market Size: Bottom-Up Approach

Battery Recycling Market Size, and Share

To know about the assumptions considered for the study, Request for Free Sample Report

Global Battery Recycling Market Size: Top-Down Approach

Battery Recycling Market Size, and Share

Data Triangulation

After arriving at the overall market size using the market size estimation processes as explained above, the market was split into several segments and sub-segments. To complete the overall market engineering process and arrive at the exact statistics of each market segment and subsegment, the data triangulation and market breakdown procedures were employed, wherever applicable. The data was triangulated by studying various factors and trends from both the demand and supply sides in the automotive and non-automotive sources.

Market definition

Battery recycling refers to the process of collecting and reprocessing used batteries to recover valuable materials and reduce environmental impact. It involves the safe and responsible disposal of batteries, followed by the extraction and recycling of materials such as precious metals (e.g., lead, lithium, copper, nickel, cobalt) and other components (e.g., plastic, acid) that can be reused or repurposed. Battery recycling helps conserve natural resources, minimize pollution, and prevent hazardous substances from entering the environment.

Key Stakeholders

  • Governments and research organizations
  • Battery manufacturers
  • Electric vehicle manufacturers
  • Mining companies
  • Oil companies expanding into alternative energy
  • Recycling associations and Industrial bodies
  • Battery recycling manufacturers/traders

Report Objectives:

  • To analyze and forecast the market size of battery recycling in terms of value
  • To provide detailed information regarding the major factors (drivers, restraints, challenges, and opportunities) influencing the regional market
  • To analyze and forecast the global battery recycling market on the basis of source, chemistry, and region
  • To analyze the opportunities in the market for stakeholders and provide details of a competitive landscape for market leaders
  • To strategically analyze the micromarkets with respect to individual growth trends, growth prospects, and their contribution to the overall market
  • To forecast the size of various market segments based on five major regions: North America, Europe, Asia Pacific, South America, and the Middle East & Africa, along with their respective key countries
  • To track and analyze the competitive developments, such as new technology launches, joint ventures, partnerships, contracts, collaborations, acquisitions, agreements, investments, and expansions, in the market
  • To strategically profile the key players and comprehensively analyze their market shares and core competencies

Available Customizations:

With the given market data, MarketsandMarkets offers customizations according to the client-specific needs.

The following customization options are available for the report:

  • Additional country-level analysis of the battery recycling market
  • Profiling of additional market players (up to 5)

Product Analysis

  • Product matrix, which gives a detailed comparison of the product portfolio of each company.
Custom Market Research Services

We will customize the research for you, in case the report listed above does not meet with your exact requirements. Our custom research will comprehensively cover the business information you require to help you arrive at strategic and profitable business decisions.

Request Customization
Report Code
CH 5182
Published ON
Jun, 2023
Choose License Type
BUY NOW
  • SHARE
X
Request Customization
Speak to Analyst
Speak to Analyst
OR FACE-TO-FACE MEETING
PERSONALIZE THIS RESEARCH
  • Triangulate with your Own Data
  • Get Data as per your Format and Definition
  • Gain a Deeper Dive on a Specific Application, Geography, Customer or Competitor
  • Any level of Personalization
REQUEST A FREE CUSTOMIZATION
LET US HELP YOU!
  • What are the Known and Unknown Adjacencies Impacting the Battery Recycling Market
  • What will your New Revenue Sources be?
  • Who will be your Top Customer; what will make them switch?
  • Defend your Market Share or Win Competitors
  • Get a Scorecard for Target Partners
CUSTOMIZED WORKSHOP REQUEST
+1-888-600-6441
  • Call Us
  • +1-888-600-6441 (Corporate office hours)
  • +1-888-600-6441 (US/Can toll free)
  • +44-800-368-9399 (UK office hours)
CONNECT WITH US
ABOUT TRUST ONLINE
©2024 MarketsandMarkets Research Private Ltd. All rights reserved
DMCA.com Protection Status Website Feedback