
Beverage Flavoring Systems Market by Ingredient (Flavorings, Carriers, Enhancers), Type (Browns, Dairy, Botanicals, Fruits), Origin (Natural, Artificial, Nature-identical), Beverage (Alcoholic, Non-alcoholic), Form, and Region - Global Forecast to 2023
Market Segmentation
| Report Metrics | Details |
|
Market size available for years |
2018 - 2023 |
|
CAGR % |
6.1 |
Top 10 companies in Beverage Flavoring Systems Market


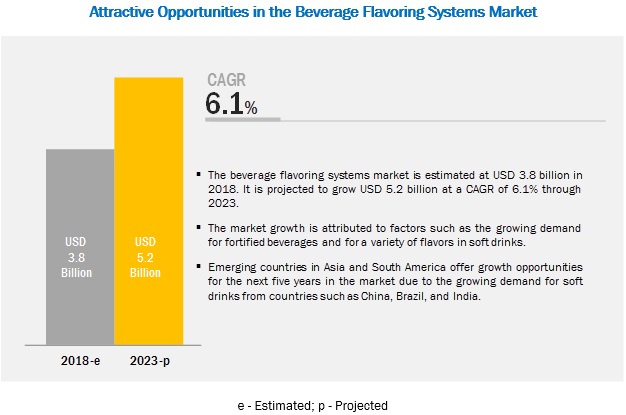
[214 Pages Report] The beverage flavoring systems market is projected to grow from USD 3.8 billion in 2018 to USD 5.2 billion by 2023, at a compound annual growth rate (CAGR) of 6.1% during the forecast period. The launch of advanced technologies in flavor processing, the increasing consumer inclination toward clean-label and organic products, and the favorable regulatory environment for fortified products are the factors projected to drive the market for beverage flavoring systems.
By ingredient, the flavoring agents segment is projected to account for the largest share in the beverage flavoring systems market
Since consumers are becoming more health conscious, the demand for low-salt, low-sugar, and low-fat beverages is high; this has been fueling the demand for taste modulators and taste-masking agents. The growth of this segment is also attributed to the growing consumption of fortified beverages, owing to their nutritional values. To cater to consumer demands for natural products combined with preservatives, beverage manufacturers are focusing on the application of natural flavoring ingredients such as natural stabilizers including pectin. Pectin is used for a wide range of applications such as fruit beverages and soft drinks.
The non-alcoholic segment, by beverage type, is projected to account for the largest market size during the forecast period
This segment holds a larger market due to the growing consumption of carbonated soft drinks, juices, and functional drinks. The carbonated soft drinks and juice industries are major application areas of flavoring systems. Consumer demand for innovative tastes encourages flavor manufacturers to launch new flavor products. The use of various types of flavors in beverage applications is largely attributed to the introduction and combination of different flavors to create an elegant and aromatic taste. For instance, flavors of fruits & vegetables and spices blended with beverages such as coffee and chocolate shake create a sweet and spicy, warm fall flavor.
The liquid segment in the beverage flavoring systems market is projected to record a faster growth during the forecast period
The dominance of the liquid segment is attributed to the ease of mixing and blending of liquid flavor ingredients. Liquid flavors can be easily mixed together to provide a homogeneous distribution of each flavor component. This is why most beverage manufacturers prefer the usage of liquid flavors. The market for liquid flavoring systems is projected to grow in the Asia Pacific region due to the growing demand for fruit juices, energy drinks, and carbonated drinks. Encapsulation is a major trend driving the liquid segment in the beverage flavoring systems market.
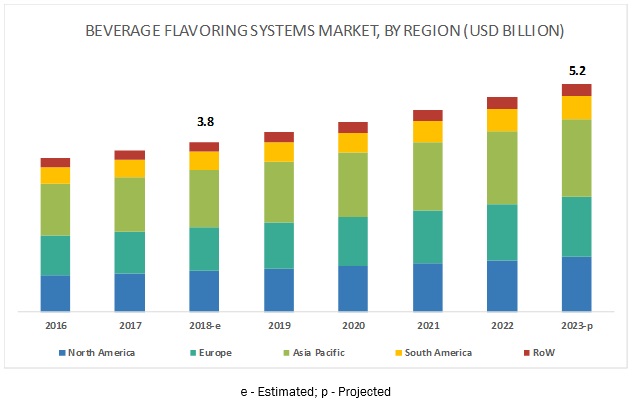
Asia Pacific is projected to account for the largest market share during the forecast period
The region is an emerging market, with investments from several multinational manufacturers, especially in countries such as China, India, and Japan; these are the major markets in the region. Emerging economies and the growing carbonated soft drinks market have been driving the growth of the beverage flavoring systems market in this region. The Asia Pacific region is a growing market for carbonated soft drinks. According to the World Economic Forum, from 2015 onward, China and India have been growing in terms of consumption of carbonated soft drinks.
Key Market Players
The key players in the beverage flavoring systems market are Cargill(US), Archer Daniels Midland Company (ADM) (US), Givaudan (Switzerland), Sensient Technologies (US), Kerry (Ireland), International Flavors and Fragrances (IFF) (US), Firmenich (Switzerland), Tate & Lyle (UK), MANE (France), Döhler (Germany), Takasago (Japan), Flavorchem Corporation (US), and Frutarom (Israel). These companies are focusing on new service & technology launches as well as acquiring the leading market position through the provision of a broad portfolio, catering to the varied requirements of the market, along with a focus on the diverse end-user segments.
Scope of Report
|
Report Metric |
Details |
|
Market Size for available years |
2016-2023 |
|
Base year considered |
2017 |
|
Forecast period |
2018-2023 |
|
Forecast units |
Value (USD) |
|
Segments covered |
Ingredient, Beverage Type, Type, Origin, Form, and Region |
|
Geographies covered |
Asia Pacific, North America, South America, Europe, and RoW |
|
Companies covered |
Cargill (US), Archer Daniels Midland Company (ADM) (US), Givaudan (Switzerland), Sensient Technologies (US), Kerry (Ireland), International Flavors and Fragrances (IFF) (US), Firmenich (Switzerland), Tate & Lyle (UK), MANE (France), Döhler (Germany), Takasago (Japan), Flavorchem Corporation (US), Frutarom (Israel) |
This research report categorizes the beverage flavoring systems market on the basis of ingredient, beverage type, type, origin, form, and region.
On the basis of ingredient, the beverage flavoring systems market has been segmented as follows:
-
Flavoring agents
- Flavors
- Taste modulators & taste masking agents
- Flavor carriers
- Flavor enhancers
- Others (include curing and pickling agents, preservatives, acidity regulators, emulsifiers, and stabilizers)
On the basis of beverage type, the beverage flavoring systems market has been segmented as follows:
- Alcoholic
-
Non-alcoholic
- Dairy
- Juices
- Carbonated soft drinks
- Functional drinks
- Others (flavored water, flavored juices, and eggnog)
On the basis of type, the beverage flavoring systems market has been segmented as follows:
- Chocolate and browns
- Dairy
- Herbs & botanicals
- Fruits & vegetables
- Others ( floral, honey, sensory, masking, and alcoholic flavors)
On the basis of form, the beverage flavoring systems market has been segmented as follows:
- Dry
- Liquid
On the basis of origin, the beverage flavoring systems market has been segmented as follows:
- Natural
- Artificial
- Nature-identical
On the basis of region, the beverage flavoring systems market has been segmented as follows:
- North America
- Europe
- Asia Pacific
- South America
- RoW (includes Africa and the Middle East)
Key Questions addressed by the report
- What are the growth opportunities for the beverage flavoring systems market?
- What are the different flavoring ingredients that are used in industries while manufacturing beverages?
- What are the various forms in which beverage flavors are available?
- What are some of the patents filed in the field of beverage flavoring systems?
- What are some of the major challenges and restraints for the manufacturers in this market?
Table of Contents
1 Introduction (Page No. - 20)
1.1 Objectives of the Study
1.2 Market Definition
1.3 Market Segmentation
1.4 Regions Covered
1.5 Periodization Considered
1.6 Currency
1.7 Stakeholders
2 Research Methodology (Page No. - 25)
2.1 Research Data
2.1.1 Secondary Data
2.1.2 Primary Data
2.1.2.1 Breakdown of Primaries
2.2 Market Size Estimation
2.2.1 Bottom-Up Approach
2.2.2 Top-Down Approach
2.3 Data Triangulation
2.3.1 Market Breakdown and Data Triangulation
2.4 Research Assumptions
2.5 Research Limitations
3 Executive Summary (Page No. - 32)
4 Premium Insights (Page No. - 38)
4.1 Opportunities in the Beverage Flavoring Systems Market
4.2 Beverage Flavoring Systems Market: Key Countries
4.3 Beverage Flavoring Systems Market, By Ingredient and Region
4.4 Beverage Flavoring Systems Market, By Beverage Type and Region
4.5 Developed vs Developing Markets for Beverage Flavoring Systems
4.6 Asia Pacific: Beverage Flavoring Systems Market, By Origin and Country, 2017
5 Market Overview (Page No. - 42)
5.1 Introduction
5.1.1 Beverage and Beverage Flavor Trends, 2018–2019
5.2 Value Chain
5.3 Market Dynamics
5.3.1 Drivers
5.3.1.1 Growing Demand for A Variety of Innovative Flavors in Soft Drinks
5.3.1.2 Launch of Advanced Technologies for Flavor Processing
5.3.1.2.1 Non-Thermal Treatments – HPP & PEF to Enhance Flavor Retention
5.3.1.2.2 Demand for Novel Flavors to Fuel the Market for Flavor Systems
5.3.1.3 Favorable Regulatory Environment for Fortified Products
5.3.1.4 Consumer Inclination Toward Clean-Label and Organic Products Drives the Natural Flavors Systems Market Growth
5.3.1.5 Growing Demand for Fortified Beverages
5.3.2 Restraints
5.3.2.1 Limited Availability of Natural Sources of High-Quality Raw Materials
5.3.2.2 Growing Consumer Awareness About Food Additives
5.3.3 Opportunities
5.3.3.1 Launch of Advanced Flavor Systems
5.3.3.1.1 Therapeutic Flavor Systems
5.3.3.1.2 Vegan Flavor Systems
5.3.3.1.3 Certified Flavor Systems
5.3.3.2 Floral Flavor Systems
5.3.3.3 Launch of Cost-Effective Flavor Systems
5.3.3.3.1 Launch of Cost-Effective Encapsulated Systems for Flavor Retention
5.3.3.4 Developing Multifunctional Flavor Systems
5.3.3.5 Emerging Economies of Asia Pacific and South America to Offer High-Growth Opportunities
5.3.3.6 Growth in Demand for Carbonated Soft Drinks in Emerging Economies
5.3.4 Challenges
5.3.4.1 Need to Increase the Cost of Products With Advanced Flavoring Systems Due to High Processing Cost
6 Patent Analysis (Page No. - 63)
6.1 Introduction
7 Market for Beverage Flavoring Systems, By Ingredients (Page No. - 72)
7.1 Introduction
7.2 Flavoring Agents
7.2.1 Fruit and Vegetables Flavoring Agents are Gaining Consumer Attention
7.2.2 Flavors
7.2.3 Taste Modulators and Taste Masking Agents
7.2.3.1 Taste Modulators
7.2.3.2 Taste Masking Agents
7.3 Flavor Carriers
7.3.1 Demand for Effective Flavor Handling is Fueling Flavor Carriers Demand
7.4 Flavor Enhancers
7.4.1 The Rising Demand for Energy and Sports Drinks to Drive the Flavor Enhancer Segment
7.5 Others
7.5.1 The Rising Demand for Fruit Juices to Drive the Acidity Regulators Market
8 Market for Beverage Flavoring Systems, By Beverage Type (Page No. - 81)
8.1 Introduction
8.2 Alcoholic
8.2.1 Rise in Demand for Flavored Beer Across the World to Boost the Demand for Beverage Flavoring Systems
8.3 Non-Alcoholic
8.3.1 Fortified Beverages are Fueling Market Growth, With Rising Health Awareness Among Consumers
8.3.2 Dairy-Based Beverages
8.3.2.1 Encapsulation Technology: Advanced Solution to Launch Fortified Dairy Beverage Flavoring Systems
8.3.3 Fruit- & Vegetable-Based Juices
8.3.3.1 Natural Flavors Account for Significant Market Size in the Juices Segment
8.3.4 Carbonated Soft Drinks
8.3.4.1 The Launch of Fruit-Based Low-Calorie Drinks Fuels the Market Growth for Beverage Flavoring Systems
8.3.5 Functional Drinks
8.3.5.1 Increasing Health Awareness is One of the Major Factors Driving the Functional Drinks Market
8.3.6 Others
8.3.6.1 The Rise in Disposable Income and Urbanization are Fueling Market Growth of This Segment
9 Market for Beverage Flavoring Systems, By Type (Page No. - 92)
9.1 Introduction
9.2 Chocolates & Browns
9.2.1 Increasing Flavored Milk Market Offering Momentum to the Chocolates & Browns Segment
9.3 Dairy
9.3.1 Asia Pacific Dominated the Dairy Segment of the Beverage Flavoring Systems Market
9.4 Herbs & Botanical
9.4.1 Increasing Trend for Herbs and Botanical Flavors Driving the Beverage Flavoring Systems Market
9.5 Fruits & Vegetables
9.5.1 Growing Demand for Health Drinks and Vegetable-Infused Drinks Fuels the Market
9.6 Others
9.6.1 Medicinal Drinks and Sugar Reduction are Major Trends
10 Market for Beverage Flavoring Systems, By Origin (Page No. - 99)
10.1 Introduction
10.2 Natural
10.2.1 Europe Dominates the Natural Segment of Beverage Flavouring Systems Market Due to Increasing Demand for Clean-Label Products
10.3 Artificial
10.3.1 Controlled Regulatory Environment By the FDA is Ensuring Food Safety Associated With the Use of Artificial Flavouring Systems
10.4 Nature-Identical
10.4.1 Nature-Identical Substances Dominating the Market Due to Lower Cost and Easy Availability of Products, Than the Natural Ones
11 Market for Beverage Flavoring Systems, By Form (Page No. - 105)
11.1 Introduction
11.2 Liquid
11.2.1 Encapsulation is A Major Trend Driving the Liquid Segment in the Beverage Flavoring Systems Market
11.3 Dry
11.3.1 Increasing Demand for Dry Mix Beverages Drives the Growth of the Dry Beverage Flavouring Systems Market
12 Market for Beverage Flavoring Systems, By Region (Page No. - 110)
12.1 Introduction
12.2 North America
12.2.1 US
12.2.1.1 Shifting Consumer Preferences to Healthier Alternatives in Foods & Beverages
12.2.2 Canada
12.2.2.1 Sparkling Flavored Water Beverages are Becoming Increasingly Popular in the Canadian Market
12.2.3 Mexico
12.2.3.1 The Demand for Non-Alcoholic Flavored Beverages to Fuel the Market Growth
12.3 Europe
12.3.1 Germany
12.3.1.1 The Consumer Demand for Fruit-Flavored Craft Beer to Fuel the Market Growth
12.3.2 UK
12.3.2.1 The UK is Witnessing A Rise in the Demand for Low-Sugar Soft Drinks and Sparkling Juices
12.3.3 France
12.3.3.1 Floral and Fruit Flavors in Beverages Witness Rising Popularity Among Consumers
12.3.4 Italy
12.3.4.1 The Demand for Flavored Cocktails and Spirits to Drive the Market in Italy
12.3.5 Spain
12.3.5.1 Spain Faces Increased Demand for Flavored Varieties of Non-Alcoholic Beverages
12.3.6 Rest of Europe
12.3.6.1 Organic Beverages are Gaining Popularity in Various Countries of Rest of Europe
12.4 Asia Pacific
12.4.1 China
12.4.1.1 Launch of Innovative Flavored Drink to Create Significant Opportunities in the Country
12.4.2 Japan
12.4.2.1 Favorable Regulatory Environment to Offer Support for Advancement of Beverage Flavoring Systems
12.4.3 India
12.4.3.1 Growing Investment in Beverage Processing Sector is Fueling Flavoring Systems Market in the Country
12.4.4 Australia & New Zealand
12.4.4.1 Increasing Demand for Fortification to Offer Opportunities to Launch Advanced Beverage Flavoring Systems
12.4.5 Rest of Asia Pacific
12.4.5.1 Growing Beverage Consumption With Growth in Economy is Creating Market Opportunity in the Region
12.5 South America
12.5.1 Brazil
12.5.1.1 Growing Demand for Energy Drinks and Soft Drinks Driving the Market in Brazil
12.5.2 Argentina
12.5.2.1 Growing Investments By Soft Drink Companies to Fuel the Demand for Beverage Flavoring Systems in the Country
12.5.3 Rest of South America
12.5.3.1 Alcoholic Beverage Flavoring Systems Have High-Growth Opportunities in the Region
12.6 Rest of the World (RoW)
12.6.1 Africa
12.6.1.1 Growing Consumption of Alcoholic Drinks is Driving Alcoholic Beverage Flavoring Systems in the Country
12.6.2 Middle East
12.6.2.1 Market Leaders Have Opportunity to Enhance Their Presence in the Region By Mergers and Acquisitions Strategy
13 Competitive Landscape (Page No. - 157)
13.1 Overview
13.2 Competitive Leadership Mapping
13.2.1 Dynamic Differentiators
13.2.2 Innovators
13.2.3 Visionary Leaders
13.2.4 Emerging Companies
13.3 Ranking of Key Players, 2017
13.4 Competitive Scenario
13.4.1 New Product Launches
13.4.2 Expansions and Investments
13.4.3 Acquisitions
13.4.4 Partnerships, Joint Ventures, and Collaborations
14 Company Profiles (Page No. - 165)
(Business Overview, Products Offered, Recent Developments, SWOT Analysis, and MnM View)*
14.1 Cargill
14.2 Archer Daniels Midland Company (ADM)
14.3 Givaudan
14.4 Sensient Technologies
14.5 Kerry
14.6 International Flavors and Fragrances (IFF)
14.7 Firmenich
14.8 Tate & Lyle
14.9 Mane
14.10 Döhler
14.11 Takasago
14.12 Flavorchem Corporation
14.13 Frutarom
15 Appendix (Page No. - 199)
15.1 Discussion Guide
15.2 More Company Developments
15.2.1 New Product Launches
15.2.2 Expansions and Investments
15.2.3 Acquisitions
15.2.4 Partnerships, Mergers, and Collaborations
15.3 Knowledge Store: Marketsandmarkets’ Subscription Portal
15.4 Available Customizations
15.5 Related Reports
15.6 Author Details
List of Tables (117 Tables)
Table 1 US Dollar Exchange Rates Considered for the Study, 2015–2017
Table 2 Beverage and Beverage Flavor Trends, 2018–2019
Table 3 Flavors: Regulations Set By Different Regions/Countries
Table 4 Benefits From Certification and Branding for Different Interest Groups
Table 5 Patents Pertaining to Flavor Systems
Table 6 Beverage Flavoring Systems Market Size, By Ingredients, 2016–2023 (USD Million)
Table 7 Flavoring Agents: Beverage Flavoring Systems Market Size, By Category, 2016–2023 (USD Million)
Table 8 Flavoring Agents for Taste Masking
Table 9 Flavoring Agents: BFS Market Size, By Region 2016–2023 (USD Million)
Table 10 Flavor Carriers: Beverage Flavoring Systems Size, By Region, 2016–2023 (USD Million)
Table 11 Flavor Enhancers: Beverage Flavoring Systems Size, By Region, 2016–2023 (USD Million)
Table 12 Others: BFS Market Size, By Region, 2016–2023 (USD Million)
Table 13 BFS Market Size, By Beverage Type, 2016–2023 (USD Million)
Table 14 Non-Alcoholic BFS Market Size, By Beverage Sub-Type, 2016–2023 (USD Million)
Table 15 Alcoholic Beverage Flavoring Systems Market Size, By Region, 2016–2023 (USD Million)
Table 16 Non-Alcoholic Beverage Flavoring Systems Market Size, By Region, 2016–2023 (USD Million)
Table 17 Dairy-Based Beverages: Non-Alcoholic BFS Market Size, By Region, 2016–2023 (USD Million)
Table 18 Fruit- & Vegetable-Based Juices: Non-Alcoholic BFS Market Size, By Region, 2016–2023 (USD Million)
Table 19 Carbonated Soft Drinks: Non-Alcoholic BFS Market Size, By Region, 2016–2023 (USD Million)
Table 20 Functional Drinks: Non-Alcoholic BFS Market Size, By Region, 2016–2023 (USD Million)
Table 21 Others: Non-Alcoholic BFS Market Size, By Region, 2016–2023 (USD Million)
Table 22 By Market Size, By Type, 2016–2023 (USD Million)
Table 23 Chocolates & Browns: By Market Size, By Region, 2016–2023 (USD Million)
Table 24 Dairy: By Market Size, By Region, 2016–2023 (USD Million)
Table 25 Herbs & Botanical: By Market Size, By Region, 2016–2023 (USD Million)
Table 26 Fruits & Vegetables: By Market Size, By Region, 2016–2023 (USD Million)
Table 27 Others: Beverage Flavoring Systems Market Size, By Region, 2016–2023 (USD Million)
Table 28 Beverage Flavoring Systems Market Size, By Origin, 2016–2023 (USD Million)
Table 29 Natural: By Market Size, By Region, 2016–2023 (USD Million)
Table 30 Artificial: By Market Size, By Region, 2016–2023 (USD Million)
Table 31 Nature-Identical: By Market Size, By Region, 2016–2023 (USD Million)
Table 32 BFS Market Size, By Form, 2016–2023 (USD Million)
Table 33 Liquid: By Market Size, By Region, 2016–2023 (USD Million)
Table 34 Dry: BFS Market Size, By Region, 2016–2023 (USD Million)
Table 35 BFS Market Size, By Region, 2016–2023 (USD Million)
Table 36 North America: By Market Size, By Country, 2016–2023 (USD Million)
Table 37 North America: By Market Size, By Beverage Type, 2016–2023 (USD Million)
Table 38 North America: By Market Size, By Beverage Sub-Type, 2016–2023 (USD Million)
Table 39 North America: By Market Size, By Type, 2016–2023 (USD Million)
Table 40 North America: By Market Size, By Origin, 2016–2023 (USD Million)
Table 41 North America: By Market Size, By Form, 2016–2023 (USD Million)
Table 42 North America: Flavor Carriers Market Size, By Ingredient, 2016–2023 (USD Million)
Table 43 North America: By Market Size, By Flavoring Agents, 2016–2023 (USD Million)
Table 44 North America: Beverage Flavoring Systems Market Size, By Flavor Carriers, 2016–2023 (USD Million)
Table 45 North America: Beverage Flavoring Systems Market Size, By Flavor Enhancers, 2016–2023 (USD Million)
Table 46 North America: By Market Size, By Other Ingredients, 2016–2023 (USD Million)
Table 47 US: Beverage Flavoring Market Size, By Ingredient, 2016–2023 (USD Million)
Table 48 Canada: Beverage Flavoring Systems Market Size, By Ingredient, 2016–2023 (USD Million)
Table 49 Mexico: By Market Size, By Ingredient, 2016–2023 (USD Million)
Table 50 Europe: By Market Size, By Country, 2016–2023 (USD Million)
Table 51 Europe: By Market Size, By Beverage Type, 2016–2023 (USD Million)
Table 52 Europe: By Market Size, By Beverage Sub-Type, 2016–2023 (USD Million)
Table 53 Europe: By Market Size, By Type, 2016–2023 (USD Million)
Table 54 Europe: By Market Size, By Origin, 2016–2023 (USD Million)
Table 55 Europe: By Market Size, By Form, 2016–2023 (USD Million)
Table 56 Europe: Beverage Flavoring Systems Market Size, By Ingredient, 2016–2023 (USD Million)
Table 57 Europe: By Market Size, for Flavoring Agents, 2016–2023 (USD Million)
Table 58 Europe: By Market Size, By Flavor Carriers, 2016–2023 (USD Million)
Table 59 Europe: Beverage Flavoring Systems Market Size, for Flavor Enhancers, 2016–2023 (USD Million)
Table 60 Europe: By Market Size, for Other Ingredients, 2016–2023 (USD Million)
Table 61 Germany: Beverage Flavoring Market Size, By Ingredient, 2016–2023 (USD Million)
Table 62 UK: By Market Size, By Ingredient, 2016–2023 (USD Million)
Table 63 France: Beverage Flavoring Systems Market Size, By Ingredient, 2016–2023 (USD Million)
Table 64 Italy: By Market Size, By Ingredient, 2016–2023 (USD Million)
Table 65 Spain: Beverage Flavoring Systems Market Size, By Ingredient, 2016–2023 (USD Million)
Table 66 Rest of Europe: By Market Size, By Ingredient, 2016–2023 (USD Million)
Table 67 Asia Pacific: By Market Size, By Country, 2016–2023 (USD Million)
Table 68 Asia Pacific: By Market Size, By Beverage Type, 2016–2023 (USD Million)
Table 69 Asia Pacific: By Market Size, By Beverage Sub-Type, 2016–2023 (USD Million)
Table 70 Asia Pacific: Beverage Flavoring Systems Market Size, By Type, 2016–2023 (USD Million)
Table 71 Asia Pacific: By Market Size, By Origin, 2016–2023 (USD Million)
Table 72 Asia Pacific: By Market Size, By Form, 2016–2023 (USD Million)
Table 73 Asia Pacific: By Market Size, By Ingredient, 2016–2023 (USD Million)
Table 74 Asia Pacific: By Market for Flavoring Agents, By Country, 2016–2023 (USD Million)
Table 75 Asia Pacific: By Market for Flavor Carriers, By Country, 2016–2023 (USD Million)
Table 76 Asia Pacific: By Market for Flavor Enhancers, By Country, 2016–2023 (USD Million)
Table 77 Asia Pacific: By Market for Other Ingredients, By Country, 2016–2023 (USD Million)
Table 78 China: By Market Size, By Ingredient, 2016–2023 (USD Million)
Table 79 Japan: By Market Size, By Ingredient, 2016–2023 (USD Million)
Table 80 India: By Market Size, By Ingredient, 2016–2023 (USD Million)
Table 81 Australia & New Zealand: Beverage Flavoring Systems Market Size, By Ingredient, 2016–2023 (USD Million)
Table 82 Rest of Asia Pacific: By Market Size, By Ingredient, 2016–2023 (USD Million)
Table 83 South America: By Market Size, By Country, 2016–2023 (USD Million)
Table 84 South America: By Market Size, By Beverage Type, 2016–2023 (USD Million)
Table 85 South America: By Market Size, By Beverage Subtype, 2016–2023 (USD Million)
Table 86 South America: By Market Size, By Type, 2016–2023 (USD Million)
Table 87 South America: By Market Size, By Origin, 2016–2023 (USD Million)
Table 88 South America: By Market Size, By Form, 2016–2023 (USD Million)
Table 89 South America: By Market Size, By Ingredient, 2016–2023 (USD Million)
Table 90 South America: Beverage Flavoring Systems Market Size for Flavoring Agents, By Country, 2016–2023 (USD Million)
Table 91 South America: By Market Size for Flavor Carriers, By Country, 2016–2023 (USD Million)
Table 92 South America: By Market Size for Flavor Enhancers, By Country, 2016–2023 (USD Million)
Table 93 South America: By Market Size for Other Ingredients, By Country, 2016–2023 (USD Million)
Table 94 Brazil: By Market Size, By Ingredient, 2016–2023 (USD Million)
Table 95 Argentina: By Market Size, By Ingredient, 2016–2023 (USD Million)
Table 96 Rest of South America: Beverage Flavoring Systems Market Size, By Ingredient, 2016–2023 (USD Million)
Table 97 RoW: Beverage Flavoring Systems Market Size, By Region, 2016–2023 (USD Million)
Table 98 RoW: By Market Size, By Beverage Type, 2016–2023 (USD Million)
Table 99 RoW: By Market Size, By Beverage Subtype, 2016–2023 (USD Million)
Table 100 RoW: By Market Size, By Type, 2016–2023 (USD Million)
Table 101 RoW: Beverage Flavoring Systems Market Size, By Origin, 2016–2023 (USD Million)
Table 102 RoW: By Market Size, By Form, 2016–2023 (USD Million)
Table 103 RoW: By Market Size, By Ingredient, 2016–2023 (USD Million)
Table 104 RoW: By Market Size for Flavoring Agents, By Region, 2016–2023 (USD Million)
Table 105 RoW: By Market Size for Flavor Carriers, By Region, 2016–2023 (USD Million)
Table 106 RoW: By Market Size for Flavor Enhancers, By Region, 2016–2023 (USD Million)
Table 107 RoW: Beverage Flavoring Systems Market Size for Other Ingredients, By Region, 2016–2023 (USD Million)
Table 108 Africa: By Market Size, By Ingredient, 2016–2023 (USD Million)
Table 109 Middle East: By Market Size, By Ingredient, 2016–2023 (USD Million)
Table 110 New Product Launches, 2015–2018
Table 111 Expansions and Investements, 2018
Table 112 Acquisitions, 2018
Table 113 Partnerships, Joint Ventures, and Collaborations, 2016–2018
Table 114 New Product Launches, 2014
Table 115 Expansions and Investments, 2013-2018
Table 116 Acquisitions, 2013-2018
Table 117 Partnerships, Mergers, and Collaborations, 2013–2018
List of Figures (64 Figures)
Figure 1 Beverage Flavoring Systems Market: Research Design
Figure 2 BFS Market: Bottom-Up Approach
Figure 3 Beverage Flavoring Systems Market: Top-Down Approach
Figure 4 BFS Market Snapshot, By Ingredient, 2018 vs 2023
Figure 5 Beverage Flavoring Systems Market Size, By Beverage Type, 2018–2023
Figure 6 BFS Market Size, By Origin, 2018–2023
Figure 7 Beverage Flavoring Systems Market, By Type, 2018–2023
Figure 8 BFS Market Size, By Form, 2018–2023
Figure 9 Europe to Grow at the Highest CAGR in the Market, 2018–2023
Figure 10 BFS Market, By Region
Figure 11 Growing Soft Drinks Industry to Drive the Growth of the Market
Figure 12 US and China Dominated the Global Beverage Flavoring Systems Market in 2017
Figure 13 Flavoring Agents Dominated the Market for Beverage Flavoring Systems in 2017
Figure 14 Non-Alcoholic Segment Dominated the Market in 2017
Figure 15 Developing Countries to Emerge at Higher Growth Rates During the Forecast Period
Figure 16 Asia Pacific Accounted for the Largest Share in 2017
Figure 17 Process Flow: Flavor Systems
Figure 18 Beverage Flavoring Systems Market: Value Chain
Figure 19 Market Dynamics: Beverage Flavoring Systems Market
Figure 20 US: Flavored Syrup and Concentrate Market Share, 2014
Figure 21 Number of Flavored Syrup and Concentrate Manufacturing Facilities in the Us, 2014
Figure 22 US Soft Drinks Import, 2010–2015 (USD Million)
Figure 23 Europe Soft Drink Sales, 2011–2016 (Million Liters)
Figure 24 Consumer Perception and Expectation of Natural Label on Processed and Packaged Food, 2015
Figure 25 Top 10 Countries With the Largest Markets for Organic Food, 2016 (USD Million)
Figure 26 Top Ten Countries With the Largest Number of Organic Producers, 2016
Figure 27 Process Flow: Encapsulation of Flavor Molecules
Figure 28 Asia: Alcohol Consumption, 2015 (Liters Per Capita)
Figure 29 Patent Insights
Figure 30 By Market Size, By Ingredients, 2018 vs 2023 (USD Million)
Figure 31 Flavoring Agents: BFS Market Size, By Region, 2018 vs 2023 (USD Million)
Figure 32 By Market Size, By Beverage Type, 2018 vs 2023 (USD Million)
Figure 33 Non-Alcoholic: Beverage Flavoring Systems Market Size, By Region, 2018 vs 2023
Figure 34 India: Major Flavors in New Product Launch of Dairy Beverages, 2017-18 (% of All Flavors Launched)
Figure 35 By Market Size, By Type, 2018 vs 2023 (USD Million)
Figure 36 Fruits & Vegetables: By Market Size, By Region, 2018 vs 2023 (USD Million)
Figure 37 By Market Size, By Origin, 2018 vs 2023 (USD Million)
Figure 38 Nature-Identical: By Market Size, By Region, 2018 vs 2023 (USD Million)
Figure 39 By Market Size, By Form, 2018 vs 2023 (USD Million)
Figure 40 Liquid: By Market Size, By Region, 2018 vs 2023 (USD Million)
Figure 41 UK to Record the Fastest Growth During the Forecast Period in the Market
Figure 42 North America: BFS Market Snapshot
Figure 43 Europe: Beverage Flavoring Systems Market Snapshot, 2017
Figure 44 Asia Pacific: BFS Market Snapshot, 2017
Figure 45 BFS Market (Global): Competitive Leadership Mapping, 2017
Figure 46 Key Developments of the Leading Players in the Market, 2013-2018
Figure 47 Firmenich, Led the Beverage Flavor Systems Market In, 2017
Figure 48 Market Evaluation Framework
Figure 49 Cargill: Company Snapshot
Figure 50 Cargill: SWOT Analysis
Figure 51 Archer Daniels Midland Company (ADM): Company Snapshot
Figure 52 Archer Daniels Midland Company (ADM): SWOT Analysis
Figure 53 Givaudan: Company Snapshot
Figure 54 Givaudan: SWOT Analysis
Figure 55 Sensient Technologies: Company Snapshot
Figure 56 Sensient Technologies: SWOT Analysis
Figure 57 Kerry: Company Snapshot
Figure 58 Kerry: SWOT Analysis
Figure 59 International Flavors and Fragrances (IFF): Company Snapshot
Figure 60 Firmenich: Company Snapshot
Figure 61 Tate & Lyle: Company Snapshot
Figure 62 Mane: Company Snapshot
Figure 63 Takasago: Company Snapshot
Figure 64 Frutarom: Company Snapshot
The study involves four major activities to estimate the current market size for beverage flavoring systems. Exhaustive secondary research was done to collect information on the market, the peer market, and parent market. The next step was to validate these findings, assumptions, and sizing with industry experts across the value chain through primary research. Both the top-down and bottom-up approaches were employed to estimate the complete market size. Thereafter, market breakdown and data triangulation were used to estimate the market size of segments and subsegments.
Secondary Research
In the secondary research process, various secondary sources such as Hoovers, Bloomberg BusinessWeek, and Dun & Bradstreet were referred to, so as to identify and collect information for this study. These secondary sources included annual reports, press releases & investor presentations of companies, white papers, certified publications, articles by recognized authors, gold standard & silver standard websites, food safety organizations, regulatory bodies, trade directories, and databases.
Primary Research
The beverage flavoring systems market comprises several stakeholders such as suppliers, R&D institutes, and end-product manufacturers in the supply chain. The demand side of the market is characterized by the presence of importers/exporters, distributors, and manufacturers of flavors and beverages. The supply side is characterized by the presence of key providers of beverage flavoring systems. Various primary sources from the supply and demand sides of both markets have been interviewed to obtain qualitative and quantitative information. Following are the breakdown of primary respondents:
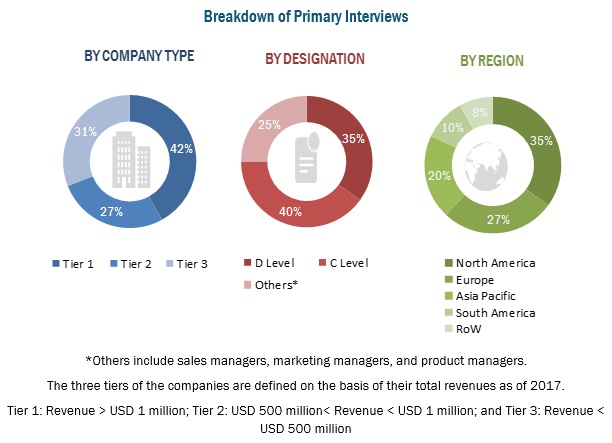
To know about the assumptions considered for the study, download the pdf brochure
Market Size Estimation
Both the top-down and bottom-up approaches were used to estimate and validate the total size of the beverage flavoring systems market. These methods were also used extensively to estimate the size of various subsegments in the market. The research methodology used to estimate the market size includes the following:
- Key players in the industry and markets were identified through extensive secondary research.
- The industry’s supply chain and market size, in terms of value, were determined through primary and secondary research processes.
- All percentage shares, splits, and breakdowns were determined using secondary sources and verified through primary sources.
Data Triangulation
After arriving at the overall market size using the market size estimation processes as explained above the market was split into several segments and subsegments. To complete the overall market engineering process and arrive at the exact statistics of each market segment and subsegment, the data triangulation, and market breakdown procedures were employed, wherever applicable. The data was triangulated by studying various factors and trends from both the demand and supply sides. Along with this, the market size has been validated using both the top-down and bottom-up approaches.
Report Objectives
- Determining and projecting the size of the beverage flavoring systems market with respect to ingredients, beverage type, type, origin, form, and regional markets, over a five-year period ranging from 2018 to 2023
- Identifying attractive opportunities in the market by determining the largest and fastest-growing segments across regions
- Analyzing the demand-side factors on the basis of the following:
- Impact of macro- and micro-economic factors on the market
- Shifts in demand patterns across different sub-segments and regions
- Identifying and profiling key players in the beverage flavoring systems market
- Providing a comparative analysis of the market leaders on the basis of the following:
- Product offerings
- Business strategies
- Strengths, weaknesses, opportunities, and threats
- Key financials
- Understanding the competitive landscape and identifying major growth strategies adopted by players across the key regions
- Analyzing the supply chain and regulatory frameworks across regions and their impact on prominent market players
- Providing insights on key investments in product innovations and technology and patent registrations
Available Customizations
With the given market data, MarketsandMarkets offers customizations according to a company’s specific needs.
The following customization options are available for the report:
Segment Analysis
- Product matrix, which gives a detailed comparison of the product portfolio of each company
Regional Analysis
- Further breakdown of the Asia Pacific beverage flavoring systems market, by country
- Further breakdown of the European beverage flavoring systems market, by country
- Further breakdown of the RoW beverage flavoring systems market, by country
Company Information
- Detailed analysis and profiling of additional market players (up to 5)


Growth opportunities and latent adjacency in Beverage Flavoring Systems Market