Booster Compressor Market by Cooling Type (Air, Water), Stage (Single, Double, Multi), Pressure Rating (14-40 bar, 41-100, 101-350, >350), End use Industry (oil & gas, process, chemicals, power) and Region - Global Forecast to 2023


[127 Pages Report] The global booster compressor market was valued at USD 1.86 Billion in 2017 and is projected to reach USD 2.39 Billion by 2023, at a CAGR of 4.50% during the forecast period.
Objectives of the study
- To define and segment the booster compressor market on the basis of cooling type, compression stage, pressure, end-user, and region
- To provide detailed information about major factors influencing the growth of the market (drivers, restraints, opportunities, and industry-specific challenges)
- To strategically analyze the booster compressors market with respect to individual growth trends, future expansions, and contributions to the market
- To analyze booster compressor market opportunities for stakeholders and details of a competitive landscape for market leaders
- To forecast the growth of the market with respect to the major regions (Asia Pacific, Europe, North America, South America, and the Middle East & Africa)
- To strategically profile key players and comprehensively analyze their market rankings and core competencies
- To analyze competitive developments, such as new product launches, mergers & acquisitions, expansions and investments, and contracts & agreements, in the booster compressors market
Research Methodology
This research study involved the use of extensive secondary sources, directories, journals on booster compressor, generation technologies, and other related rental markets; newsletters and databases such as Hoover�s, Bloomberg, Businessweek, and Factiva, to identify and collect information useful for a technical, market-oriented, and commercial study of the global booster compresor market. The primary sources include several industry experts from the core and related industries, vendors, preferred suppliers, technology developers, alliances, and organizations related to all the segments of this industry�s value chain. The research methodology has been explained below.
- Study of annual revenues and market developments of the major players providing booster compressors market
- Assessment of future trends and growth of end-users
- Assessment of the booster compressors market with respect to the solutions used for different applications at various end-user industry
After arriving at the overall market size, the total market was split into several segments and subsegments. The figure given below illustrates the breakdown of primary interviews conducted during the research study based on company type, designation, and region.
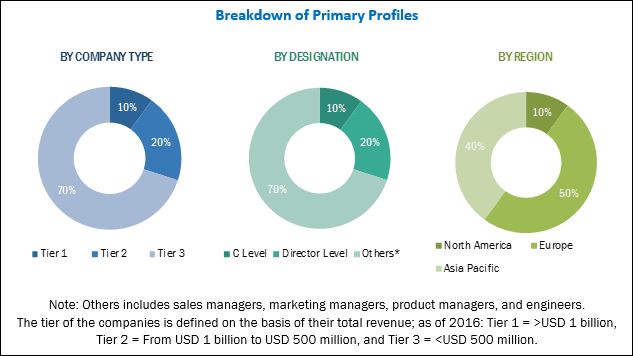
To know about the assumptions considered for the study, download the pdf brochure
Major players operating in the booster compressor market include Atlas Copco (Sweden), Ingersoll Rand (Republic of Ireland), Kaeser Kompressoren (Germany), SAUER Compressor (Germany), and BAUER Kompressoren (Germany).
Target Audience:
- End-use industries such as oil & gas and petrochemical and chemical
- Booster compressor manufacturers and suppliers
- Government and research organizations
- Institutional investors
- Investment banks
- National and local government organizations
- OEM suppliers
Scope of the Report:
- By Cooling Type
- Air-cooled
- Water-cooled
- By Compression Stage
- Single stage
- Double stage
- Multistage
- By Pressure
- 14�40 bar
- 41�100 bar
- 101�350 bar
- Above 351 bar
- By End-User
- Oil & Gas
- Process Industry
- Chemical & Petrochemical
- Power Generation
- Others
- By Region
- Asia Pacific
- Europe
- North America
- South America
- Middle East & Africa
Available Customizations:
With the given market data, MarketsandMarkets offers customizations as per the client�s specific needs. The following customization options are available for this report:
Company Information
Detailed analyses and profiling of additional market players (up to 5)
The global booster compressor market is projected to reach a market size of USD 2.39 Billion in 2023, growing at a CAGR of 4.50%, from an estimated USD 1.92 Billion in 2018. Booster compressors are used in different applications in industries such as air boosting, gas bosting, air separation, and compression of gases for storage and transportation. Thus, the growing industrialization in developing countries will create demand for booster compressors.
The report segments the booster compressor market, by cooling type, into water-cooled and air-cooled. The air-cooled segment is expected to be the fastest growing segment by 2023. Air booster compressors are more cost-effective than water booster compressors. The air-cooled booster compressors are used as a multistage booster compressor for different application, as a nitrogen compressor of inert gases from generators or storage bundles, and as gas compressors for the compression of methane from pipelines. The air-cooled booster compressors are projected to grow as they are used in a number of applications in various industries.
The oil & gas industry is expected to be the fastest growing segment of the booster compressor market during the forecast period. Booster compressors are used in different applications in the oil & gas industry such as drilling activity, hydrocarbon blanketing, nitrogen generation, and compression station. Booster compressors are used at compressor stations for maintaining the pressure of the gas during transits. The demand for natural gas is increasing from developing economies. Therefore, there is a rise in investments in LNG pipelines, which is expected to propel the growth of booster compressors during forecast period.
In this report, the booster compressor market has been analyzed with respect to 5 regions, namely, North America, Europe, Asia Pacific, South America, and the Middle East & Africa.
The Asia Pacific market is estimated to be the largest in the booster compressor market during the forecast period. The growth of the market in Asia Pacific is attributed toward the growing industrialization in the region. The manufacturing industries are increasing in countries such as China, India, Taiwan, and Indonesia. The manufacturing industries require booster compressors for different applications such as laser cutting, high pressure input for different machineries, and gas boosting. Thus, the growing industrialization in the region is likely to create a market opportunity for booster compressors.
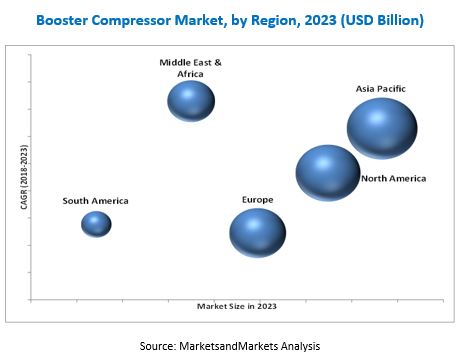
The Middle East & Africa region is projected to be the fastest growing booster compressor market during the projected period. The growth of the market in the Middle East & Africa is attributed toward the rising drilling and midstream investments in oil & gas. Increasing investments in oil & gas are due to the growing demand for natural gas in China and India.
The availability of alternative products such as standalone high-pressure compressors can act as a restraint for the market. The leading players in the booster compressor market include Atlas Copco (Sweden), Ingersoll Rand (Republic of Ireland), Kaeser Kompressoren (Germany), SAUER Compressor (Germany), and BAUER Kompressoren (Germany). Mergers & acquisitions was the most commonly adopted strategy by the top players.
To speak to our analyst for a discussion on the above findings, click Speak to Analyst
Table of Contents
1 Introduction (Page No. - 14)
1.1 Objectives of the Study
1.2 Market Definition
1.3 Market Scope
1.3.1 Market Covered
1.3.2 Years Considered for the Study
1.4 Currency
1.5 Limitations
1.6 Stakeholders
2 Research Methodology (Page No. - 18)
2.1 Research Data
2.1.1 Secondary Data
2.1.1.1 Key Secondary Sources
2.1.2 Primary Data
2.1.2.1 Key Data From Primary Sources
2.1.2.2 Key Industry Insights
2.1.2.3 Breakdown of Primary Interviews
2.2 Market Size Estimation
2.2.1 Bottom-Up Approach
2.2.2 Top Down Approach
2.3 Market Breakdown & Data Triangulation
2.4 Research Assumtions
3 Executive Summary (Page No. - 26)
4 Premium Insights (Page No. - 31)
4.1 Attractive Opportunities in the Booster Compressor Market, 2018�2023
4.2 Market, By Region, 2018-2023
4.3 Market, By Cooling Type, 2018 & 2023
4.4 Market, By Compression Stage, 2018 & 2023
4.5 Market, By Pressure, 2018 & 2023
4.6 Market, By End User, 2018 & 2023
5 Market Overview (Page No. - 35)
5.1 Introduction
5.2 Market Dynamics
5.2.1 Drivers
5.2.1.1 Lower Cost and Modular Design of Booster Compressor
5.2.1.2 Industrialization in Emerging Economies Expected to Drive Demand for Booster Compressor
5.2.2 Restraints
5.2.2.1 High Maintenance Cost
5.2.2.2 Availability of Alternative Equipment
5.2.3 Opportunities
5.2.3.1 Increasing Investment in Oil & Gas Industry
5.2.4 Challenges
5.2.4.1 Adherence to Stringent Quality Standards
6 Booster Compressor Market, By Cooling Type (Page No. - 38)
6.1 Introduction
6.2 Air-Cooled
6.3 Water-Cooled
7 Booster Compressor Market, By Compression Stage (Page No. - 42)
7.1 Introduction
7.2 Single-Stage
7.3 Double-Stage
7.4 Multistage
8 Booster Compressor Market, By Pressure (Page No. - 46)
8.1 Introduction
8.2 14�40 Bar
8.3 41�100 Bar
8.4 101�350 Bar
8.5 Above 351 Bar
9 Booster Compressor Market, By End-User (Page No. - 51)
9.1 Introduction
9.2 Oil & Gas
9.3 Process Industry
9.4 Chemical & Petrochemical
9.5 Power Generation
9.6 Others
10 Booster Compressor Market, By Region (Page No. - 57)
10.1 Introduction
10.2 North America
10.2.1 By Cooling Type
10.2.2 By Compression Stage
10.2.3 By Pressure
10.2.4 By End-User
10.2.5 By Country
10.2.6 US
10.2.7 Canada
10.2.8 Mexico
10.3 Asia Pacific
10.3.1 By Co0ling Type
10.3.2 By Compression Stage
10.3.3 By Pressure
10.3.4 By End-User
10.3.5 By Country
10.3.6 China
10.3.7 India
10.3.8 Australia
10.3.9 Rest of Asia Pacific
10.4 Europe
10.4.1 By Cooling Type
10.4.2 By Compression Stage
10.4.3 By Pressure
10.4.4 By End-User
10.4.5 By Country
10.4.6 Germany
10.4.7 Russia
10.4.8 UK
10.4.9 Italy
10.4.10 Rest of Europe
10.5 South America
10.5.1 By Cooling Type
10.5.2 By Compression Stage
10.5.3 By Pressure
10.5.4 By End-User
10.5.5 By Country
10.5.6 Brazil
10.5.7 Argentina
10.5.8 Venezuela
10.5.9 Rest of South America
10.6 Middle East & Africa
10.6.1 By Cooling Type
10.6.2 By Compression Stage
10.6.3 By Pressure
10.6.4 By End-User
10.6.5 By Country
10.6.6 Qatar
10.6.7 Iran
10.6.8 Nigeria
10.6.9 Algeria
10.6.10 Rest of Middle East & Africa
11 Competitive Landscape (Page No. - 89)
11.1 Overview
11.2 Market Ranking of Players & Industry Concentration, 2017
11.3 Competitive Scenario
11.3.1 Contracts & Agreements
11.3.2 New Product Launches
11.3.3 Mergers & Acquisitions
11.3.4 Investments & Expansions
12 Company Profiles (Page No. - 95)
(Business Overview, Products Offered, Recent Developments, MnM View)*
12.1 Atlas Copco
12.2 Kaeser Kompressoren
12.3 Boge Kompressoren
12.4 SAUER Compressor
12.5 BAUER Kompressoren
12.6 Hitachi
12.7 Ingersoll Rand
12.8 Gardner Denver
12.9 BHGE
12.10 Idex Corporation
12.11 Maximator
12.12 Haskel
*Details on Business Overview, Products Offered, Recent Developments, MnM View Might Not Be Captured in Case of Unlisted Companies.
13 Appendix (Page No. - 118)
13.1 Insights From Industry Experts
13.2 Discussion Guide
13.3 Knowledge Store: Marketsandmarkets� Subscription Portal
13.4 Introducing RT: Real-Time Market Intelligence
13.5 Available Customizations
13.6 Related Reports
13.7 Author Details
List of Tables (72 Tables)
Table 1 Booster Compressor Snapshot
Table 2 Capital Expenditure in Oil & Gas for 2016-2020
Table 3 Pipeline Projection for 2016-2020
Table 4 Global Market Size, By Cooling Type, 2016�2023 (USD Million)
Table 5 Air-Cooled: Market Size, By Region, 2016�2023 (USD Million)
Table 6 Water-Cooled: Market Size, By Region, 2016�2023 (USD Million)
Table 7 Global Market Size, By Compression Stage, 2016�2023 (USD Million)
Table 8 Single-Stage: Market Size, By Region, 2016�2023 (USD Million)
Table 9 Double-Stage: Market Size, By Region, 2016�2023 (USD Million)
Table 10 Multistage: Market Size, By Region, 2016�2023 (USD Million)
Table 11 Global Market Size, By Pressure, 2016�2023 (USD Million)
Table 12 14�40 Bar: Market Size, By Region, 2016�2023 (USD Million)
Table 13 41�100 Bar: Market Size, By Region, 2016�2023 (USD Million)
Table 14 101�350 Bar: Market Size, By Region, 2016�2023 (USD Million)
Table 15 Above 351 Bar: Market Size, By Region, 2016�2023 (USD Million)
Table 16 Global Market Size, By End-User, 2016�2023 (USD Million)
Table 17 Oil & Gas: Market Size, By Region, 2016�2023 (USD Million)
Table 18 Process Industry: Market Size, By Region, 2016�2023 (USD Million)
Table 19 Chemical & Petrochemical: Market Size, By Region, 2016�2023 (USD Million)
Table 20 Power Generation: Market Size, By Region, 2016�2023 (USD Million)
Table 21 Others: Market Size, By Region, 2016�2023 (USD Million)
Table 22 Booster Compressor Market, By Region, 2016�2023 (USD Million)
Table 23 North America: Market, By Cooling Type, 2016�2023 (USD Million)
Table 24 North America: Market, By Compression Stage, 2016�2023 (USD Million)
Table 25 North America: Market, By Pressure, 2016�2023 (USD Million)
Table 26 North America: Market, By End-User, 2016�2023 (USD Million)
Table 27 North America: Market Size, By Country, 2016�2023 (USD Million)
Table 28 US: Market Size, By End-User, 2016�2023 (USD Million)
Table 29 Canada: Market Size, By End-User, 2016�2023 (USD Thousand)
Table 30 Mexico: Market Size, By End-User, 2016�2023 (USD Thousand)
Table 31 Asia Pacific: Market, By Cooling Type, 2016�2023 (USD Million)
Table 32 Asia Pacific: Market, By Compression Stage, 2016�2023 (USD Million)
Table 33 Asia Pacific: Market, By Pressure, 2016�2023 (USD Million)
Table 34 Asia Pacific: Market, By End-User, 2016�2023 (USD Million)
Table 35 Asia Pacific: Market Size, By Country, 2016�2023 (USD Million)
Table 36 China: Market Size, By End-User, 2016�2023 (USD Million)
Table 37 India: Market Size, By End-User, 2016�2023 (USD Million)
Table 38 Australia: Market Size, By End-User, 2016�2023 (USD Thousand)
Table 39 Rest of Asia Pacific: Market Size, By End-User, 2016�2023 (USD Million)
Table 40 Europe: Market, By Cooling Type, 2016�2023 (USD Million)
Table 41 Europe: Market, By Compression Stage, 2016�2023 (USD Million)
Table 42 Europe: Market, By Pressure, 2016�2023 (USD Million)
Table 43 Europe: Market, By End-User, 2016�2023 (USD Million)
Table 44 Europe: Market Size, By Country, 2016�2023 (USD Million)
Table 45 Germany: Market, By End-User, 2016�2023 (USD Thousand)
Table 46 Russia: Market, By End-User, 2016�2023 (USD Million)
Table 47 UK: Market, By End-User, 2016�2023 (USD Million)
Table 48 Italy: Market, By End-User, 2016�2023 (USD Thousand)
Table 49 Rest of Europe: Market, By End-User, 2016�2023 (USD Million)
Table 50 South America: Market, By Cooling Type, 2016�2023 (USD Million)
Table 51 South America: Market, By Compression Stage, 2016�2023 (USD Million)
Table 52 South America: Market, By Pressure, 2016�2023 (USD Million)
Table 53 South America: Market, By End-User, 2016�2023 (USD Million)
Table 54 South America: Market Size, By Country, 2016�2023 (USD Million)
Table 55 Brazil: Market, By End-User, 2016�2023 (USD Thousand)
Table 56 Argentina: Market, By End-User, 2016�2023 (USD Thousand)
Table 57 Venezuela: Market, By End-User, 2016�2023 (USD Thousand)
Table 58 Rest of South America: Market, By End-User, 2016�2023 (USD Thousand)
Table 59 Middle East & Africa: Market, By Cooling Type, 2016�2023 (USD Million)
Table 60 Middle East & Africa: Market, By Compression Stage, 2016�2023 (USD Million)
Table 61 Middle East & Africa: Market, By Pressure, 2016�2023 (USD Million)
Table 62 Middle East & Africa: Market, By End-User, 2016�2023 (USD Million)
Table 63 Middle East & Africa: Market Size, By Country, 2016�2023 (USD Million)
Table 64 Qatar: Market, By End-User, 2016�2023 (USD Thousand)
Table 65 Iran: Market, By End-User, 2016�2023 (USD Thousand)
Table 66 Nigeria: Market, By End-User, 2016�2023 (USD Thousand)
Table 67 Algeria: Market, By End-User, 2016�2023 (USD Thousand)
Table 68 Rest of Middle East & Africa: Market, By End-User, 2016�2023 (USD Thousand)
Table 69 Contracts & Agreements, 2014�2018
Table 70 New Product Launches, 2014�2018
Table 71 Mergers & Acquisitions, 2014�2018
Table 72 Investments & Expansions, 2014�2018
List of Figures (35 Figures)
Figure 1 Markets Covered: Booster Compressor Market
Figure 2 Regional Scope
Figure 3 Research Design
Figure 4 Breakdown of Primary Interviews: By Company Type, Designation & Region
Figure 5 Bottom-Up Approach
Figure 6 Top-Down Approach
Figure 7 Data Triangulation Methodology
Figure 8 Assumptions of the Research Study
Figure 9 Asia Pacific Region Dominated the Market in 2017
Figure 10 Booster Compressors Market: Cooling Type
Figure 11 Market: Compression Stage
Figure 12 Market: Pressure
Figure 13 Market: End-User
Figure 14 Stable Growth in Oil Prices and Drilling Activities to Drive the Market During the Forecast Period
Figure 15 Middle East & Africa Market is Expected to Witness the Fastest Growth During the Forecast Period
Figure 16 Air-Cooled Booster Compressor are Projected to Grow at Fastest Rate During the Forecast Period
Figure 17 Double-Stage Segment is Expected to Dominate the Market During the Forecast Period
Figure 18 14�40 Bar Segment is Projected to Be the Largest Segment in the Booster Compressor Market
Figure 19 Oil & Gas Segment is Projected to Lead the Market During the Forecast Period
Figure 20 Market Dynamics for Market
Figure 21 Air-Cooled Market is Forecasted to Dominate the Market From 2018-2023
Figure 22 Double-Stage Segment is Estimated to Dominate the Market in 2018
Figure 23 14�40 Bar Segment is Estimated to Dominate the Market From 2018 to 2023
Figure 24 Oil & Gas Segment is Estimated to Dominate the Market During 2018�2023
Figure 25 Regional Snapshot: Booster Compressor Market, 2018�2023
Figure 26 North America: Booster Compressors Market Snapshot
Figure 27 Asia Pacific: Booster Compressors Market Snapshot
Figure 28 Key Developments in the Market, 2014�2018
Figure 29 Atlas Copco Lead the Market for Booster Compressors in 2017
Figure 30 Competitive Benchmarking
Figure 31 Atlas Copco: Company Snapshot
Figure 32 Hitachi Group: Company Snapshot
Figure 33 Ingersoll Rand: Company Snapshot
Figure 34 Gardner Denver: Company Snapshot
Figure 35 BHGE: Company Snapshot
Figure 36 Idex Corporation: Company Snapshot


Growth opportunities and latent adjacency in Booster Compressor Market