Building Information Modeling (BIM) Market

Building Information Modeling (BIM) Market Size, Share, Statistics and Industry Growth Analysis Report by Offering (Software, Services), Deployment (Cloud, On-Premise), Project Lifecycle (Preconstruction), Application (Buildings, Industrial), End User (AEC Professionals) and Region - Global Forecast to 2028

Report Code: SE 2815 Jun, 2023, by marketsandmarkets.com

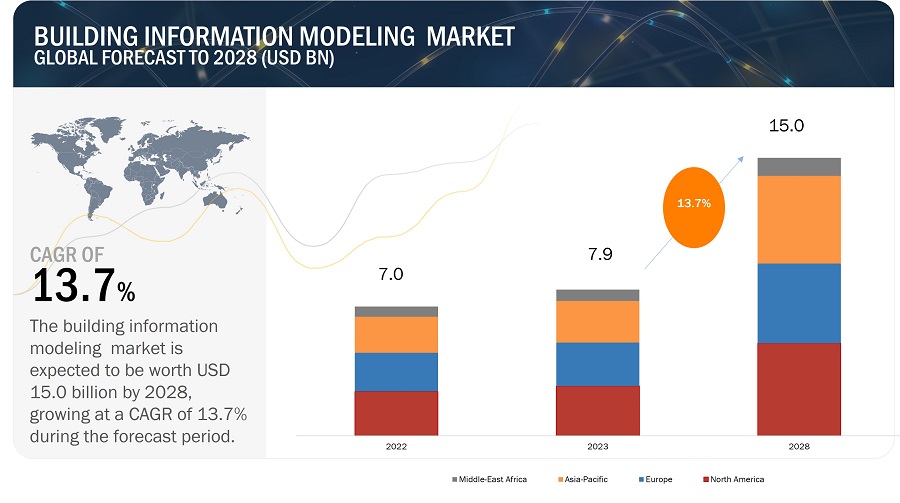
The global building information modeling market size was valued at USD 7.9 billion in 2023 and is projected to reach USD 15.0 billion by 2028; it is expected to register a CAGR of 13.7% during the forecast period. Growing government initiatives for the adoption of BIM are among the factors driving the growth of the building information modeling (BIM) market share.

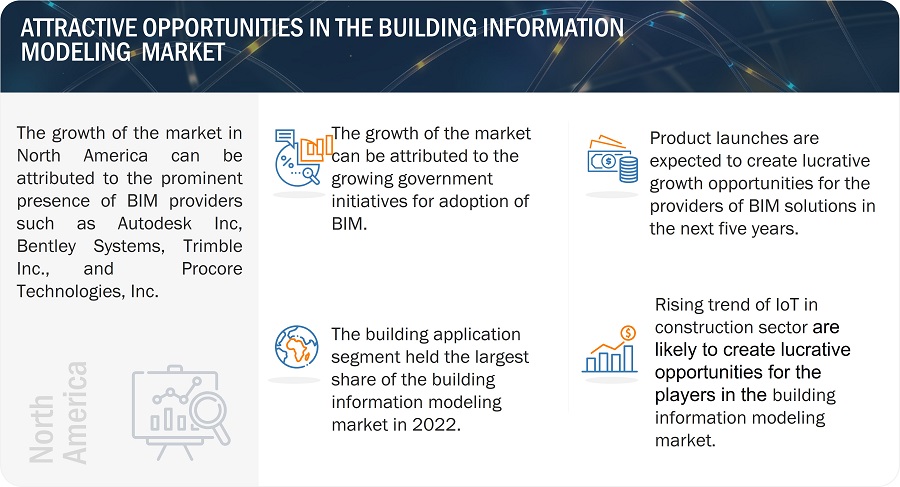
Attractive Opportunities in the building information modeling market
Building Information Modeling Market

Building Information Modeling Market

Building Information Modeling Market Forecast to 2028

To know about the assumptions considered for the study, Request for Free Sample Report

BIM Market Dynamics:

Driver: Growing use of BIM as it leads to sustainable development

Building Information Modeling (BIM) is considered a significant step toward achieving a more sustainable future for the construction industry. One of the main reasons for this is that BIM can help to reduce waste and optimize resource use throughout the entire lifecycle of a building or infrastructure project. By creating a digital model of the project, BIM enables designers and engineers to identify opportunities for energy efficiency, reduce greenhouse gas emissions, and minimize the environmental impact of construction activities. BIM can also facilitate the use of sustainable materials and construction practices, such as reducing waste, recycling materials, and reducing the carbon footprint of construction processes. Moreover, BIM can improve collaboration and communication between project teams, reducing errors and delays and leading to more efficient and sustainable construction projects. Therefore, BIM is considered an essential tool for achieving sustainable development goals in the construction industry, helping to create a more sustainable and resilient built environment.

BIM can also facilitate the use of sustainable materials and construction practices, such as reducing waste and optimizing resource use. In addition, BIM can improve collaboration and communication between project teams, helping to avoid errors and delays that can increase the environmental impact of construction projects. Overall, BIM can help to create more sustainable buildings and infrastructure, supporting the transition to a more sustainable and resilient built environment.

Restraint: High initial cost of BIM

Although BIM has huge benefits and cost savings, the initial cost observed is high. Also the cost of training and services is also high. Thus, the high initial cost associated with BIM would restrain the market growth.

Below mentioned are some factors that contribute to the high cost of BIM:

  • Software and hardware: BIM requires specialized software and hardware, which can be expensive to purchase and maintain. In addition, upgrading the software and hardware can add to the overall cost of implementing BIM.
  • Training and education: BIM requires specialized knowledge and skills, which may not be readily available within a company. Providing employee training and education can be costly, particularly if it involves hiring external experts or sending employees to training courses.
  • Process changes: BIM involves a significant change in the way that construction projects are planned, designed, and executed. Implementing BIM often requires significant process changes within a company, which can be time-consuming and expensive.
  • Data management: BIM generates a large amount of data that needs to be managed and stored. This can require additional resources and infrastructure, such as servers and storage devices, which can add to the overall cost of implementing BIM.

Also, various vendors promote BIM software by offering it for free or at a low price to students for learning purposes. Apart from cost, BIM software programs require a long duration of training. Despite these restraints, BIM software exhibits remarkable productivity, which, in turn, helps a firm increase its efficiency rate by up to 25–30%. BIM also helps mitigate design failures during construction, thereby saving time and resources.

Opportunity: Increasing use of BIM for safety measures

BIM can improve safety in construction projects in several ways. Here are some examples:

  • Virtual design and simulation: BIM allows project teams to create a virtual model of the construction project, which can be used to simulate different scenarios and identify potential safety hazards. This enables designers and engineers to address safety issues early in the design phase, reducing the risk of accidents and injuries during construction.
  • Clash detection: BIM can detect clashes between building systems, such as electrical and mechanical before construction begins. This can help avoid potential safety hazards arising from conflicts between these systems.
  • Site safety planning: BIM can be used to create 3D models of the construction site, which can be used to plan safety measures such as access routes, safety barriers, and evacuation plans. This can help ensure that site workers and visitors are kept safe during construction activities.
  • Maintenance and repair: BIM can provide detailed information about the building systems and components, such as the location of electrical systems, plumbing, and fire safety equipment. This information can help to facilitate maintenance and repair activities, reducing the risk of accidents and injuries.

Overall, BIM can be a powerful tool for improving safety in construction projects, helping to reduce the risk of accidents and injuries and ensuring that construction activities are carried out safely and efficiently. These factors serve as an opportunity in this market.

Challenge: Lack of understanding and awareness of BIM

The slow adoption of BIM is the high cost of implementation. BIM requires significant software, hardware, and training investment, which can be a barrier for small and medium-sized firms. Additionally, the transition from traditional methods of design and construction to BIM can be challenging and time-consuming, requiring changes in workflows and processes.

Furthermore, transitioning from traditional design and construction methods to BIM requires significant changes in workflows and processes, which can be challenging and time-consuming. Additionally, a lack of understanding and awareness of BIM's potential benefits and resistance to change has slowed its adoption. The fragmented nature of the construction industry, with various stakeholders involved in a project, each with its priorities and goals, can also hinder coordination and collaboration among these stakeholders, particularly if they are not using the same BIM software or tools.

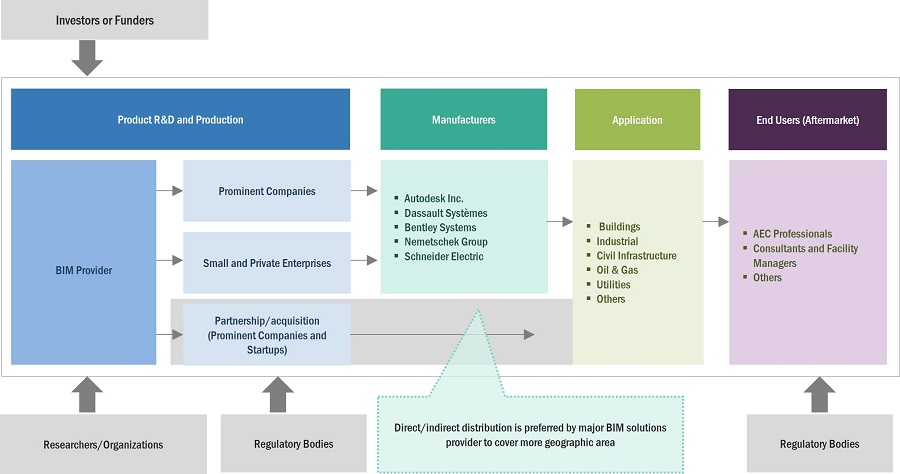
Building Information Modeling Market Ecosystem

Prominent companies in this market include well-established, financially stable manufacturers of BIM solutions. These companies have been operating in the market for several years and possess a diversified product portfolio, state-of-the-art technologies, and strong global sales and marketing networks. Prominent companies in this market include Autodesk Inc. (US); Nemetschek Group (Germany); Bentley Systems (US); Trimble Inc. (US); Dassault Systèmes (France); Schneider Electric (France); Asitev (UK); Procore Technologies, Inc. (US); Hexagon (Sweden); Archidata Inc. (Canada).

Building Information Modeling Market by Ecosystem

By offering type, the software segment is expected to grow with a higher CAGR during the forecast period.

Software is expected to witness a higher CAGR during the forecast period. Software solutions used for BIM exhibit features such as interoperability between applications, easy visualization, and cost-effectiveness. The BIM software suite generally encompasses solutions for various objectives, such as architecture; sustainability; structures; mechanical, electrical, and plumbing (MEP); construction; and facility management in a project life cycle. Different types of BIM software solutions available in the market are Autodesk Revit Structure, Graphisoft ArchiCAD, Nemetschek ALLPLAN Architecture, Bentley Facilities Manager, and Tekla Structures. 3D BIM is increasingly being used by several architecture, engineering, and construction (AEC) professionals. 3D visualization of a project, reduction in costs and time, and flexibility in making design changes are the best features of the BIM software.

By project lifecycle, the construction segment is expected to grow with a higher CAGR during the forecast period.

The construction is expected to exhibit a higher CAGR during the forecast period. The growth in this phase is attributed to BIM significantly saving time during construction, particularly in projects with intricate designs, by enabling the efficient resolution of difficult tasks and complex geometric issues. This is made possible by its ability to provide real-time information in three dimensions, which the model offers. Moreover, BIM facilitates swift bidirectional data exchange among various software applications used for scheduling, clash detection, trade coordination, and more

By deployment, the On-premise segment is expected to grow with a higher CAGR during the forecast period.

On-premise segment is expected to witness a higher CAGR during the forecast period. Larger firms in the AEC industry, such as Autodesk. and Nemetschek, provide on-premises software for their customers in the industrial, healthcare, and residential sectors. Organizations have complete control over the on-premises data flow, as it is physically stored in organizations wherein these solutions and systems are deployed. This is one of the key reasons for the adoption of on-premises BIM software. On-premises deployment is feasible for small- and medium-sized enterprises as data management becomes easy for them.

By application, the civil infrastructure segment is expected to grow with a higher CAGR during the forecast period.

The civil infrastructure is expected to exhibit a higher CAGR during the forecast period. Implementing BIM in civil projects leads to improved outcomes as it enables the examination of multiple scenarios, offering data-driven confidence in delivering projects within the designated schedule and budget.

By end user, consultants & facility managers segment is expected to grow with a higher CAGR during the forecast period.

The consultants & facility managers are expected to exhibit a higher CAGR during the forecast period. The BIM consultant team is responsible for helping project owners solve people, process, and technological issues and deliver custom solutions and technology integration. BIM is mainly used by consultants and facility managers for building and infrastructure applications. BIM is important for lifecycle facility management, and thus, it is rapidly evolving as a major tool. BIM provides instant access to the location of building components that require monitoring or replacement. Facility management professionals are concerned with operating and maintaining buildings for their life cycle, which can span 30 years or even more and may include reconstruction and maintenance parts. BIM is an important tool for consultants and facility managers to track project progress. By maximizing the use of BIM data in facility management and building maintenance, operators and facility managers can reduce overall operational costs. BIM helps facility management for asset inventories and registries, space management applications, building system analysis, environmental analysis, and regulatory compliance management.

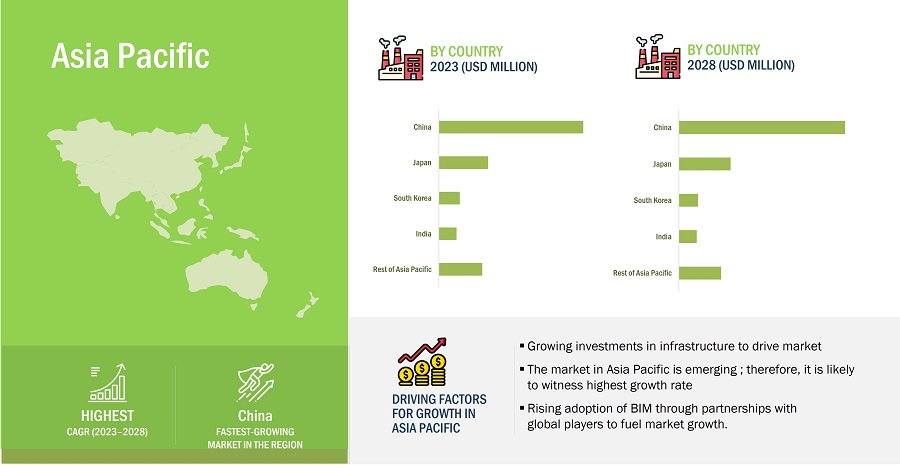
In 2028, Asia Pacific is projected to hold the largest share of the overall BIM market.

Building Information Modeling Market by Region

Building Information Modeling (BIM) Market Statistics by Region

To know about the assumptions considered for the study, download the pdf brochure

Asia Pacific is also expected to witness the highest CAGR during the forecast period. The growth in this region can be attributed to the use of BIM for large-scale infrastructure and building projects. Additionally, government initiatives are expected to significantly drive the BIM market in Asia Pacific. Governments in the region have started imposing new regulations regarding building construction permits. For example, Japan, China, and South Korea have made BIM documents mandatory, especially for public buildings, along with green certification-related documents.

Key Market Players

Autodesk Inc. (US); Nemetschek Group (Germany); Bentley Systems (US); Trimble Inc. (US); Dassault Systèmes (France); Schneider Electric (France); Asitev (UK); Procore Technologies, Inc. (US); Hexagon (Sweden); Archidata Inc. (Canada) are some of the key players in the building information modeling companies.

Get online access to the report on the World's First Market Intelligence Cloud

  • Easy to Download Historical Data & Forecast Numbers
  • Company Analysis Dashboard for high growth potential opportunities
  • Research Analyst Access for customization & queries
  • Competitor Analysis with Interactive dashboard
  • Latest News, Updates & Trend analysis
Request Sample

Scope of the Report

Report Metric

Details

BIM Market size value in 2023

 USD 7.9 Billion

BIM Market size value in 2028

 USD 15.0 Billion

CAGR (2023-2028)

 13.7%

Market Size Availability for Years

2019–2028

Base Year

2022

Forecast Period

2023–2028

Forecast Units

Value (USD Million/USD Billion)

Segments Covered

By offering type, deployment type, project lifecycle, application, end-user, and region

Geographies Covered

North America, Europe, Asia Pacific, and RoW

Companies Covered

Autodesk Inc. (US); Nemetschek Group (Germany); Bentley Systems (US); Trimble Inc. (US); Dassault Systèmes (France); Schneider Electric (France); Asitev (UK); Procore Technologies, Inc. (US); Hexagon (Sweden); Archidata Inc. (Canada) are some of the key players in the building information modeling market.

Building Information Modeling Market Highlights

This research report categorizes the building information modeling industry based on offering type, deployment type, project lifecycle, application, end-user, and region./

  • Software Support and Maintenance
  • Project Management and Support


Segment

Subsegment

By Offering Type

  • Introduction
  • Software
    • Architectural Design
    • Sustainability
    • Structures
    • MEP
    • Construction
  • Services


    • Software Support and Maintenance
    • Project Management and Support

By Deployment Type

  • Introduction
  • On-Premises Deployment
  • Cloud Deployment

By Project Lifecycle

  • Introduction
  • Preconstruction
  • Construction
  • Operation

By Application

  • Introduction
  • Buildings
  • Industrial
  • Civil Infrastructure
  • Oil & Gas
  • Utilities
  • Others

By End User

  • Introduction
  • AEC Professionals
  • Consultants & Facility Managers
  • Others

By Geography

  • Introduction
  • North America
    • Recession Impact
    • US
    • Canada
    • Mexico
  • Europe
    • Recession Impact
    • UK
    • Germany
    • France
    • Italy
    • Spain
    • Rest of Europe
  • Asia Pacific
    • Recession Impact
    • China
    • Japan
    • South Korea
    • India
    • Rest of Asia Pacific
  • ROW
    • Recession Impact
    • Middle East & Africa
    • South America

Recent Developments

  • In April 2023, Bentley Systems partnered with Engineers Without Borders International (EWB-I) (US), an association of national EWB/ISF groups. With this partnership, EWB-I mission of bringing together the global Engineers Without Borders movement so that millions more people can benefit from work addressing today’s most pressing challenges and accelerating progress for a sustainable and equitable future for all.
  • In April 2023, Asite acquired 3D Repo (UK), a pioneer in cloud-based Building Information Modelling (BIM) collaboration software. This acquisition strengthens Asite’s position as a leader in the digital engineering market, providing customers with advanced tools to manage the entire construction lifecycle.
  • In March 2023, Autodesk Inc. acquired UNIFI Labs, Inc. (US), an essential cloud software solution for organizing, accessing, and managing content in Revit, Civil 3D, Plant 3D, and other digital design tools. The digital asset management capabilities of UNIFI would enable Autodesk’s customer base a faster and more accessible BIM content.
  • In November 2022, Asite opened a new data center in Canada. The data center will support infrastructure developments and capital projects in the region, ensuring that information for projects within Canada will remain in Canada.
  • In November 2022, Solibri Inside works as a native feature that can be used within the authoring tool and can run checks within a SaaS-based environment whenever the designer wishes. With the tool, the designer does not need to export the model and open other software to perform model checking. The innovative solution comes inbuilt within Nemetschek authoring tools Allplan, Graphisoft Archicad, and Vectorworks and can be easily accessed directly in the user interface of the authoring tool.

Frequently Asked Questions (FAQ):

To speak to our analyst for a discussion on the above findings, click Speak to Analyst

TABLE OF CONTENTS
 
1 INTRODUCTION (Page No. - 32)
    1.1 STUDY OBJECTIVES 
    1.2 MARKET DEFINITION 
           1.2.1 INCLUSIONS AND EXCLUSIONS
    1.3 STUDY SCOPE 
           1.3.1 MARKETS COVERED
                    FIGURE 1 MARKET SEGMENTATION
           1.3.2 GEOGRAPHIC SCOPE
           1.3.3 YEARS CONSIDERED
    1.4 CURRENCY CONSIDERED 
    1.5 STAKEHOLDERS 
    1.6 SUMMARY OF CHANGES 
 
2 RESEARCH METHODOLOGY (Page No. - 37)
    2.1 RESEARCH DATA 
           FIGURE 2 BUILDING INFORMATION MODELING MARKET: RESEARCH DESIGN
           2.1.1 SECONDARY AND PRIMARY RESEARCH
           2.1.2 SECONDARY DATA
                    2.1.2.1 Key secondary sources
                    2.1.2.2 Key data from secondary sources
           2.1.3 PRIMARY DATA
                    2.1.3.1 Major primary interview participants
                    2.1.3.2 Breakdown of primaries
                               FIGURE 3 BREAKDOWN OF PRIMARIES
                    2.1.3.3 Key data from primary sources
                    2.1.3.4 Key industry insights
    2.2 FACTOR ANALYSIS 
           2.2.1 SUPPLY-SIDE ANALYSIS
                    FIGURE 4 MARKET SIZE ESTIMATION METHODOLOGY: APPROACH 1 (SUPPLY-SIDE ANALYSIS) – REVENUE GENERATED BY COMPANIES FROM SALES OF BIM PRODUCTS
                    FIGURE 5 MARKET SIZE ESTIMATION METHODOLOGY: APPROACH 1 (TOP-DOWN, SUPPLY-SIDE) – ILLUSTRATION OF REVENUE ESTIMATION FOR ONE COMPANY IN MARKET
    2.3 MARKET SIZE ESTIMATION 
           FIGURE 6 MARKET SIZE ESTIMATION METHODOLOGY: SUPPLY-SIDE ANALYSIS
           2.3.1 BOTTOM-UP APPROACH
                    2.3.1.1 Approach to obtain market size using bottom-up analysis (demand side)
                               FIGURE 7 MARKET SIZE ESTIMATION METHODOLOGY: BOTTOM-UP APPROACH
           2.3.2 TOP-DOWN APPROACH
                    2.3.2.1 Approach to obtain market size using top-down analysis (supply side)
                               FIGURE 8 MARKET SIZE ESTIMATION METHODOLOGY: TOP-DOWN APPROACH
           2.3.3 GROWTH PROJECTION- AND FORECAST-RELATED ASSUMPTIONS
                    TABLE 1 MARKET GROWTH ASSUMPTIONS
    2.4 MARKET BREAKDOWN AND DATA TRIANGULATION 
           FIGURE 9 BUILDING INFORMATION MODELING MARKET: DATA TRIANGULATION
    2.5 RESEARCH ASSUMPTIONS 
           TABLE 2 KEY ASSUMPTIONS: MACRO- AND MICRO-ECONOMIC ENVIRONMENT
           2.5.1 RECESSION IMPACT ANALYSIS
                    TABLE 3 PARAMETERS CONSIDERED TO ANALYZE IMPACT OF RECESSION ON MARKET
    2.6 RESEARCH ASSUMPTIONS 
    2.7 RISK ASSESSMENT 
           TABLE 4 RISK ASSESSMENT: BUILDING INFORMATION MODELING MARKET
 
3 EXECUTIVE SUMMARY (Page No. - 51)
           FIGURE 10 BUILDINGS SEGMENT TO WITNESS HIGHEST CAGR IN MARKET, BY APPLICATION, DURING FORECAST PERIOD
           FIGURE 11 SUSTAINABILITY SOFTWARE TO WITNESS HIGHEST CAGR DURING FORECAST PERIOD
           FIGURE 12 AEC PROFESSIONALS TO COMMAND MARKET THROUGHOUT FORECAST PERIOD
           FIGURE 13 NORTH AMERICA TO LEAD MARKET IN 2028
    3.1 IMPACT OF RECESSION ON MARKET 
           FIGURE 14 PRE- AND POST-RECESSION IMPACT ON BUILDING INFORMATION MODELING MARKET, 2019–2028
 
4 PREMIUM INSIGHTS (Page No. - 55)
    4.1 ATTRACTIVE GROWTH OPPORTUNITIES FOR PLAYERS IN MARKET 
           FIGURE 15 RAPID URBANIZATION WORLDWIDE TO BOOST MARKET GROWTH
    4.2 MARKET, BY OFFERING TYPE 
           FIGURE 16 SOFTWARE OFFERINGS TO ACCOUNT FOR LARGEST MARKET SHARE IN 2028
    4.3 MARKET FOR SOFTWARE, BY REGION 
           FIGURE 17 ASIA PACIFIC TO EXHIBIT HIGHEST CAGR IN MARKET FOR SOFTWARE DURING FORECAST PERIOD
    4.4 BUILDING INFORMATION MODELING MARKET, BY REGION 
           FIGURE 18 NORTH AMERICA TO CAPTURE MAJORITY OF MARKET SHARE IN 2023
    4.5 MARKET, BY COUNTRY 
           FIGURE 19 CHINA TO EXHIBIT HIGHEST CAGR IN GLOBAL MARKET DURING FORECAST PERIOD
 
5 MARKET OVERVIEW (Page No. - 58)
    5.1 INTRODUCTION 
    5.2 MARKET DYNAMICS 
           FIGURE 20 MARKET: DRIVERS, RESTRAINTS, OPPORTUNITIES, AND CHALLENGES
           5.2.1 DRIVERS
                    5.2.1.1 Advancing sustainability in construction sector through BIM
                    5.2.1.2 Rapid urbanization globally
                    5.2.1.3 Government initiatives promoting use of BIM
                               FIGURE 21 INVESTMENTS BY CONSTRUCTION COMPANIES IN BIM SOFTWARE, BY COUNTRY
                               FIGURE 22 DRIVERS AND THEIR IMPACT ON MARKET
           5.2.2 RESTRAINTS
                    5.2.2.1 High initial cost of BIM
                               FIGURE 23 RESTRAINTS AND THEIR IMPACT ON BUILDING INFORMATION MODELING MARKET
           5.2.3 OPPORTUNITIES
                    5.2.3.1 Focus of stakeholders in construction industry on improving safety
                    5.2.3.2 Rising trend of IoT in construction sector
                    5.2.3.3 Increasing trend of BIM
                    5.2.3.4 Introduction of new standards of BIM
                               FIGURE 24 OPPORTUNITIES AND THEIR IMPACT ON MARKET
           5.2.4 CHALLENGES
                    5.2.4.1 Slow adoption of BIM
                    5.2.4.2 Low level of digitalization in construction industry
                               FIGURE 25 CHALLENGES AND THEIR IMPACT ON MARKET
    5.3 VALUE CHAIN ANALYSIS 
           FIGURE 26 VALUE CHAIN OF BUILDING INFORMATION MODELING MARKET
           TABLE 5 MARKET PLAYER: ROLE IN ECOSYSTEM
           5.3.1 REVENUE SHIFT AND NEW REVENUE POCKETS FOR PLAYERS IN MARKET
                    FIGURE 27 REVENUE SHIFT IN MARKET
    5.4 ECOSYSTEM MAPPING 
           FIGURE 28 BUILDING INFORMATION MODELING ECOSYSTEM
    5.5 PRICING ANALYSIS 
           5.5.1 AVERAGE SELLING PRICE OF BUILDING INFORMATION MODELING
                    FIGURE 29 AVERAGE SELLING PRICE OF BIM SOFTWARE OFFERED BY KEY PLAYERS
                    TABLE 6 AVERAGE SELLING PRICE OF BIM SOFTWARE PROVIDED BY KEY PLAYERS (USD)
           5.5.2 AVERAGE SELLING PRICE TREND
                    TABLE 7 AVERAGE SELLING PRICE OF BUILDING INFORMATION MODELING SOFTWARE AND SERVICES, 2018–2022 (USD)
                    FIGURE 30 AVERAGE SELLING PRICE: BUILDING INFORMATION MODELING, BY OFFERING, 2018–2022 (USD)
    5.6 KEY STAKEHOLDERS AND BUYING CRITERIA 
           5.6.1 KEY STAKEHOLDERS IN BUYING PROCESS
                    FIGURE 31 INFLUENCE OF STAKEHOLDERS ON BUYING PROCESS FOR TOP 3 APPLICATIONS
                    TABLE 8 INFLUENCE OF STAKEHOLDERS ON BUYING PROCESS FOR TOP 3 APPLICATIONS (%)
           5.6.2 BUYING CRITERIA
                    FIGURE 32 KEY BUYING CRITERIA FOR TOP 3 APPLICATIONS
                    TABLE 9 KEY BUYING CRITERIA FOR TOP 3 APPLICATIONS
    5.7 PORTER’S FIVE FORCES ANALYSIS 
           TABLE 10 BUILDING INFORMATION MODELING MARKET: PORTER’S FIVE FORCES ANALYSIS
           FIGURE 33 PORTER’S FIVE FORCES ANALYSIS
           5.7.1 THREAT OF NEW ENTRANTS
           5.7.2 THREAT OF SUBSTITUTES
           5.7.3 BARGAINING POWER OF SUPPLIERS
           5.7.4 BARGAINING POWER OF BUYERS
           5.7.5 INTENSITY OF COMPETITIVE RIVALRY
    5.8 CASE STUDIES 
           5.8.1 XL CONSTRUCTION UTILIZES PROCORE’S BIM TO SHARE DESIGN ACROSS PROJECT TEAMS TO DETECT FLAWS AND MINIMIZE REWORK
           5.8.2 BECK GROUP SAVES TIME AND ACHIEVES FINANCIAL GAINS WITH DEPLOYMENT OF PROCORE’ BIM 360 SUITE S
           5.8.3 PINNACLE EXECUTES 3D BIM AT MUSCAT INTERNATIONAL AIRPORT FOR DESIGN AND CONSTRUCTION OF CARGO AND MRO FACILITIES
    5.9 TECHNOLOGY ANALYSIS 
           5.9.1 IOT IN BIM
           5.9.2 AR/VR IN BIM
    5.10 TRADE ANALYSIS 
           5.10.1 IMPORT SCENARIO
                    TABLE 11 IMPORT DATA BY COUNTRY, 2018–2022 (USD MILLION)
           5.10.2 EXPORT SCENARIO
                    TABLE 12 EXPORT DATA BY COUNTRY, 2018–2022 (USD MILLION)
    5.11 PATENT ANALYSIS, 2012–2022 
           FIGURE 34 NUMBER OF PATENTS GRANTED FOR BUILDING INFORMATION MODELING, 2012–2022
           FIGURE 35 GEOGRAPHIC ANALYSIS OF PATENTS GRANTED FOR BUILDING INFORMATION MODELING SOLUTIONS, 2022
           TABLE 13 KEY PATENTS IN MARKET, 2021–2023
    5.12 KEY CONFERENCES AND EVENTS, 2023–2024 
           TABLE 14 MARKET: LIST OF CONFERENCES AND EVENTS
    5.13 STANDARDS AND REGULATORY LANDSCAPE 
           5.13.1 REGULATORY BODIES, GOVERNMENT AGENCIES, AND OTHER ORGANIZATIONS
                    TABLE 15 NORTH AMERICA: LIST OF REGULATORY BODIES, GOVERNMENT AGENCIES, AND OTHER ORGANIZATIONS
                    TABLE 16 EUROPE: LIST OF REGULATORY BODIES, GOVERNMENT AGENCIES, AND OTHER ORGANIZATIONS
                    TABLE 17 ASIA PACIFIC: LIST OF REGULATORY BODIES, GOVERNMENT AGENCIES, AND OTHER ORGANIZATIONS
           5.13.2 STANDARDS
                    5.13.2.1 BS EN ISO 19650
                               5.13.2.1.1 BS EN ISO 19650–1
                               5.13.2.1.2 BS EN ISO 19650–2
                               5.13.2.1.3 BS EN ISO 19650–3
                               5.13.2.1.4 BS EN ISO 19650–5
    5.14 TARIFF ANALYSIS 
           TABLE 18 TARIFFS FOR BIM PRODUCTS COVERED UNDER HS CODE 8302 EXPORTED BY CHINA (2021)
           TABLE 19 TARIFFS FOR BIM PRODUCTS COVERED UNDER HS CODE 8302 EXPORTED BY GERMANY (2021)
 
 
6 BUILDING INFORMATION MODELING MARKET, BY OFFERING TYPE (Page No. - 88)
    6.1 INTRODUCTION 
           FIGURE 36 SOFTWARE SEGMENT TO LEAD BUILDING INFORMATION MODELING MARKET THROUGHOUT FORECAST PERIOD
           TABLE 20 MARKET, BY OFFERING TYPE, 2019–2022 (USD MILLION)
           TABLE 21 MARKET, BY OFFERING TYPE, 2023–2028 (USD MILLION)
    6.2 SOFTWARE 
           6.2.1 ARCHITECTURAL DESIGN
                    6.2.1.1 Use of BIM tools in architectural projects to improve quality and efficiency
           6.2.2 SUSTAINABILITY
                    6.2.2.1 Implementation of sustainability software to reduce project costs and ensure sustainable operations and maintenance
           6.2.3 STRUCTURAL DESIGN & ANALYSIS
                    6.2.3.1 Adoption of structural design & analysis software to create compelling designs meeting safety standards
           6.2.4 MEP
                    6.2.4.1 Utilization of MEP software to minimize construction errors through 3D models
           6.2.5 CONSTRUCTION
           6.2.6 FACILITY MANAGEMENT
                    6.2.6.1 Employment of facility management BIM software by facility managers to make informed decisions regardings workflow management
                               TABLE 22 BIM MARKET, BY SOFTWARE TYPE, 2019–2022 (USD MILLION)
                               TABLE 23 BUILDING INFORMATION MODELING MARKET, BY SOFTWARE TYPE, 2023–2028 (USD MILLION)
                               TABLE 24 SOFTWARE: BIM MARKET, BY APPLICATION, 2019–2022 (USD MILLION)
                               TABLE 25 SOFTWARE: BIM MARKET, BY APPLICATION, 2023–2028 (USD MILLION)
                               FIGURE 37 BUILDINGS SEGMENT TO DOMINATE ARCHITECTURAL DESIGN BIM SOFTWARE MARKET THROUGHOUT FORECAST PERIOD
                               TABLE 26 ARCHITECTURAL DESIGN: MARKET, BY APPLICATION, 2019–2022 (USD MILLION)
                               TABLE 27 ARCHITECTURAL DESIGN: MARKET, BY APPLICATION, 2023–2028 (USD MILLION)
                               TABLE 28 SUSTAINABILITY: BIM MARKET, BY APPLICATION, 2019–2022 (USD MILLION)
                               TABLE 29 SUSTAINABILITY: BIM MARKET, BY APPLICATION, 2023–2028 (USD MILLION)
                               TABLE 30 STRUCTURAL DESIGN & ANALYSIS: MARKET, BY APPLICATION, 2019–2022 (USD MILLION)
                               TABLE 31 STRUCTURAL DESIGN & ANALYSIS: MARKET, BY APPLICATION, 2023–2028 (USD MILLION)
                               TABLE 32 MEP: BIM MARKET, BY APPLICATION, 2019–2022 (USD MILLION)
                               TABLE 33 MEP: MARKET, BY APPLICATION, 2023–2028 (USD MILLION)
                               TABLE 34 CONSTRUCTION: BUILDING INFORMATION MODELING MARKET, BY APPLICATION, 2019–2022 (USD MILLION)
                               TABLE 35 CONSTRUCTION: MARKET, BY APPLICATION, 2023–2028 (USD MILLION)
                               TABLE 36 FACILITY MANAGEMENT: MARKET, BY APPLICATION, 2019–2022 (USD MILLION)
                               TABLE 37 FACILITY MANAGEMENT: MARKET, BY APPLICATION, 2023–2028 (USD MILLION)
                               TABLE 38 SOFTWARE: MARKET, BY PROJECT LIFECYCLE, 2019–2022 (USD MILLION)
                               TABLE 39 SOFTWARE: MARKET, BY PROJECT LIFECYCLE, 2023–2028 (USD MILLION)
                               FIGURE 38 PRE-CONSTRUCTION SEGMENT TO WITNESS LARGEST SHARE OF ARCHITECTURAL DESIGN SOFTWARE MARKET FOR PROJECT LIFECYCLE IN 2028
                               TABLE 40 ARCHITECTURAL DESIGN: MARKET, BY PROJECT LIFECYCLE, 2019–2022 (USD MILLION)
                               TABLE 41 ARCHITECTURAL DESIGN: MARKET, BY PROJECT LIFECYCLE, 2023–2028 (USD MILLION)
                               TABLE 42 SUSTAINABILITY: MARKET, BY PROJECT LIFECYCLE, 2019–2022 (USD MILLION)
                               TABLE 43 SUSTAINABILITY: BUILDING INFORMATION MODELING MARKET, BY PROJECT LIFECYCLE, 2023–2028 (USD MILLION)
                               TABLE 44 STRUCTURAL DESIGN & ANALYSIS: MARKET, BY PROJECT LIFECYCLE, 2019–2022 (USD MILLION)
                               TABLE 45 STRUCTURAL DESIGN & ANALYSIS: MARKET, BY PROJECT LIFECYCLE, 2023–2028 (USD MILLION)
                               TABLE 46 MEP: MARKET, BY PROJECT LIFECYCLE, 2019–2022 (USD MILLION)
                               TABLE 47 MEP: MARKET, BY PROJECT LIFECYCLE, 2023–2028 (USD MILLION)
                               TABLE 48 CONSTRUCTION: MARKET, BY PROJECT LIFECYCLE, 2019–2022 (USD MILLION)
                               TABLE 49 CONSTRUCTION: MARKET, BY PROJECT LIFECYCLE, 2023–2028 (USD MILLION)
                               TABLE 50 FACILITY MANAGEMENT: BUILDING INFORMATION MODELING MARKET, BY PROJECT LIFECYCLE, 2019–2022 (USD MILLION)
                               TABLE 51 FACILITY MANAGEMENT: MARKET, BY PROJECT LIFECYCLE, 2023–2028 (USD MILLION)
                               TABLE 52 SOFTWARE: BIM MARKET, BY REGION, 2019–2022 (USD MILLION)
                               TABLE 53 SOFTWARE: BIM MARKET, BY REGION, 2023–2028 (USD MILLION)
                               FIGURE 39 NORTH AMERICA TO LEAD ARCHITECTURAL DESIGN BIM SOFTWARE MARKET FROM 2023 TO 2028
                               TABLE 54 ARCHITECTURAL DESIGN: MARKET, BY REGION, 2019–2022 (USD MILLION)
                               TABLE 55 ARCHITECTURAL DESIGN: MARKET, BY REGION, 2023–2028 (USD MILLION)
                               TABLE 56 SUSTAINABILITY: BUILDING INFORMATION MODELING MARKET, BY REGION, 2019–2022 (USD MILLION)
                               TABLE 57 SUSTAINABILITY: MARKET, BY REGION, 2023–2028 (USD MILLION)
                               TABLE 58 STRUCTURAL DESIGN & ANALYSIS: BUILDING INFORMATION MODELING, BY REGION, 2019–2022 (USD MILLION)
                               TABLE 59 STRUCTURAL DESIGN & ANALYSIS: BUILDING INFORMATION MODELING, BY REGION, 2023–2028 (USD MILLION)
                               TABLE 60 MEP: MARKET, BY REGION, 2019–2022 (USD MILLION)
                               TABLE 61 MEP: MARKET, BY REGION, 2023–2028 (USD MILLION)
                               TABLE 62 CONSTRUCTION: MARKET, BY REGION, 2019–2022 (USD MILLION)
                               TABLE 63 CONSTRUCTION: BUILDING INFORMATION MODELING MARKET, BY REGION, 2023–2028 (USD MILLION)
                               TABLE 64 FACILITY MANAGEMENT: MARKET, BY REGION, 2019–2022 (USD MILLION)
                               TABLE 65 FACILITY MANAGEMENT: MARKET, BY REGION, 2023–2028 (USD MILLION)
    6.3 SERVICES 
           6.3.1 SOFTWARE SUPPORT & MAINTENANCE
                    6.3.1.1 High demand for software support & maintenance services by contractors and building owners
           6.3.2 PROJECT MANAGEMENT & SUPPORT
                    6.3.2.1 Provision of project management and support services to effectively manage projects till end
                               FIGURE 40 SOFTWARE SUPPORT & MAINTENANCE SERVICES TO ACCOUNT FOR LARGER MARKET SHARE IN 2028
                               TABLE 66 MARKET, BY SERVICE TYPE, 2019–2022 (USD MILLION)
                               TABLE 67 MARKET, BY SERVICE TYPE, 2023–2028 (USD MILLION)
                               TABLE 68 SERVICES: MARKET, BY APPLICATION, 2019–2022 (USD MILLION)
                               TABLE 69 SERVICES: BUILDING INFORMATION MODELING MARKET, BY APPLICATION, 2023–2028 (USD MILLION)
                               TABLE 70 PROJECT MANAGEMENT SUPPORT: BIM MARKET, BY APPLICATION, 2019–2022 (USD MILLION)
                               TABLE 71 PROJECT MANAGEMENT SUPPORT: BIM MARKET, BY APPLICATION, 2023–2028 (USD MILLION)
                               TABLE 72 SOFTWARE SUPPORT & MAINTENANCE: BIM MARKET, BY APPLICATION, 2019–2022 (USD MILLION)
                               TABLE 73 SOFTWARE SUPPORT & MAINTENANCE: BIM MARKET, BY APPLICATION, 2023–2028 (USD MILLION)
                               TABLE 74 SERVICES: MARKET, BY PROJECT LIFECYCLE, 2019–2022 (USD MILLION)
                               TABLE 75 SERVICES: BUILDING INFORMATION MODELING MARKET, BY PROJECT LIFECYCLE, 2023–2028 (USD MILLION)
                               TABLE 76 PROJECT MANAGEMENT SUPPORT: BIM MARKET, BY PROJECT LIFECYCLE, 2019–2022 (USD MILLION)
                               TABLE 77 PROJECT MANAGEMENT SUPPORT: BIM MARKET, BY PROJECT LIFECYCLE, 2023–2028 (USD MILLION)
                               TABLE 78 SOFTWARE SUPPORT & MAINTENANCE: BIM MARKET, BY PROJECT LIFECYCLE, 2019–2022 (USD MILLION)
                               TABLE 79 SOFTWARE SUPPORT & MAINTENANCE: MARKET, BY PROJECT LIFECYCLE, 2023–2028 (USD MILLION)
                               TABLE 80 SERVICES: MARKET, BY REGION, 2019–2022 (USD MILLION)
                               TABLE 81 SERVICES: BUILDING INFORMATION MODELING MARKET, BY REGION, 2023–2028 (USD MILLION)
                               TABLE 82 PROJECT MANAGEMENT SUPPORT: BIM MARKET, BY REGION, 2019–2022 (USD MILLION)
                               TABLE 83 PROJECT MANAGEMENT SUPPORT: BIM MARKET, BY REGION, 2023–2028 (USD MILLION)
                               TABLE 84 SOFTWARE SUPPORT & MAINTENANCE: BIM MARKET, BY REGION, 2019–2022 (USD MILLION)
                               TABLE 85 SOFTWARE SUPPORT & MAINTENANCE: BIM MARKET, BY REGION, 2023–2028 (USD MILLION)
 
7 MARKET, BY DEPLOYMENT TYPE (Page No. - 116)
    7.1 INTRODUCTION 
           FIGURE 41 ON-PREMISES SEGMENT TO LEAD BUILDING INFORMATION MODELING MARKET THROUGHOUT FORECAST PERIOD
           TABLE 86 MARKET, BY DEPLOYMENT TYPE, 2019–2022 (USD MILLION)
           TABLE 87 MARKET, BY DEPLOYMENT TYPE, 2023–2028 (USD MILLION)
    7.2 ON-PREMISES 
           7.2.1 BETTER CONTROL OVER DATA SECURITY AND PRIVACY BENEFITS OF ON-PREMISES DEPLOYMENT TO DRIVE MARKET
    7.3 CLOUD 
           7.3.1 HIGH SCALABILITY, COST-EFFECTIVENESS, AND ACCESSIBILITY OF CLOUD DEPLOYMENT TO BOOST SEGMENTAL GROWTH
 
8 MARKET, BY PROJECT LIFECYCLE (Page No. - 120)
    8.1 INTRODUCTION 
           FIGURE 42 PRE-CONSTRUCTION SEGMENT TO LEAD MARKET THROUGHOUT FORECAST PERIOD
           TABLE 88 BUILDING INFORMATION MODELING MARKET, BY PROJECT LIFECYCLE, 2019–2022 (USD MILLION)
           TABLE 89 MARKET, BY PROJECT LIFECYCLE, 2023–2028 (USD MILLION)
    8.2 PRE-CONSTRUCTION 
           8.2.1 ADOPTION OF BIM DURING PRE-CONSTRUCTION PHASE FOR VISUALIZATION, COST PLANNING, AND ARCHITECTURAL DESIGNING, DETAILING TASKS
                    TABLE 90 PRE-CONSTRUCTION: MARKET, BY OFFERING TYPE, 2019–2022 (USD MILLION)
                    TABLE 91 PRE-CONSTRUCTION: MARKET, BY OFFERING TYPE, 2023–2028 (USD MILLION)
    8.3 CONSTRUCTION 
           8.3.1 USE OF BIM DURING CONSTRUCTION TO COMPLETE PROJECTS EFFICIENTLY AT LOWER COST
                    TABLE 92 CONSTRUCTION: MARKET, BY OFFERING TYPE, 2019–2022 (USD MILLION)
                    TABLE 93 CONSTRUCTION: MARKET, BY OFFERING TYPE, 2023–2028 (USD MILLION)
    8.4 OPERATION 
           8.4.1 DEPLOYMENT OF BIM DURING OPERATION PHASE TO IMPROVE BUILDING QUALITY AND EFFICIENCY
                    TABLE 94 OPERATION: BIM MARKET, BY OFFERING TYPE, 2019–2022 (USD MILLION)
                    TABLE 95 OPERATION: BIM MARKET, BY OFFERING TYPE, 2023–2028 (USD MILLION)
 
9 MARKET, BY APPLICATION (Page No. - 126)
    9.1 INTRODUCTION 
           FIGURE 43 BUILDINGS SEGMENT TO CAPTURE LARGEST MARKET SHARE IN 2028
           TABLE 96 BUILDING INFORMATION MODELING MARKET, BY APPLICATION, 2019–2022 (USD MILLION)
           TABLE 97 MARKET, BY APPLICATION, 2023–2028 (USD MILLION)
    9.2 BUILDINGS 
           9.2.1 INCREASING NUMBER OF CONSTRUCTION PROJECTS WORLDWIDE TO DRIVE USE OF BIM IN BUILDINGS
                    TABLE 98 BUILDINGS: MARKET, BY OFFERING TYPE, 2019–2022 (USD MILLION)
                    TABLE 99 BUILDINGS: MARKET, BY OFFERING TYPE, 2023–2028 (USD MILLION)
    9.3 INDUSTRIAL 
           9.3.1 GROWING USE OF BIM IN INDUSTRIAL FACILITIES AND CONSTRUCTION SITES TO BOOST SEGMENTAL GROWTH
                    TABLE 100 INDUSTRIAL: MARKET, BY OFFERING TYPE, 2019–2022 (USD MILLION)
                    TABLE 101 INDUSTRIAL: MARKET, BY OFFERING TYPE, 2023–2028 (USD MILLION)
    9.4 CIVIL INFRASTRUCTURE 
           9.4.1 RISING ADOPTION OF BIM IN GOVERNMENT-BASED INFRASTRUCTURE PROJECTS TO DRIVE MARKET
                    TABLE 102 CIVIL INFRASTRUCTURE: MARKET, BY OFFERING TYPE, 2019–2022 (USD MILLION)
                    TABLE 103 CIVIL INFRASTRUCTURE: MARKET, BY OFFERING TYPE, 2023–2028 (USD MILLION)
    9.5 OIL & GAS 
           9.5.1 INCREASING USE OF BIM TECHNOLOGY BY OIL & GAS COMPANIES TO IMPROVE FACILITY FUNCTIONALITY TO DRIVE SEGMENTAL GROWTH
                    TABLE 104 OIL & GAS: MARKET, BY OFFERING TYPE, 2019–2022 (USD MILLION)
                    TABLE 105 OIL & GAS: MARKET, BY OFFERING TYPE, 2023–2028 (USD MILLION)
    9.6 UTILITIES 
           9.6.1 GROWING IMPLEMENTATION OF BIM IN UTILITIES TO REDUCE REWORK AND DELAYS TO DRIVE SEGMENTAL GROWTH
                    TABLE 106 UTILITIES: MARKET, BY OFFERING TYPE, 2019–2022 (USD MILLION)
                    TABLE 107 UTILITIES: MARKET, BY OFFERING TYPE, 2023–2028 (USD MILLION)
    9.7 OTHER APPLICATIONS 
           TABLE 108 OTHER APPLICATIONS: MARKET, BY OFFERING TYPE, 2019–2022 (USD MILLION)
           TABLE 109 OTHER APPLICATIONS: BUILDING INFORMATION MODELING MARKET, BY OFFERING TYPE, 2023–2028 (USD MILLION)
 
10 BUILDING INFORMATION MODELING MARKET, BY END USER (Page No. - 134)
     10.1 INTRODUCTION 
             FIGURE 44 AEC PROFESSIONALS TO LEAD MARKET THROUGHOUT FORECAST PERIOD
             TABLE 110 MARKET, BY END USER, 2019–2022 (USD MILLION)
             TABLE 111 MARKET, BY END USER, 2023–2028 (USD MILLION)
     10.2 AEC PROFESSIONALS 
             10.2.1 AEC PROFESSIONALS TO BE SIGNIFICANT CONTRIBUTORS TO BIM MARKET GROWTH IN COMING YEARS
     10.3 CONSULTANTS & FACILITY MANAGERS 
             10.3.1 USE OF BIM BY CONSULTANTS & FACILITY MANAGERS TO AVOID OR REDUCE COST OVERRUNS AND DELAYS
     10.4 OTHERS 
 
11 BUILDING INFORMATION MODELING MARKET, BY REGION (Page No. - 138)
     11.1 INTRODUCTION 
             FIGURE 45 NORTH AMERICA TO HOLD LARGEST MARKET SHARE IN 2028
             TABLE 112 MARKET, BY REGION, 2019–2022 (USD MILLION)
             TABLE 113 MARKET, BY REGION, 2023–2028 (USD MILLION)
     11.2 NORTH AMERICA 
             FIGURE 46 NORTH AMERICA: BUILDING INFORMATION MODELING MARKET SNAPSHOT
             TABLE 114 NORTH AMERICA: BIM MARKET, BY COUNTRY, 2019–2022 (USD MILLION)
             TABLE 115 NORTH AMERICA: BIM MARKET, BY COUNTRY, 2023–2028 (USD MILLION)
             TABLE 116 NORTH AMERICA: BIM MARKET, BY OFFERING TYPE, 2019–2022 (USD MILLION)
             TABLE 117 NORTH AMERICA: BIM MARKET, BY OFFERING TYPE, 2023–2028 (USD MILLION)
             FIGURE 47 ARCHITECTURAL DESIGN SOFTWARE TO HOLD LARGEST SHARE OF BUILDING INFORMATION MODELING MARKET IN NORTH AMERICA IN 2028
             TABLE 118 NORTH AMERICA: BIM MARKET, BY SOFTWARE TYPE, 2019–2022 (USD MILLION)
             TABLE 119 NORTH AMERICA: BIM MARKET, BY SOFTWARE TYPE, 2023–2028 (USD MILLION)
             TABLE 120 NORTH AMERICA: BIM MARKET, BY SERVICE TYPE, 2019–2022 (USD MILLION)
             TABLE 121 NORTH AMERICA: BIM MARKET, BY SERVICE TYPE, 2023–2028 (USD MILLION)
             11.2.1 US
                        11.2.1.1 Large-scale adoption of BIM in construction industry of US to drive market
 
             11.2.2 CANADA
                        11.2.2.1 Adoption of BIM in public projects in construction sector to stimulate market growth
             11.2.3 MEXICO
                        11.2.3.1 Rising use of BIM in academic field to drive market
             11.2.4 IMPACT OF RECESSION ON MARKET IN NORTH AMERICA
     11.3 EUROPE 
             FIGURE 48 EUROPE: BIM MARKET SNAPSHOT
             TABLE 122 EUROPE: BIM MARKET, BY COUNTRY, 2019–2022 (USD MILLION)
             TABLE 123 EUROPE: BUILDING INFORMATION MODELING MARKET, BY COUNTRY, 2023–2028 (USD MILLION)
             TABLE 124 EUROPE: BIM MARKET, BY OFFERING TYPE, 2019–2022 (USD MILLION)
             TABLE 125 EUROPE: BIM MARKET, BY OFFERING TYPE, 2023–2028 (USD MILLION)
             FIGURE 49 ARCHITECTURAL DESIGN SEGMENT TO HOLD LARGEST SHARE OF EUROPEAN MARKET, BY SOFTWARE TYPE, IN 2028
             TABLE 126 EUROPE: BIM MARKET, BY SOFTWARE TYPE, 2019–2022 (USD MILLION)
             TABLE 127 EUROPE: BIM MARKET, BY SOFTWARE TYPE, 2023–2028 (USD MILLION)
             TABLE 128 EUROPE: BUILDING INFORMATION MODELING MARKET, BY SERVICE TYPE, 2019–2022 (USD MILLION)
             TABLE 129 EUROPE: BIM MARKET, BY SERVICE TYPE, 2023–2028 (USD MILLION)
             11.3.1 UK
                        11.3.1.1 Government mandates to accelerate demand for BIM
             11.3.2 GERMANY
                        11.3.2.1 Adoption of BIM triggered by pilot projects to boost market
             11.3.3 FRANCE
                        11.3.3.1 Initiatives by construction companies to adopt BIM to drive market
             11.3.4 ITALY
                        11.3.4.1 Implementation of BIM by government to fuel segmental growth
             11.3.5 SPAIN
                        11.3.5.1 Collaborative efforts of government, construction players, and BIM experts to support market growth
             11.3.6 REST OF EUROPE
             11.3.7 IMPACT OF RECESSION ON MARKET IN EUROPE
     11.4 ASIA PACIFIC 
             FIGURE 50 ASIA PACIFIC: MARKET SNAPSHOT
             TABLE 130 ASIA PACIFIC: MARKET, BY COUNTRY, 2019–2022 (USD MILLION)
             TABLE 131 ASIA PACIFIC: MARKET, BY COUNTRY, 2023–2028 (USD MILLION)
             TABLE 132 ASIA PACIFIC: BUILDING INFORMATION MODELING MARKET, BY OFFERING TYPE, 2019–2022 (USD MILLION)
             TABLE 133 ASIA PACIFIC: MARKET, BY OFFERING TYPE, 2023–2028 (USD MILLION)
             FIGURE 51 ARCHITECTURAL DESIGN SOFTWARE TO HOLD LARGEST SHARE OF ASIA PACIFIC MARKET IN 2028
             TABLE 134 ASIA PACIFIC: MARKET, BY SOFTWARE TYPE, 2019–2022 (USD MILLION)
             TABLE 135 ASIA PACIFIC: MARKET, BY SOFTWARE TYPE, 2023–2028 (USD MILLION)
             TABLE 136 ASIA PACIFIC: MARKET, BY SERVICE TYPE, 2019–2022 (USD MILLION)
             TABLE 137 ASIA PACIFIC: MARKET, BY SERVICE TYPE, 2023–2028 (USD MILLION)
             11.4.1 CHINA
                        11.4.1.1 Rising investments in infrastructure projects to contribute to market growth
             11.4.2 JAPAN
                        11.4.2.1 Adoption of BIM software in infrastructure projects to drive market
             11.4.3 INDIA
                        11.4.3.1 Increasing use of BIM in public projects in India to drive market
             11.4.4 SOUTH KOREA
                        11.4.4.1 Government mandates for use of BIM in public domain projects to create opportunities
             11.4.5 REST OF ASIA PACIFIC
             11.4.6 IMPACT OF RECESSION ON MARKET IN ASIA PACIFIC
     11.5 REST OF THE WORLD 
             TABLE 138 ROW: MARKET, BY REGION, 2019–2022 (USD MILLION)
             TABLE 139 ROW: MARKET, BY REGION, 2023–2028 (USD MILLION)
             TABLE 140 ROW: MARKET, BY OFFERING TYPE, 2019–2022 (USD MILLION)
             TABLE 141 ROW: MARKET, BY OFFERING TYPE, 2023–2028 (USD MILLION)
             FIGURE 52 ARCHITECTURAL DESIGN SOFTWARE TO HOLD LARGEST SHARE OF MARKET IN ROW IN 2028
             TABLE 142 ROW: MARKET, BY SOFTWARE TYPE, 2019–2022 (USD MILLION)
             TABLE 143 ROW: MARKET, BY SOFTWARE TYPE, 2023–2028 (USD MILLION)
             TABLE 144 ROW: MARKET, BY SERVICE TYPE, 2019–2022 (USD MILLION)
             TABLE 145 ROW: MARKET, BY SERVICE TYPE, 2023–2028 (USD MILLION)
             11.5.1 MIDDLE EAST & AFRICA
                        11.5.1.1 BIM to transform infrastructural projects in Middle East & Africa
             11.5.2 SOUTH AMERICA
                        11.5.2.1 AEC industry to be biggest contributor to South American BIM market
             11.5.3 IMPACT OF RECESSION ON MARKET IN ROW
 
12 COMPETITIVE LANDSCAPE (Page No. - 164)
     12.1 OVERVIEW 
     12.2 MARKET EVALUATION FRAMEWORK 
             TABLE 146 KEY STRATEGIES FOLLOWED BY MAJOR PROVIDERS OF BIM SOLUTIONS AND SERVICES
             12.2.1 PRODUCT PORTFOLIO
             12.2.2 REGIONAL FOCUS
             12.2.3 MANUFACTURING FOOTPRINT
             12.2.4 ORGANIC/INORGANIC STRATEGIES
     12.3 MARKET SHARE ANALYSIS, 2022 
             TABLE 147 BUILDING INFORMATION MODELING MARKET: MARKET SHARE ANALYSIS (2022)
     12.4 FIVE-YEAR COMPANY REVENUE ANALYSIS 
             FIGURE 53 FIE-YEAR REVENUE ANALYSIS OF TOP 5 PLAYERS IN MARKET
     12.5 COMPANY EVALUATION MATRIX, 2022 
             12.5.1 STARS
             12.5.2 EMERGING LEADERS
             12.5.3 PERVASIVE PLAYERS
             12.5.4 PARTICIPANTS
                        FIGURE 54 MARKET: COMPANY EVALUATION MATRIX, 2022
     12.6 STARTUPS/SMALL AND MEDIUM-SIZED ENTERPRISES (SMES) EVALUATION MATRIX, 2022 
             TABLE 148 MARKET: LIST OF KEY STARTUPS/SMES
             TABLE 149 STARTUPS/SMES IN MARKET
             TABLE 150 BUILDING INFORMATION MODELING MARKET: COMPETITIVE BENCHMARKING OF KEY STARTUPS/SMES (OFFERING TYPE FOOTPRINT)
             TABLE 151 MARKET: COMPETITIVE BENCHMARKING OF KEY STARTUPS/SMES (APPLICATION FOOTPRINT)
             TABLE 152 MARKET: COMPETITIVE BENCHMARKING OF KEY STARTUPS/SMES (REGION FOOTPRINT)
             12.6.1 PROGRESSIVE COMPANIES
             12.6.2 RESPONSIVE COMPANIES
             12.6.3 DYNAMIC COMPANIES
             12.6.4 STARTING BLOCKS
                        FIGURE 55 STARTUPS/SMES EVALUATION MATRIX, 2022
     12.7 COMPANY FOOTPRINT 
             TABLE 153 COMPANY FOOTPRINT
             TABLE 154 COMPANY-WISE OFFERING FOOTPRINT
             TABLE 155 COMPANY-WISE APPLICATION FOOTPRINT
             TABLE 156 COMPANY-WISE REGION FOOTPRINT
     12.8 COMPETITIVE SITUATIONS AND TRENDS 
             12.8.1 PRODUCT LAUNCHES
                        TABLE 157 PRODUCT LAUNCHES, MARCH 2020–APRIL 2023
             12.8.2 DEALS
                        TABLE 158 DEALS, MARCH 2020–APRIL 2023
             12.8.3 OTHERS
                        TABLE 159 OTHERS, MARCH 2020–APRIL 2023
 
13 COMPANY PROFILES (Page No. - 191)
     13.1 KEY PLAYERS 
(Business Overview, Products/Services offered, Recent Developments, and MnM View)*  
             13.1.1 AUTODESK INC.
                        TABLE 160 AUTODESK INC.: COMPANY OVERVIEW
                        FIGURE 56 AUTODESK INC.: COMPANY SNAPSHOT
                        TABLE 161 AUTODESK INC.: PRODUCTS/SERVICES OFFERED
                        TABLE 162 AUTODESK INC.: PRODUCT LAUNCHES
                        TABLE 163 AUTODESK INC.: DEALS
             13.1.2 NEMETSCHEK GROUP
                        TABLE 164 NEMETSCHEK GROUP: COMPANY OVERVIEW
                        FIGURE 57 NEMETSCHEK GROUP: COMPANY SNAPSHOT
                        TABLE 165 NEMETSCHEK GROUP: PRODUCTS/SERVICES OFFERED
                        TABLE 166 NEMETSCHEK GROUP: PRODUCT LAUNCHES
                        TABLE 167 NEMETSCHEK GROUP: DEALS
             13.1.3 BENTLEY SYSTEMS
                        TABLE 168 BENTLEY SYSTEMS: COMPANY OVERVIEW
                        FIGURE 58 BENTLEY SYSTEMS: COMPANY SNAPSHOT
                        TABLE 169 BENTLEY SYSTEMS: PRODUCTS/SERVICES OFFERED
                        TABLE 170 BENTLEY SYSTEMS: PRODUCT LAUNCHES
                        TABLE 171 BENTLEY SYSTEMS: DEALS
             13.1.4 TRIMBLE INC.
                        TABLE 172 TRIMBLE INC.: COMPANY OVERVIEW
                        FIGURE 59 TRIMBLE INC.: COMPANY SNAPSHOT
                        TABLE 173 TRIMBLE INC.: PRODUCTS/SERVICES OFFERED
                        TABLE 174 TRIMBLE INC.: PRODUCT LAUNCHES
                        TABLE 175 TRIMBLE INC.: DEALS
             13.1.5 DASSAULT SYSTÈMES
                        TABLE 176 DASSAULT SYSTÈMES: COMPANY OVERVIEW
                        FIGURE 60 DASSAULT SYSTÈMES: COMPANY SNAPSHOT
                        TABLE 177 DASSAULT SYSTÈMES: PRODUCTS/SERVICES OFFERED
                        TABLE 178 DASSAULT SYSTÈMES: PRODUCT LAUNCHES
                        TABLE 179 DASSAULT SYSTÈMES: DEALS
             13.1.6 SCHNEIDER ELECTRIC
                        TABLE 180 SCHNEIDER ELECTRIC: COMPANY OVERVIEW
                        FIGURE 61 SCHNEIDER ELECTRIC: COMPANY SNAPSHOT
                        TABLE 181 SCHNEIDER ELECTRIC: PRODUCTS/SERVICES OFFERED
                        TABLE 182 SCHNEIDER ELECTRIC: PRODUCT LAUNCHES
                        TABLE 183 SCHNEIDER ELECTRIC: DEALS
             13.1.7 ASITE
                        TABLE 184 ASITE: COMPANY OVERVIEW
                        FIGURE 62 ASITE: COMPANY SNAPSHOT
                        TABLE 185 ASITE: PRODUCTS/SERVICES OFFERED
                        TABLE 186 ASITE: PRODUCT LAUNCHES
                        TABLE 187 ASITE: DEALS
                        TABLE 188 ASITE: OTHERS
             13.1.8 HEXAGON
                        TABLE 189 HEXAGON: COMPANY OVERVIEW
                        FIGURE 63 HEXAGON: COMPANY SNAPSHOT
                        TABLE 190 HEXAGON: PRODUCTS/SERVICES OFFERED
                        TABLE 191 HEXAGON: PRODUCT LAUNCHES
                        TABLE 192 HEXAGON: DEALS
             13.1.9 PROCORE TECHNOLOGIES, INC.
                        TABLE 193 PROCORE TECHNOLOGIES, INC.: COMPANY OVERVIEW
                        FIGURE 64 PROCORE TECHNOLOGIES, INC.: COMPANY SNAPSHOT
                        TABLE 194 PROCORE TECHNOLOGIES, INC.: PRODUCTS/SERVICES OFFERED
                        TABLE 195 PROCORE TECHNOLOGIES, INC.: PRODUCT LAUNCHES
                        TABLE 196 PROCORE TECHNOLOGIES, INC.: DEALS
                        TABLE 197 PROCORE TECHNOLOGIES, INC.: OTHERS
             13.1.10 ARCHIDATA INC.
                        TABLE 198 ARCHIDATA INC.: COMPANY OVERVIEW
                        TABLE 199 ARCHIDATA INC.: PRODUCTS/SERVICES OFFERED
* Business Overview, Products/Services offered, Recent Developments, and MnM View might not be captured in case of unlisted companies.  
     13.2 OTHER PLAYERS 
             13.2.1 ACCA SOFTWARE
                        TABLE 200 ACCA SOFTWARE
             13.2.2 TREISTEK INDIA PVT. LTD.
                        TABLE 201 TREISTEK INDIA PVT. LTD.
             13.2.3 PINNACLE INFOTECH SOLUTIONS
                        TABLE 202 PINNACLE INFOTECH SOLUTIONS
             13.2.4 CONCORA
                        TABLE 203 CONCORA
             13.2.5 AFRY
                        TABLE 204 AFRY
             13.2.6 BECK TECHNOLOGY
                        TABLE 205 BECK TECHNOLOGY
             13.2.7 COMPUTERS AND STRUCTURES, INC. (CSI)
                        TABLE 206 COMPUTERS AND STRUCTURES, INC. (CSI)
             13.2.8 ROBERT MCNEEL & ASSOCIATES
                        TABLE 207 ROBERT MCNEEL & ASSOCIATES
             13.2.9 4M
                        TABLE 208 4M
             13.2.10 SIERRASOFT
                        TABLE 209 SIERRASOFT
             13.2.11 SAFE SOFTWARE INC.
                        TABLE 210 SAFE SOFTWARE INC.
             13.2.12 TOPCON
                        TABLE 211 TOPCON
             13.2.13 FARO
                        TABLE 212 FARO
             13.2.14 GEO-PLUS INC.
                        TABLE 213 GEO-PLUS INC.
             13.2.15 VECTORWORKS, INC.
                        TABLE 214 VECTORWORKS, INC.
 
14 APPENDIX (Page No. - 239)
     14.1 DISCUSSION GUIDE 
     14.2 KNOWLEDGESTORE: MARKETSANDMARKETS’ SUBSCRIPTION PORTAL 
     14.3 CUSTOMIZATION OPTIONS 
     14.4 RELATED REPORTS 
     14.5 AUTHOR DETAILS 


The study involved four major activities in estimating the size of the building information modeling (BIM) market. Exhaustive secondary research has been carried out to collect information on the market, the peer markets, and the parent market. Both top-down and bottom-up approaches have been employed to estimate the total market size. Market breakdown and data triangulation methods have also been used to estimate the market for segments and subsegments.

Secondary Research

Revenues of companies offering BIM solutions have been obtained from the secondary data available through paid and unpaid sources. The revenues have also been derived by analyzing the product portfolio of key companies, and these companies have been rated according to the performance and quality of their products.

In the secondary research process, various sources have been referred to for identifying and collecting information for this study on the building information modeling market. Secondary sources considered for this research study include government sources; corporate filings; and trade, business, and professional associations. Secondary data has been collected and analyzed to arrive at the overall market size, which has been further validated through primary research.

Secondary research has been mainly used to obtain key information about the supply chain of BIM solutions to identify key players based on their products and prevailing industry trends in the building information modeling market by offering type, by deployment type, by project lifecycle, by application, by end-user, and region. Secondary research also helped obtain market information- and technology-oriented key developments undertaken by market players to expand their presence and increase their market share.  
Primary Research

Extensive primary research has been conducted after understanding and analyzing the current scenario of the building information modeling market through secondary research. Several primary interviews have been conducted with the key opinion leaders from demand and supply sides across four main regions—the North America, Europe, Asia Pacific, and Rest of Europe. Approximately 25% of the primary interviews were conducted with the demand-side respondents, while approximately 75% have been conducted with the supply-side respondents. The primary data has been collected through questionnaires, emails, and telephonic interviews.

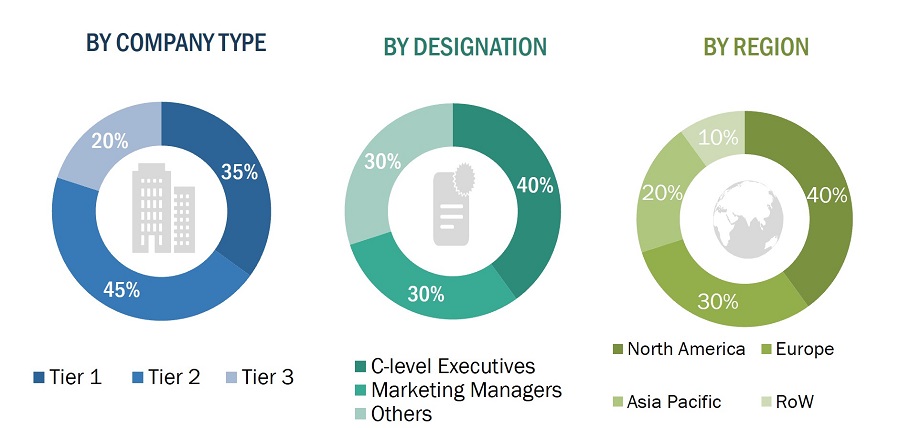
After interacting with industry experts, brief sessions were conducted with highly experienced independent consultants to reinforce the findings from our primary. This, along with the in-house subject matter experts’ opinions, has led us to the findings as described in the remainder of this report. The breakdown of primary respondents is as follows:
Building Information Modeling Market Size, and Share

To know about the assumptions considered for the study, download the pdf brochure

BIM Market Size Estimation

The bottom-up procedure has been employed to arrive at the overall size of the building information modeling market.

  • Identifying approximate revenues of companies involved in the building information modeling ecosystem
  • Identifying different offerings of players in the building information modeling market
  • Analyzing the global penetration of each building information modeling offering through secondary and primary research  
  • Conducting multiple discussion sessions with key opinion leaders to understand the building information modeling solutions and their applications; analyzing the breakup of the work carried out by each key company     
  • Verifying and crosschecking estimates at every level with key opinion leaders, including chief executive officers (CEO), directors, and operation managers, and then, finally, with the domain experts of MarketsandMarkets
  • Studying various paid and unpaid sources of information such as press releases, white papers, and databases of the company- and region-specific developments undertaken in the building information modeling market

Building Information Modeling Market Size, and Share

The top-down approach has been used to estimate and validate the total size of the building information modeling market.

  • Focusing initially on the top-line investments and expenditures made in the building information modeling ecosystem, further splitting into offering and listing key developments in key market areas 
  • Identifying all major players offering a variety of building information modeling solutions, which has been verified through secondary research and a brief discussion with industry experts
  • Analyzing revenues, product mix, and geographic presence for which all identified players offer building information modeling products to estimate and arrive at the percentage splits for all key segments
  • Discussing these splits with industry experts to validate the information and identify key growth domains across all major segments 
  • Breaking down the total market based on verified splits and key growth domains across all segments

Building Information Modeling Market Size, and Top-Down Approach

Data Triangulation

After arriving at the overall market size-using the market size estimation processes as explained above—the market has been split into several segments and subsegments. To complete the entire market engineering process and arrive at the exact statistics of each market segment and subsegment, data triangulation and market breakdown procedures have been employed, wherever applicable. The data has been triangulated by studying various factors and trends from the demand and supply sides in the building information modeling market.

BIM Market Definition

Building Information Modeling (BIM) is a digital representation of the physical and functional characteristics of a building or infrastructure project. BIM involves creating and managing a 3D model that contains detailed information about the project's geometry, spatial relationships, materials, quantities, and other relevant data. BIM software goes beyond traditional 2D drafting by incorporating intelligent 3D models that contain detailed information about the project's components and their interactions.

Key Stakeholders

  • Raw material suppliers
  • Original equipment manufacturers (OEMs)
  • Original design manufacturers (ODM)
  • Research institutes
  • Building information modeling solution provider
  • Forums, alliances, and associations
  • Governments and financial institutions
  • Analysts and strategic business planners

Report Objectives

  • To describe and forecast the size of the building information modeling market in terms of the offering, deployment type, project lifecycle, application, and end-user
  • To describe and forecast the market size of various segments across four key regions—North America, Europe, Asia Pacific, and the Rest of the World (RoW), in terms of value 
  • To provide detailed information regarding the drivers, restraints, opportunities, and challenges influencing the growth of the building information modeling market 
  • To provide an overview of the value chain pertaining to the building information modeling ecosystem, along with the average selling prices of building information modeling solutions
  • To strategically analyze the ecosystem, tariff and regulatory landscape, patent landscape, Porter’s five forces, import and export scenarios, trade landscape, and case studies pertaining to the market under study
  • To strategically analyze micromarkets with regard to individual growth trends, prospects, and contributions to the overall market
  • To analyze opportunities in the market for stakeholders by identifying high-growth segments
  • To provide details of the competitive landscape for market leaders
  • To analyze strategies, such as product launches and development, acquisition, partnership, agreement, collaboration, agreement, expansion, and mergers adopted by players in the building information modeling market
  • To profile key players in the building information modeling market and comprehensively analyze their market ranking based on their revenue, market share, and core competencies  
  • Updated market developments of profiled players: The current report includes the market developments from March 2020 and April 2023. 

Available customizations:

With the given market data, MarketsandMarkets offers customizations according to the specific requirements of companies. The following customization options are available for the report:

  • Detailed analysis and profiling of additional market players based on various blocks of the supply chain
Custom Market Research Services

We will customize the research for you, in case the report listed above does not meet with your exact requirements. Our custom research will comprehensively cover the business information you require to help you arrive at strategic and profitable business decisions.

Request Customization

Instant Answers with GPT - Ask Now!

Ask real questions. Get complete answers !
Report Code
SE 2815
Published ON
Jun, 2023
Choose License Type
BUY NOW
  • SHARE
X
Request Customization
Speak to Analyst
Speak to Analyst
OR FACE-TO-FACE MEETING
PERSONALIZE THIS RESEARCH
  • Triangulate with your Own Data
  • Get Data as per your Format and Definition
  • Gain a Deeper Dive on a Specific Application, Geography, Customer or Competitor
  • Any level of Personalization
REQUEST A FREE CUSTOMIZATION
LET US HELP YOU!
  • What are the Known and Unknown Adjacencies Impacting the Building Information Modeling (BIM) Market
  • What will your New Revenue Sources be?
  • Who will be your Top Customer; what will make them switch?
  • Defend your Market Share or Win Competitors
  • Get a Scorecard for Target Partners
CUSTOMIZED WORKSHOP REQUEST
+1-888-600-6441
  • Call Us
  • +1-888-600-6441 (Corporate office hours)
  • +1-888-600-6441 (US/Can toll free)
  • +44-800-368-9399 (UK office hours)
CONNECT WITH US
ABOUT TRUST ONLINE
©2024 MarketsandMarkets Research Private Ltd. All rights reserved
DMCA.com Protection Status Website Feedback