
Catalyst Fertilizers Market by Fertilizer Production Process (Haber-Bosch Process, Contact Process), Metal Group (Base Metals, Precious Metals), Fertilizer Application (Nitrogenous, Phosphatic), and Region � Global Forecast to 2023
Market Segmentation
| Report Metrics | Details |
|
Market size available for years |
2018 - 2023 |
|
CAGR % |
2.36 |
Top 10 companies in Catalyst Fertilizers Market
Catalyst Fertilizers Market News
| Publish Date | Catalyst Fertilizers Market Updates |
|---|---|
| 12-Sep-2023 | Hybrid catalyst produces fertilizer and cleans wastewater |


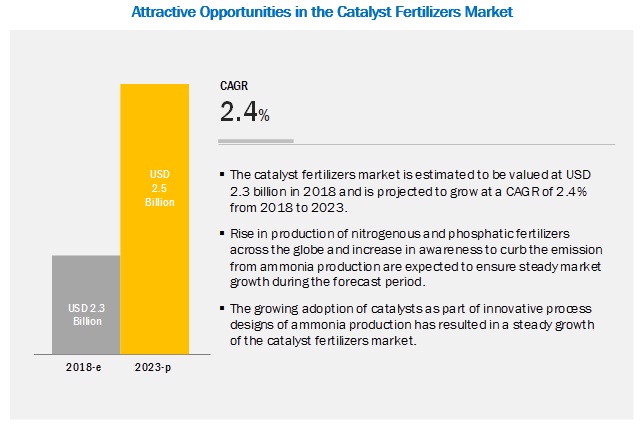
[133 Pages Report] The catalyst fertilizers market is estimated to account for USD 2.3 billion in 2018 and is projected to reach USD 2.5 billion by 2023, at a CAGR of 2.36% during the forecast period. The market is primarily driven by growth in the production of fertilizers and expansion of production facilities in Asia. Also, with the increase in greenhouse gas emissions from ammonia plants, innovations in the catalyst industry to control emissions through selective catalytic reduction technology are projected to drive the growth of the market over the next five years.
On the basis of fertilizer production process, the Haber-Bosch segment is projected to witness the fastest growth during the forecast period.
Ammonia is one of the largest inorganic chemical produced across the globe through the Haber-Bosch process, developed first by BASF. The Haber-Bosch process is based on catalytic reactions, and hence, the conversion rate has been high for this process. According to the estimates by USGS, global production is expected to continue to grow 3%-5% annually due to the increasing fertilizer demand. Apart from Haber-Bosch, owing to the increasing emissions of NOX and N2O into the environment from ammonia production, emission controlling catalysts have also been developed and are increasingly adopted in conjunction with synthesis catalysts. Thus, this process is projected to witness a comparatively fast growth during the forecast period.
On the basis of metal group, base metals are projected to witness the fastest growth in the market during the forecast period.
Catalysts are metal or organometallic compounds and are extensively used in refinery and fertilizer applications. Key players such as Clariant International (Switzerland), Johnson Matthey (UK), and Haldor Topsoe (Denmark) develop metal catalysts specifically for fertilizer production, wherein iron catalysts are the most preferred ones among ammonia fertilizer manufacturers. On the other hand, nickel and vanadium are widely used for sulfuric acid production in the Asia Pacific region. Raw materials occupy over 70% of the production cost, and since ammonia and phosphate fertilizer production is major in Asian countries, considering the developing economic conditions of these countries, cheaper catalysts would be opted to stabilize the fertilizer cost. Hence, base metals are expected to maintain their dominance at a higher CAGR during the forecast period.
On the basis of fertilizer application, the nitrogenous fertilizers segment is projected to witness the faster growth in the catalyst fertilizers market
According to FAOSTAT, of the total nutrients consumed as fertilizers across the globe in 2016, over 70.7% were nitrogenous nutrients. In comparison to phosphatic fertilizers, ammonia and urea production has been growing at a higher rate in the Asian countries. Also, with the increasing emissions from ammonia plants, emission control catalysts are being highly sought to meet the government standards in the market and hence, the nitrogenous fertilizers segment is projected to grow at a comparatively high CAGR during the forecast period.
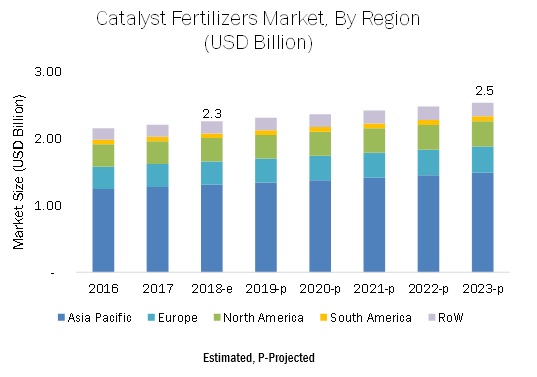
Asia Pacific is projected to witness the highest growth in the catalyst fertilizers market during the forecast period.
With the growing population in countries such as China and India, the demand for food products continues to grow each year in the region. To meet this challenge, it is necessary to increase crop production, which relies on the fertilizer industry. The Asia Pacific market for catalyst fertilizers is driven by the rising need to increase crop yield and growing production of fertilizers. The growth in the production of fertilizers is mainly due to the increase in the consumption of fertilizers and support from the governments to increase the production. The growth of the Indian catalyst fertilizers market is driven by new installments and upgradation of ammonia plants, with respect to natural gas feedstock, and government support for fertilizer production through subsidies.
Key Market Players
There are many local and global players who provide catalysts for different industry verticals, especially refinery and pharmaceutical industries that hold strong demand for these catalysts. Multiple companies are major suppliers of catalysts in more than one industry, and hence, the end-use applications for their products are not mentioned. Hence, the scope of this report includes a detailed study of only those catalyst manufacturers whose portfolio mentions the end use as fertilizers, such as Clariant International (Switzerland), DowDuPont (US), Project & Development India Ltd. (India), Johnson Matthey (UK), Haldor-Topsoe (Denmark), LKAB Minerals (Sweden), N.E.Chemcat (Japan), QuantumSphere Inc. (US), Quality Magnetite (US), and Oham Industries (India). Various strategies such as joint ventures, supply agreements, and new product launches were adopted by companies, to enter the catalyst fertilizers market.
Scope of Report
|
Report Metric |
Details |
|
Market sizes available for years |
2016�2023 |
|
Base year considered |
2017 |
|
Forecast period |
2018�2023 |
|
Forecast units |
Value (USD) |
|
Segments covered |
Fertilizer Application, Metal Group, Fertilizer Production Process, and Region |
|
Geographies covered |
North America, Asia Pacific, Europe, South America, and RoW |
|
Companies covered |
Clariant International (Switzerland), DowDuPont (US), Project & Development India Ltd. (India), Johnson Matthey (UK), Haldor Topsoe (Denmark), LKAB Minerals (Sweden), N.E.Chemcat (Japan), QuantumSphere Inc. (US), Quality Magnetite (US), and Oham Industries (India) |
This research report categorizes the catalyst fertilizers market based on fertilizer application, metal group, fertilizer production process, and region.
On the basis of fertilizer application, the catalyst fertilizers market has been segmented as follows:
- Nitrogenous fertilizers
- Phosphatic fertilizers
On the basis of metal group, the catalyst fertilizers market has been segmented as follows:
- Base metals
- Iron
- Nickel
- Vanadium
- Other base metals (zinc, copper, cobalt, and chromium)
- Precious metals
- Platinum
- Rhodium
- Other precious metals (palladium and ruthenium)
On the basis of fertilizer production process, the catalyst fertilizers market has been segmented as follows:
- Haber-Bosch process
- Contact process
- Other processes (partial oxidation process, catalytic reforming of organic wastes, and plasma catalysis)
On the basis of region, the catalyst fertilizers market has been segmented as follows:
- North America
- Europe
- Asia Pacific
- South America
- RoW (Africa and the Middle East)
Key questions addressed by the report:
- How would the catalyst fertilizers market be dependent on the fertilizer industry and which fertilizer production processes adopt maximum catalysts?
- Which region will hold the largest share of the catalyst fertilizers market?
- Which catalysts have high demand in each key country-level market?
- What are the trends and factors responsible for influencing the adoption rate of reforming/emission control catalysts in key emerging countries? What is the level of support offered by governments to manufacturers to adopt these technologies?
- Which are the key players in the market and how intense is the competition?
To speak to our analyst for a discussion on the above findings, click Speak to Analyst
Table of Contents
1 Introduction (Page No. - 14)
1.1 Objectives of the Study
1.2 Market Definition
1.3 Study Scope
1.4 Periodization Considered
1.5 Currency Considered
1.6 Stakeholders
2 Research Methodology (Page No. - 18)
2.1 Research Data
2.1.1 Secondary Data
2.1.2 Primary Data
2.1.2.1 Key Industry Insights
2.1.2.2 Breakdown of Primary Interviews
2.2 Market Size Estimation
2.3 Data Triangulation
2.4 Research Assumptions
2.5 Limitations
3 Executive Summary (Page No. - 26)
4 Premium Insights (Page No. - 30)
4.1 Opportunities in the Catalyst Fertilizers Market
4.2 Catalyst Fertilizers Market, By Metal Group
4.3 Asia Pacific: Catalyst Fertilizers Market, By Fertilizer Production Process & Key Country
4.4 Catalyst Fertilizers Market, By Fertilizer Application & Region
4.5 Catalyst Fertilizers Market, By Key Country
5 Market Overview (Page No. - 35)
5.1 Introduction
5.2 Macroeconomic Indicators
5.2.1 Increasing Production Opportunities for Fertilizers
5.2.2 Fluctuating Prices of Natural Gas
5.3 Market Dynamics
5.3.1 Drivers
5.3.1.1 Growing Need for Efficient Fertilizer Production Across the Globe
5.3.1.1.1 Increased Output and Conversion Rate
5.3.1.2 Control of Emissions From Fertilizers
5.3.2 Restraints
5.3.2.1 Long Replacement Period for Catalyst Membranes Could Restrain the Market Growth
5.3.2.2 Rising Growth Opportunity for Organic Fertilizers
5.3.3 Opportunities
5.3.3.1 Global Growth in Fertilizer Consumption is Expected to Boost New Plant Commissions and Upgradations
5.3.3.1.1 Upgradation to Natural Gas-Based Feedstock for Fertilizer Production is Expected to Fuel the Growth of New Catalytic Unit Installments
5.3.3.2 Technological Advancements
5.3.3.2.1 Strong R&D Activities to Reduce the Cost of Catalysts
5.3.3.2.2 High Growth in R&D Activity to Improve the Quality and Functionality of Catalysts
5.3.4 Challenges
5.3.4.1 Uncomplimentary Commodity Prices and Lower Farm Incomes
5.4 Patent Analysis
5.5 Regulatory Framework
5.5.1 Introduction
5.5.2 Rules on Fertilizer Production
5.5.3 Standardization on GHG Emissions
5.5.4 Recovery of Spent Catalysts
6 Catalyst Fertilizers Market, By Fertilizer Production Process (Page No. - 52)
6.1 Introduction
6.2 Haber-Bosch Process
6.2.1 Approximately 80% of the Entire Ammonia Produced By Haber-Bosch Process is Used in the Fertilizer Industry
6.3 Contact Process
6.3.1 Sulfuric Acid is the Most Produced Chemical in the Us
6.4 Other Processes
7 Catalyst Fertilizers Market, By Metal Group (Page No. - 58)
7.1 Introduction
7.2 Base Metals
7.2.1 Lower Cost of Base Metals is the Major Factor for Its High Demand From Fertilizer Manufacturers
7.3 Precious Metals
7.3.1 Inherent Chemical Properties of Precious Metals Provide Higher Selectivity and Stability During Reactions
8 Catalyst Fertilizers Market, By Fertilizer Application (Page No. - 65)
8.1 Introduction
8.2 Nitrogenous Fertilizers
8.2.1 Rising Awareness on GHG Emissions From Ammonia Plants has Boosted the Growth Rate of Catalysts for Ammonia Production
8.3 Phosphatic Fertilizers
8.3.1 Heavy Dependency of Phosphatic Fertilizers on the Oil Industry has Been Hampering the Growth of these Fertilizers
9 Catalyst Fertilizers Market, By Region (Page No. - 70)
9.1 Introduction
9.2 North America
9.2.1 US
9.2.1.1 Increase in the Ammonia Production Capacity is Projected to Boost the Market Growth
9.2.2 Canada
9.2.2.1 The Increasing Expansion of Ammonia-Based Fertilizer Plants to Strengthen the Demand for Catalysts
9.2.3 Mexico
9.2.3.1 Fertilizer Production in the Country is Driven By the Increasing Fertilizer Consumption for Grain Crops
9.3 Europe
9.3.1 Russia
9.3.1.1 Largest Producer of Fertilizers Due to the Huge Reserves of Sulfur, Ammonia, and Phosphate Rocks
9.3.2 Netherlands
9.3.2.1 Second Largest Nitrogenous Fertilizer Producer in Europe
9.3.3 Poland
9.3.3.1 Haber-Bosch Process Dominated the Market Due to the High Production of Ammonia-Based Fertilizers
9.3.4 Rest of Europe
9.4 Asia Pacific
9.4.1 China
9.4.1.1 Dominance Due to High Fertilizer Production and Rising Investments in Efficient Catalyst Membranes to Control Emissions
9.4.2 India
9.4.2.1 Strong Demand Due to Upgradation of Ammonia Plants With Natural Gas-Based Feedstock
9.4.3 Indonesia
9.4.3.1 Indonesia, Being the Fifth-Largest Producer and Sixth-Largest Exporter of Ammonia, is Expected to Experience Increased Demand for 91
9.4.4 Rest of Asia Pacific
9.5 South America
9.5.1 Brazil
9.5.1.1 Brazil Contributes to Approximately 60% of the South American Fertilizer Production
9.5.2 Argentina
9.5.2.1 With the Recent Import Duty Posed on Phosphate Fertilizers, Production is Estimated to Grow in Argentina
9.5.3 Rest of South America
9.6 Rest of the World (RoW)
9.6.1 Middle East
9.6.1.1 Large Reserves of Sulfur and Natural Gas Reflect Higher Fertilizer Production in the Region
9.6.2 Africa
9.6.2.1 Increase in the Number of Fertilizer Production Plants Fuels the Demand for Catalyst Fertilizers
10 Competitive Landscape (Page No. - 104)
10.1 Introduction
10.2 Competitive Leadership Mapping
10.2.1 Visionary Leaders
10.2.2 Product Differentiators
10.2.3 Value Chain Builders
10.2.4 Emerging Pathfinders
10.3 Market Ranking Analysis, By Company
10.4 Competitive Scenario
10.4.1 Agreements, Collaborations, Partnerships, and Joint Ventures
10.4.2 Expansions & Investments
10.4.3 Mergers & Acquisitions
10.4.4 New Product/Technology Launches
11 Company Profiles (Page No. - 109)
(Business Overview, Products Offered, Recent Developments, SWOT Analysis & MnM View)*
11.1 Clariant International
11.2 Dowdupont
11.3 Projects & Development India Limited (PDIL)
11.4 Lkab Minerals
11.5 Johnson Matthey
11.6 Quantumsphere Inc.
11.7 Haldor Topsoe
11.8 N.E.Chemcat
11.9 Quality Magnetite
11.10 Oham Industries
*Details on Business Overview, Products Offered, Recent Developments, SWOT Analysis & MnM View Might Not Be Captured in Case of Unlisted Companies.
12 Appendix (Page No. - 126)
12.1 Discussion Guide
12.2 Knowledge Store: MarketsandMarkets� Subscription Portal
12.3 Available Customizations
12.4 Related Reports
12.5 Author Details
List of Tables (74 Tables)
Table 1 USD Exchange Rate, 2014�2017
Table 2 Typical Replacement Period of Catalysts
Table 3 List of Some Key Patents for Catalyst Fertilizers, 2014�2018
Table 4 Air Emission Levels for Nitrogenous Fertilizer Manufacturing Plants
Table 5 Catalyst Fertilizers Market Size, By Fertilizer Production Process, 2016�2023 (USD Million)
Table 6 Haber-Bosch Process Catalysts Market Size, By Region, 2016�2023 (USD Million)
Table 7 Contact Process Catalysts Market Size, By Region, 2016�2023 (USD Million)
Table 8 Other Process Catalysts Market Size, By Region, 2016�2023 (USD Million)
Table 9 Catalyst Fertilizers Market Size, By Metal Group, 2016�2023 (USD Million)
Table 10 Base Metals: Catalyst Fertilizers Market Size, By Region, 2016�2023 (USD Million)
Table 11 Base Metals: Catalyst Fertilizers Market Size, By Metal Type, 2016�2023 (USD Million)
Table 12 Precious Metals: Catalyst Fertilizers Market Size, By Metal Type, 2016�2023 (USD Million)
Table 13 Precious Metals: Fertilizer Catalyst Market Size, By Region, 2016�2023 (USD Million)
Table 14 Catalyst Fertilizers Market Size, By Fertilizer Application, 2016�2023 (USD Million)
Table 15 Nitrogenous Fertilizers: Catalyst Fertilizers Market Size, By Region, 2016�2023 (USD Million)
Table 16 Phosphatic Fertilizers: Catalyst Fertilizers Market Size, By Region, 2016�2023 (USD Million)
Table 17 Catalyst Fertilizers Market Size, By Region, 2016�2023 (USD Million)
Table 18 North America: Catalyst Fertilizers Market Size, By Country, 2016�2023 (USD Million)
Table 19 North America: Catalyst Fertilizers Market Size, By Fertilizer Production Process, 2016�2023 (USD Million)
Table 20 North America: Catalyst Fertilizers Market Size, By Metal Group, 2016�2023 (USD Million)
Table 21 North America: Catalyst Fertilizers Market Size, By Fertilizer Application, 2016�2023 (USD Million)
Table 22 US: Catalyst Fertilizers Market Size, By Fertilizer Production Process, 2016�2023 (USD Million)
Table 23 US: Catalyst Fertilizers Market Size, By Metal Group, 2016�2023 (USD Million)
Table 24 Canada: Catalyst Fertilizers Market Size, By Fertilizer Production Process, 2016�2023 (USD Million)
Table 25 Canada: Catalyst Fertilizers Market Size, By Metal Group, 2016�2023 (USD Million)
Table 26 Mexico: Catalyst Fertilizers Market Size, By Fertilizer Production Process, 2016�2023 (USD Million)
Table 27 Mexico: Catalyst Fertilizers Market Size, By Metal Group, 2016�2023 (USD Million)
Table 28 Europe: Catalyst Fertilizers Market Size, By Country, 2016�2023 (USD Million)
Table 29 Europe: Catalyst Fertilizers Market Size, By Fertilizer Production Process, 2016�2023 (USD Million)
Table 30 Europe: Catalyst Fertilizers Market Size, By Metal Group, 2016�2023 (USD Million)
Table 31 Europe: Catalyst Fertilizers Market Size, By Fertilizer Application, 2016�2023 (USD Million)
Table 32 Russia: Catalyst Fertilizers Market Size, By Fertilizer Production Process, 2016�2023 (USD Million)
Table 33 Russia: Catalyst Fertilizers Market Size, By Metal Group, 2016�2023 (USD Million)
Table 34 Netherlands: Catalyst Fertilizers Market Size, By Fertilizer Production Process, 2016�2023 (USD Million)
Table 35 Netherlands: Catalyst Fertilizers Market Size, By Metal Group, 2016�2023 (USD Million)
Table 36 Poland: Catalyst Fertilizers Market Size, By Fertilizer Production Process, 2016�2023 (USD Million)
Table 37 Poland: Catalyst Fertilizers Market Size, By Metal Group, 2016�2023 (USD Million)
Table 38 Rest of Europe: Catalyst Fertilizers Market Size, By Fertilizer Production Process, 2016�2023 (USD Million)
Table 39 Rest of Europe: Catalyst Fertilizers Market Size, By Metal Group, 2016�2023 (USD Million)
Table 40 Asia Pacific: Catalyst Fertilizers Market Size, By Country, 2016�2023 (USD Million)
Table 41 Asia Pacific: Catalyst Fertilizers Market Size, By Fertilizer Production Process, 2016�2023 (USD Million)
Table 42 Asia Pacific: Catalyst Fertilizers Market Size, By Metal Group, 2016�2023 (USD Million)
Table 43 Asia Pacific: Catalyst Fertilizers Market Size, By Fertilizer Application, 2016�2023 (USD Million)
Table 44 China: Catalyst Fertilizers Market Size, By Fertilizer Production Process, 2016�2023 (USD Million)
Table 45 China: Catalyst Fertilizers Market Size, By Metal Group, 2016�2023 (USD Million)
Table 46 India: Catalyst Fertilizers Market Size, By Fertilizer Production Process, 2016�2023 (USD Million)
Table 47 India: Catalyst Fertilizers Market Size, By Metal Group, 2016�2023 (USD Million)
Table 48 Indonesia: Catalyst Fertilizers Market Size, By Fertilizer Production Process, 2016�2023 (USD Million)
Table 49 Indonesia: Catalyst Fertilizers Market Size, By Metal Group, 2016�2023 (USD Million)
Table 50 Nitrogen- and Phosphate-Based Fertilizer Production in 2016 (000� Tons)
Table 51 Rest of Asia Pacific: Catalyst Fertilizers Market Size, By Fertilizer Production Process, 2016�2023 (USD Million)
Table 52 Rest of Asia Pacific: Catalyst Fertilizers Market Size, By Metal Group, 2016�2023 (USD Million)
Table 53 South America: Catalyst Fertilizers Market Size, By Country, 2016�2023 (USD Million)
Table 54 South America: Catalyst Fertilizers Market Size, By Fertilizer Production Process, 2016�2023 (USD Million)
Table 55 South America: Catalyst Fertilizers Market Size, By Metal Group, 2016�2023 (USD Million)
Table 56 South America: Catalyst Fertilizers Market Size, By Fertilizer Application, 2016�2023 (USD Million)
Table 57 Brazil: Catalyst Fertilizers Market Size, By Fertilizer Production Process, 2016�2023 (USD Million)
Table 58 Brazil: Catalyst Fertilizers Market Size, By Metal Group, 2016�2023 (USD Million)
Table 59 Argentina: Catalyst Fertilizers Market Size, By Fertilizer Production Process, 2016�2023 (USD Million)
Table 60 Argentina: Catalyst Fertilizers Market Size, By Metal Group, 2016�2023 (USD Million)
Table 61 Rest of South America: Catalyst Fertilizers Market Size, By Fertilizer Production Process, 2016�2023 (USD Million)
Table 62 Rest of South America: Catalyst Fertilizers Market Size, By Metal Group, 2016�2023 (USD Million)
Table 63 RoW: Catalyst Fertilizers Market Size, By Region, 2016�2023 (USD Million)
Table 64 RoW: Catalyst Fertilizers Market Size, By Fertilizer Production Process, 2016�2023 (USD Million)
Table 65 RoW: Catalyst Fertilizers Market Size, By Metal Group, 2016�2023 (USD Million)
Table 66 RoW: Catalyst Fertilizers Market Size, By Fertilizer Application, 2016�2023 (USD Million)
Table 67 Middle East: Catalyst Fertilizers Market Size, By Fertilizer Production Process, 2016�2023 (USD Million)
Table 68 Middle East: Catalyst Fertilizers Market Size, By Metal Group, 2016�2023 (USD Million)
Table 69 Africa: Catalyst Fertilizers Market Size, By Fertilizer Production Process, 2016�2023 (USD Million)
Table 70 Africa: Catalyst Fertilizers Market Size, By Metal Group, 2016�2023 (USD Million)
Table 71 Agreements, Collaborations, Partnerships, and Joint Ventures, 2013�2018
Table 72 Expansions & Investments, 2013�2018
Table 73 Mergers & Acquisitions, 2013�2018
Table 74 New Product/Technology Launches, 2013-2018
List of Figures (45 Figures)
Figure 1 Catalyst Fertilizers: Market Segmentation
Figure 2 Catalyst Fertilizers: Regional Segmentation
Figure 3 Catalyst Fertilizers: Research Design
Figure 4 Breakdown of Primary Interviews: By Company Type, Designation, and Region
Figure 5 Market Size Estimation Methodology: Bottom-Up Approach
Figure 6 Market Size Estimation Methodology: Top-Down Approach
Figure 7 Data Triangulation Methodology
Figure 8 Catalyst Fertilizers Market, By Fertilizer Production Process, 2018 vs. 2023
Figure 9 Catalyst Fertilizers Market Share, By Key Metal Catalyst, 2017
Figure 10 Catalyst Fertilizers Market, By Fertilizer Application, 2017
Figure 11 Catalyst Fertilizers Market: Regional Snapshot
Figure 12 Expansion of Production Facilities in Asia is Projected to Maintain the Steady Growth of Catalyst Fertilizers Market
Figure 13 Base Metals Were the Most Preferred Catalysts for Fertilizer Production in 2017
Figure 14 Asia Pacific: Strong Demand for Catalysts Among Ammonia Fertilizer Manufacturers in 2017
Figure 15 Asia Pacific Witnessed the Highest Demand for Catalyst Fertilizers in Both Ammonia and Phosphate Production in 2017
Figure 16 Russia and India are Projected to Witness Similar Growth During the Forecast Period
Figure 17 Production of Nitrogen Fertilizers, 2011�2016 (Million Tons)
Figure 18 Top 4 Nitrogen Fertilizer Exporters, 2013�2017 (MMT)
Figure 19 Top 4 Nitrogen Fertilizer Importers, 2013�2017 (MMT)
Figure 20 Fluctuations in Natural Gas and Fertilizer Prices, 2000�2018
Figure 21 Catalyst Fertilizers Market: Drivers, Restraints, Opportunities, and Challenges
Figure 22 Catalyst Activity in Ammonia Production
Figure 23 Rise in Emissions From Fertilizer Manufacturers, 2011�2014
Figure 24 Comparison of Emissions From Non-Catalyst and Catalyst Procedures
Figure 25 Organic Agriculture Growth, 2000�2015 (Million Hectares)
Figure 26 Fertilizer Demand of Each Agricultural Region, 2014�2018 (MMT)
Figure 27 Declining Commodity Prices Complemented With Lower Farm Incomes, 2010�2017
Figure 28 Number of Approved Patents for Catalyst Fertilizers, By Key Patent Holders, 2016�2018
Figure 29 Catalyst Fertilizers Market Size, By Fertilizer Production Process, 2018 vs. 2023 (USD Million)
Figure 30 Catalyst Fertilizers Market Size, By Metal Group, 2018 vs. 2023 (USD Million)
Figure 31 Catalyst Fertilizers Market Size, By Fertilizer Application, 2018 vs. 2023 (USD Million)
Figure 32 China Was A Dominant Market for Catalyst Fertilizers in 2017
Figure 33 North America: Regional Snapshot
Figure 34 Asia Pacific: Regional Snapshot
Figure 35 Catalyst Fertilizers Market (Global): Competitive Leadership Mapping, 2018
Figure 36 Company Rankings, 2018
Figure 37 Clariant International: Company Snapshot
Figure 38 Clariant International: SWOT Analysis
Figure 39 Dowdupont: Company Snapshot
Figure 40 Dowdupont: SWOT Analysis
Figure 41 PDIL: Company Snapshot
Figure 42 PDIL: SWOT Analysis
Figure 43 Lkab Minerals: Company Snapshot
Figure 44 Johnson Matthey: Company Snapshot
Figure 45 Haldor Topsoe: Company Snapshot
The study includes four major activities to estimate the current market size for catalyst fertilizers. Exhaustive secondary research was done to collect information on the overall market and the peer markets. The next step was to validate these findings, assumptions, and sizing with industry experts across the value chain through primary research. Both top-down and bottom-up approaches were used to estimate the complete market size. Thereafter, data triangulation was used, and the market breakdown was done to estimate the market size of segments and subsegments.
Secondary Research
In the secondary research process, various secondary sources were referred to, to identify and collect information for this study. The secondary sources included annual reports, press releases and investor presentations of companies, white papers, certified publications, articles from recognized authors, gold & silver standard websites, regulatory bodies, trade directories, and databases. Secondary research was mainly used to obtain important information about the industry�s supply chain, the market�s value chain, key players, and the market classification and segmentation according to the industry trends to the bottom-most level, and geographical markets. It was also used to obtain information on key developments from a market-oriented perspective.
Primary Research
The market comprises several stakeholders in the supply chain, which include metal/mineral ore suppliers, chemical solution providers, catalyst manufacturers, fertilizer manufacturers, and related organizations/institutions. Various primary sources from both the supply and demand sides of both markets were interviewed to obtain qualitative and quantitative information. The primary interviewees from the demand side include key opinion leaders, executives, vice presidents, and CEOs of companies producing fertilizers. The primary sources from the supply side include catalyst membrane designers, R&D institutions and organizations, and key opinion leaders.
To know about the assumptions considered for the study, download the pdf brochure
Market Size Estimation
Both top-down and bottom-up approaches were used to estimate and validate the total size of the market. These approaches were also used extensively to estimate the size of various dependent submarkets. The research methodology used to estimate the market size includes the following:
- The key players in the industry and markets were identified through extensive secondary research.
- All percentage share splits and breakdowns were determined using secondary sources and verified through primary sources.
- All the possible parameters that affect the markets covered in this research study were covered in extensive detail, verified through primary research, and analyzed to obtain the final quantitative and qualitative data.
- Research included the study of reports, reviews, and newsletters of top market players along with extensive interviews for opinions from leaders such as CEOs, directors, and marketing executives.
Data Triangulation
After arriving at the overall market size from the estimation process explained above, the total market was split into several segments and subsegments. In order to arrive at the exact statistics for all segments and subsegments, the data triangulation and market breakdown procedures were employed wherever applicable. The data was triangulated by studying various factors and trends from both the demand and supply sides. Along with this, the market was validated using both top-down and bottom-up approaches.
Report Objectives
- Determining and projecting the size of the catalyst fertilizers market on the basis of fertilizer application, metal group, fertilizer production process, and region, over a five-year period ranging from 2018 to 2023
- Identifying attractive opportunities in the market by determining the largest and fastest-growing segments across regions
- Analyzing the demand-side factors on the basis of the following:
- Impact of macro- and microeconomic factors on the market
- Shifts in the demand patterns across different subsegments and regions
- Identifying and profiling key market players in the catalyst fertilizers market on the basis of the following:
- Product/Service offering
- Business strategies
- Strengths, weaknesses, opportunities, and threats
- Key financials
- Understanding the competitive landscape for a comparative analysis of market leaders and identifying the key market shareholders across the industry
- Analyzing regulatory frameworks across regions and their impact on prominent market players
- Providing insights on key investments in technology innovations and technology
Available Customizations
With the given market data, MarketsandMarkets offers customizations according to the company�s specific scientific needs.
The following customization options are available for the report:
Regional Analysis
- Further breakdown of the Rest of European market for catalyst fertilizers into Ukraine, France, and Germany
- Further breakdown of the Rest of Asia Pacific market for catalyst fertilizers into Malaysia, Australia, Vietnam, and Japan
- Further breakdown of the Rest of South American market for catalyst fertilizers into Colombia, Chile, and Venezuela
Company Information
- Detailed analyses and profiling of additional market players (up to five)


Growth opportunities and latent adjacency in Catalyst Fertilizers Market