Cloud-native Application Protection Platform (CNAPP) Market

Cloud-native Application Protection Platform (CNAPP) Market by Offering (Platform, Professional Services), Cloud Type (Public Cloud, Hybrid Cloud), Organization Size, Vertical (BFSI, Healthcare, IT and ITeS) and Region - Global Forecast to 2027

Report Code: TC 8524 Dec, 2022, by marketsandmarkets.com

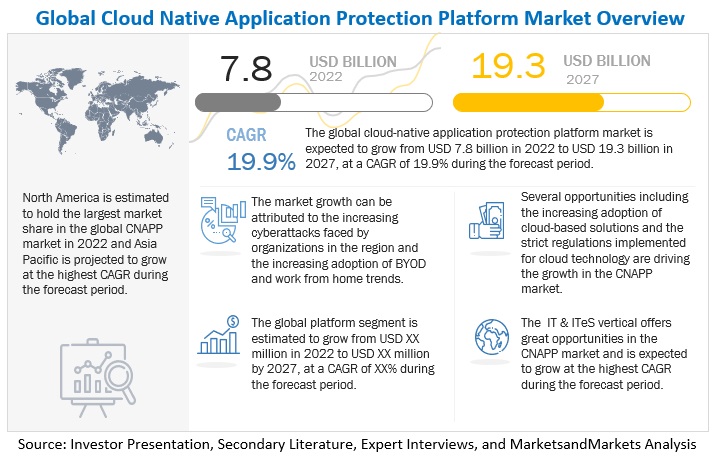
[208 Pages Report] The global CNAPP market is projected to grow from an estimated values of USD 7.8 billion in 2022 to USD 19.3 billion by 2027, at a Compound Annual Growth Rate (CAGR) of 19.9 % from 2022 to 2027. There has been an increase in cyber threats in the recent years. This factor is expected to contribute to the growth of the CNAPP market. There is a significant demand for CNAPP across verticals, such as BFSI, healthcare, retail and e-commerce, telecommunication, and others.
Cloud-native Application Protection Platform (CNAPP) Market

To know about the assumptions considered for the study, Request for Free Sample Report

Cloud-Native Application Protection Platform Market Dynamics

Driver: Adoption of BYOD and remote work options among SMEs

Organizations utilizing the BYOD concept with cloud-based systems enable employees to work remotely while using the office network. With the increasing popularity of public cloud offerings and BYOD policies, enterprises are eventually moving to the cloud deployment model. Organizations are rapidly adopting BYOD and work-from-home initiatives. Remote work helps companies avoid loss of productivity and protects public health. The health and economic crisis related to the COVID-19 pandemic and the required physical distancing measures force many firms to introduce work-from-home on a large scale. This may further catalyze wider adoption of teleworking practices after the crisis, with a wide range of impacts and uncertain net effects on productivity and other indicators. Cloud technologies help implement the work-from-home trend effectively. Also, a significant portion of SMEs is adopting the BYOD trend to reduce initial infrastructure expenses. Such high dependence on the BYOD and WFH trends urges organizations to secure their office cloud servers to enhance their security and maintain business continuity. This factor has enhanced the adoption of CNAPP solutions.

Restraint: Limited skilled expertise to implement and maintain CNAPP

The implementation and maintenance of CNAPP solutions require the necessary technical skills and knowledge. However, in recent years, organizations have been hiring security executives that lack the required expertise and knowledge. According to a report by Forbes in 2020, The Cloud Talent Drought Continues, advanced cloud and security skills are in higher demand than ever before; however, there is a significant lack of qualified, skilled professionals to support this movement, especially in non-tech-related industries. During the talent drought within the IT market that is affecting enterprise organizations, causing competitive disadvantages, security issues, and compliance risk, the pandemic has further accelerated the demand. According to the Challenges in Cloud Transformation report by Logic works in 2020, 86% of IT leaders thought a shortage of cloud talent would slow down cloud projects in 2020. According to an article by the Wall Street Journal in 2021, between 2017 and 2020, the annual postings of cloud jobs grew more than 90%, which is four times the rate of tech job growth overall in the same period, according to labor and economics research firm Emsi. The growing demand and lack of skilled professionals in the cloud technology sector is a restraint in deploying CNAPP solutions.

Opportunity: Increase in use of cloud-based solutions

Cloud-based solutions are increasingly being deployed across verticals. Cloud-based solutions support more efficient working and enable emerging capabilities in machine learning and artificial intelligence. Traditional security tools and approaches were designed to protect on-premises data centers and endpoints, not cloud-native apps and services. With the shift to cloud technologies, security teams need to be able to identify security issues and vulnerabilities early in development, speed up remediation and provide consistent security. According to the Flexera 2022 State of the Cloud Report, 57% of organizations are migrating more workloads to the cloud. The consumption of cloud, whether public, private, or a hybrid approach, continued to expand across all industry verticals and disrupt the ways in which IT provisions, manages, and orchestrates resources. In 2022, 53% of small and medium-sized businesses are now spending over USD 1.2 million annually, up from 38% in 2021. CNAPP provides an integrated set of security and compliance capabilities to secure cloud-native applications across development and production. Factors like cost optimization, flexible computing power, and lower cost are contributing to the increase in the use of cloud-based solutions, thus also driving the use of CNAPP solutions.

Challenge: Complexities in use of CNAPP solutions

In recent years, there has been a significant shift to the use of cloud services, which has given organizations unprecedented flexibility and scalability, enabling them to move forward with digital transformation efforts. For some organizations, it has also led to complex strategies in the deployment of the cloud. The reliance on multiple cloud vendors to run the entire IT infrastructure and the multiple/hybrid cloud strategy can result in complexities and challenges. This has also resulted in increased complexity in deploying CNAPP solutions. As cloud environments become more complex, the challenge of protecting data and applications in the cloud is even greater, and the controlling costs can also increase. As microservices expand with the increase in cloud services, the complexity of managing them also increases. Moreover, the cloud models are available in various service models such as Software-as-a-Service, Platform-as-a-Service, and Infrastructure-as-a-Service. Organizations face a crucial challenge when selecting the right infrastructure to deploy cloud security solutions as per the requirements. The more complex a cloud strategy becomes, the more difficult it becomes to determine the return on investment from the various services in use and to deploy the CNAPP solutions.

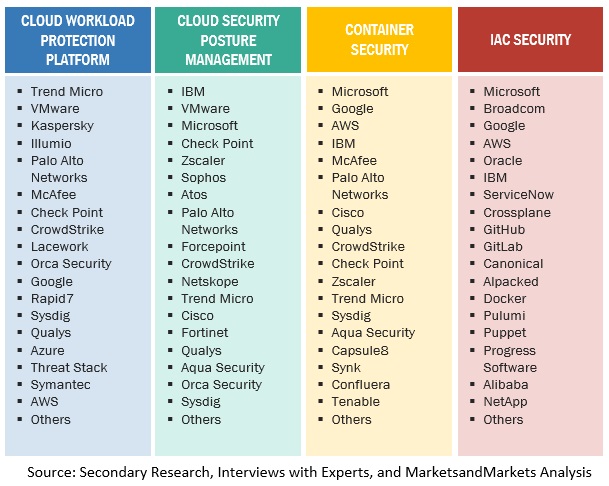
Cloud-native Application Protection Platform Market Ecosystem
Cloud-native Application Protection Platform (CNAPP) Market

To know about the assumptions considered for the study, download the pdf brochure

By offering, platform to grow at a higher CAGR during the forecast period

A CNAPP is an all-in-one cloud native software that simplifies monitoring, detecting, and acting on potential cloud security threats and vulnerabilities. CNAPP combines multiple tools and capabilities into a single software solution, minimizing complexity. CNAPP offers end-to-end cloud and application security throughout the CI/CD application lifecycle, from development to production. A CNAPP typically includes many tools to help scan and protect the cloud infrastructure and services. CNAPP solutions provide cloud application security tools, with the features added being vendor specific. Some of the CNAPP features include Cloud Security Posture Management (CSPM), Infrastructure-as-Code (IaC) Scanning, Cloud Workload Protection Platform (CWPP), and Cloud Infrastructure Entitlement Management (CIEM). The benefits of CNAPP include preventing cybersecurity threats by decreasing the number of cloud misconfigurations, providing combined and unique visibility of risks, allowing for prompt response to threats, and reducing complexity by eliminating the need to run and maintain multiple cloud security tools.

By organization size, large enterprises to hold a larger market size during the forecast period

Large enterprises are increasingly adopting CNAPP platform and the related professional services. The large enterprises have increasingly started deploying cloud-based solutions over on-premises solutions. The Covid-19 pandemic has accelerated the adoption of the BYOD and work from home trend, which has increased risks with the usage of cloud based solutions. This factor has led to market growth in the use of CNAPP. Large enterprises deploy cloud-based solutions due to high flexibility, and low maintenance costs. As businesses are moving towards using cloud for storing information, the requirement for CNAPP is also increasing. The increasing cyberattacks faced by large organizations is prompting them to adopt CNAPP platform and the associated services. For example, in the CNAPP market, Fortinet provides FortiCNP. FortiCNP simplifies cloud security operations and enables security teams to take actions by utilizing deep integrations with a broad range of cloud security products, services, and technologies.

By vertical, BFSI to hold a larger market size during the forecast period

The financial institutions are increasingly deploying cloud based solutions because of more convenience and reduced maintenance costs. Cloud deployment provides increased flexibility. The total costs of usage are reduced while using cloud based solutions as the costs related to deployment and maintenance is lesser than the on-premises counterparts. The pandemic has further prompted organizations to shift their data storage to the cloud environment. There is a growing need for security solutions in the BFSI industry to combat the growing physical and cyberattacks on the critical infrastructures that are taking place due to the increasing adoption of BYOD and Work from Home (WFH) trends. Additionally, financial institutions need to be compliant with several regulations and laws, including the PIPEDA and PCI DSS. This has further contributed to the growing use of CNAPP. CNAPP is a requirement by financial institutions to secure cloud resources and thus CNAPP has a significant application in the BFSI industry.

By region, North America to account for the largest market size during the forecast period
Cloud-native Application Protection Platform (CNAPP) Market Size, and Share

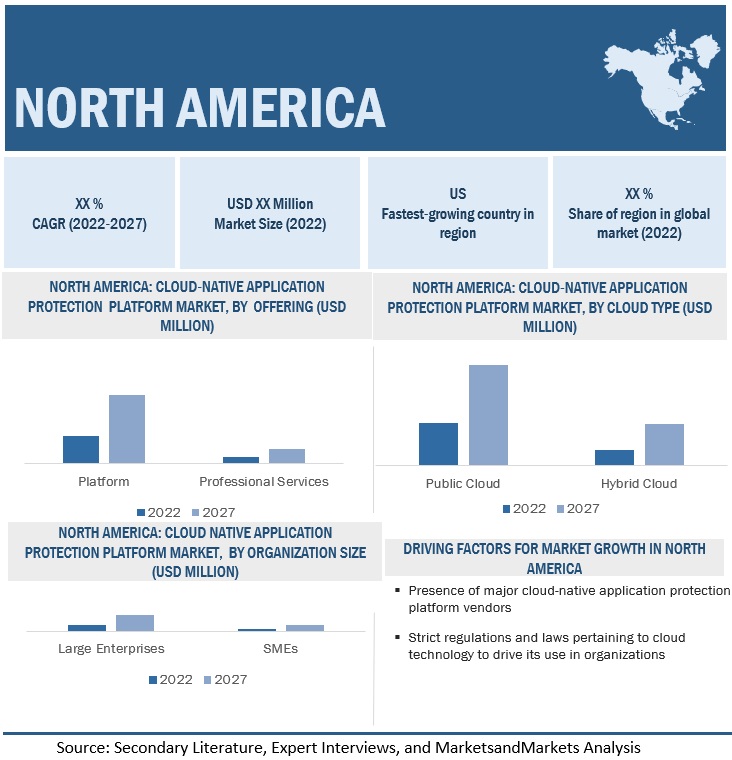
North America is expected to be the largest contributor to the global CNAPP market in terms of market share. It is one of the most advanced regions regarding security technology adoption and infrastructure. The region has recently experienced increasing digitalization and cloud technology adoption. IT spending on system infrastructure is slowly shifting from traditional solutions to cloud. Organizations are rapidly using cloud services for new initiatives or to replace existing systems. The regional presence of key industry players offering CNAPP contributes to driving the market growth in North America. The increasing cyberattacks witnessed in the region contribute to the growth of the CNAPP market in the region. According to the Internet Crime Report 2021 by the FBI, IC3 continued to receive a record number of complaints from the American public; 8,47,376 complaints were reported during the year, which was a 7% increase from 2020, with potential losses exceeding USD 6.9 billion. The strengthening of safety standards and regulations is another factor contributing to the growth of the CNAPP market in the region. The Cybersecurity and Infrastructure Security Agency (CISA) leads the national effort to understand, manage, and reduce cyber and physical infrastructure risks. It helps connect industry and government stakeholders with resources, analyses, and tools to help them build cyber, communications, physical security, and resilience. The PIPEDA applies to private sector organizations across Canada that collect, use, or disclose personal information during commercial activity. Organizations covered by the PIPEDA must generally obtain an individual’s consent when they collect, use, or disclose that individual’s personal information. People have the right to access their personal information held by an organization. The countries analyzed in the North America region include the US and Canada.

Key Market Players

The major vendors in the CNAPP market include Check Point (Israel), Trend Micro (Japan), Palo Alto Networks (US), CrowdStrike (US), Fortinet (US), Forcepoint (US), Proofpoint (US), Radware (Israel), Zscaler (US), Sophos (UK), Aqua Security (Israel), Cequence Security (US), Illumio (US), Runecast (UK), Data Theorem (US), MetaSecure (US), Tigera (US), Orca Security (US), Skyhigh Security (US), Caveonix (US), Wiz.io (US), Ermetic (US), Banyan Cloud (US), and Accuknox (US).

Get online access to the report on the World's First Market Intelligence Cloud

  • Easy to Download Historical Data & Forecast Numbers
  • Company Analysis Dashboard for high growth potential opportunities
  • Research Analyst Access for customization & queries
  • Competitor Analysis with Interactive dashboard
  • Latest News, Updates & Trend analysis
Request Sample

Scope of the Report

Report Metrics

Details

Market size available for years 2020–2027
Base year considered 2021
Forecast period 2022–2027
Forecast units Value (USD Million/ Billion)
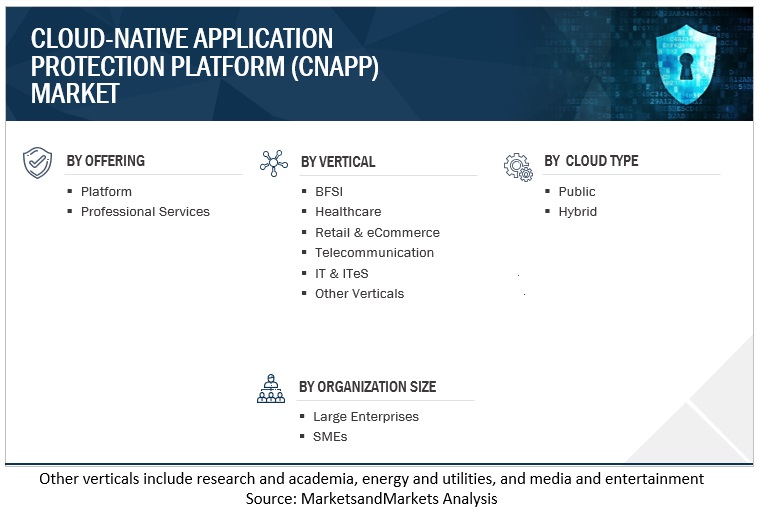
Segments covered Offering, Cloud Type, Organization Size, Vertical, and Region
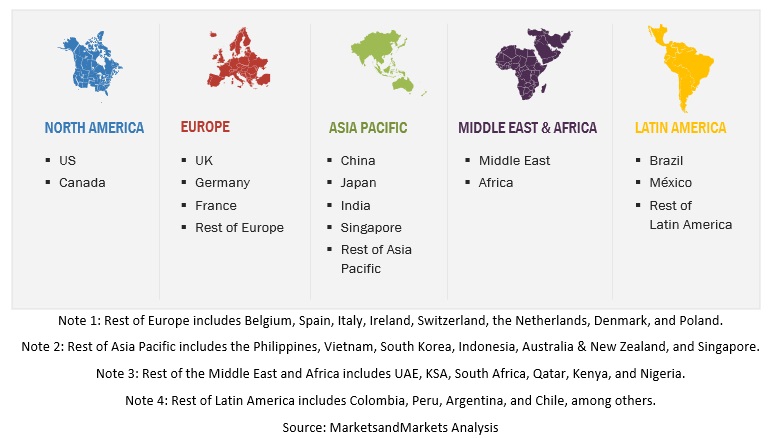
Geographies covered North America, Europe, Asia Pacific, Middle East and Africa, and Latin America
Major companies covered Check Point (Israel), Trend Micro (Japan), Palo Alto Networks (US), CrowdStrike (US), Fortinet (US), Forcepoint (US), Proofpoint (US), Radware (Israel), Zscaler (US), Sophos (UK), Aqua Security (Israel), Cequence Security (US), Illumio (US), Runecast (UK), Data Theorem (US), MetaSecure (US), Tigera (US), Orca Security (US), Skyhigh Security (US), Caveonix (US), Wiz.io (US), Ermetic (US), Banyan Cloud (US), and AccuKnox (US)

Market Segmentation

Cloud-native Application Protection Platform (CNAPP) Market Size, and Share

Cloud-native Application Protection Platform (CNAPP) Market Size, and Share

Recent Developments

  • In June 2022, Zscaler announced the launch of its Posture Control solution designed to give organizations unified CNAPP functionality to secure cloud workloads. Integrated into the Zscaler Zero Trust Exchange, the Posture Control solution enables DevOps and security teams to efficiently prioritize and remediate risks in cloud-native applications earlier in the development lifecycle. The solution correlates and prioritizes risks, such as unpatched vulnerabilities in containers and VMs, excessive entitlements and permissions, and cloud service misconfigurations.
  • In September 2022, Zscaler announced the acquisition of ShiftRight, a leader in closed-loop security workflow automation. ShiftRight’s workflow automation technology is integrated into the Zscaler Zero Trust Exchange cloud security platform to automate security management for the growing influx of risks and incidents.
  • In March 2022, Radware announced that it is expanding its partnership with Presidio, a global digital services and solutions provider that accelerates business transformation through security technology modernization. To protect its customers in on-premises, cloud, or hybrid environments, Presidio is adding Radware’s application and API security solutions, bot manager, DDoS protection, and Cloud Native Protector to its cybersecurity suite.

Frequently Asked Questions (FAQ):

To speak to our analyst for a discussion on the above findings, click Speak to Analyst

TABLE OF CONTENTS
 
1 INTRODUCTION (Page No. - 22)
    1.1 STUDY OBJECTIVES 
    1.2 MARKET DEFINITION 
           1.2.1 INCLUSIONS AND EXCLUSIONS
    1.3 MARKET SCOPE 
           1.3.1 MARKET SEGMENTATION
           1.3.2 REGIONS COVERED
    1.4 YEARS CONSIDERED 
    1.5 CURRENCY CONSIDERED 
           TABLE 1 USD EXCHANGE RATES, 2020–2021
    1.6 STAKEHOLDERS 
 
2 RESEARCH METHODOLOGY (Page No. - 27)
    2.1 RESEARCH DATA 
           FIGURE 1 CLOUD-NATIVE APPLICATION PROTECTION PLATFORM MARKET: RESEARCH DESIGN
           2.1.1 SECONDARY DATA
           2.1.2 PRIMARY DATA
                    2.1.2.1 Breakup of primary profiles
                    2.1.2.2 Key industry insights
    2.2 DATA TRIANGULATION 
           FIGURE 2 MARKET: DATA TRIANGULATION
    2.3 MARKET SIZE ESTIMATION 
           2.3.1 TOP-DOWN APPROACH
           2.3.2 BOTTOM-UP APPROACH
                    FIGURE 3 MARKET SIZE ESTIMATION METHODOLOGY—APPROACH 1 (SUPPLY SIDE): REVENUE FROM SOFTWARE/SERVICES OF CNAPP VENDORS
                    FIGURE 4 MARKET SIZE ESTIMATION METHODOLOGY: APPROACH 1 (SUPPLY SIDE) ANALYSIS
                    FIGURE 5 MARKET ESTIMATION APPROACH: RESEARCH FLOW
                    FIGURE 6 MARKET SIZE ESTIMATION METHODOLOGY: APPROACH 2, BOTTOM-UP (DEMAND SIDE): PRODUCTS/SOLUTIONS/SERVICES
    2.4 MARKET FORECAST 
           TABLE 2 FACTOR ANALYSIS
    2.5 COMPANY EVALUATION QUADRANT METHODOLOGY 
           FIGURE 7 COMPANY EVALUATION QUADRANT: CRITERIA WEIGHTAGE
    2.6 EVALUATION QUADRANT METHODOLOGY FOR STARTUPS 
           FIGURE 8 EVALUATION QUADRANT FOR STARTUPS: CRITERIA WEIGHTAGE
    2.7 ASSUMPTIONS 
    2.8 LIMITATIONS 
           FIGURE 9 MARKET: LIMITATIONS
 
3 EXECUTIVE SUMMARY (Page No. - 40)
    FIGURE 10 GLOBAL MARKET TO WITNESS SIGNIFICANT GROWTH DURING FORECAST PERIOD 
    FIGURE 11 CNAPP MARKET: SEGMENTS SNAPSHOT 
    FIGURE 12 CLOUD-NATIVE APPLICATION PROTECTION PLATFORM MARKET: REGIONAL SNAPSHOT 
 
4 PREMIUM INSIGHTS (Page No. - 43)
    4.1 ATTRACTIVE OPPORTUNITIES FOR KEY PLAYERS IN MARKET 
           FIGURE 13 INCREASED SECURITY BREACHES AND SOPHISTICATED CYBERATTACKS TO DRIVE MARKET
    4.2 MARKET, BY OFFERING, 2022–2027 
           FIGURE 14 PLATFORM SEGMENT TO HOLD LARGER MARKET SIZE DURING FORECAST PERIOD
    4.3 MARKET, BY CLOUD TYPE, 2022–2027 
           FIGURE 15 PUBLIC CLOUD SEGMENT TO HOLD LARGER MARKET SIZE DURING FORECAST PERIOD
    4.4 MARKET, BY ORGANIZATION SIZE, 2022–2027 
           FIGURE 16 LARGE ENTERPRISES SEGMENT TO HOLD LARGER MARKET SIZE DURING FORECAST PERIOD
    4.5 MARKET, BY VERTICAL, 2022–2027 
           FIGURE 17 BFSI VERTICAL TO HOLD LARGEST MARKET SIZE DURING FORECAST PERIOD
    4.6 MARKET INVESTMENT SCENARIO 
           FIGURE 18 ASIA PACIFIC TO EMERGE AS BEST MARKET FOR INVESTMENTS IN NEXT FIVE YEARS
 
5 MARKET OVERVIEW AND INDUSTRY TRENDS (Page No. - 47)
    5.1 INTRODUCTION 
    5.2 MARKET DYNAMICS 
           FIGURE 19 CLOUD-NATIVE APPLICATION PROTECTION PLATFORM MARKET: DRIVERS, RESTRAINTS, OPPORTUNITIES, AND CHALLENGES
           5.2.1 DRIVERS
                    5.2.1.1 Increase in cyber threats
                    5.2.1.2 Adoption of BYOD and remote work options among SMEs
           5.2.2 RESTRAINTS
                    5.2.2.1 Limited skilled expertise to implement and maintain CNAPP
                    5.2.2.2 Adhering to changing regulations
           5.2.3 OPPORTUNITIES
                    5.2.3.1 Rise in initiatives in cloud infrastructure projects by government
                    5.2.3.2 Increase in use of cloud-based solutions
           5.2.4 CHALLENGES
                    5.2.4.1 Complexities in use of CNAPP solutions
    5.3 ECOSYSTEM MAPPING 
           FIGURE 20 ECOSYSTEM: MARKET
           TABLE 3 CLOUD-NATIVE APPLICATION PROTECTION PLATFORM MARKET: ECOSYSTEM
    5.4 TECHNOLOGY ANALYSIS 
           5.4.1 AI/ML AND CLOUD-NATIVE APPLICATION PROTECTION PLATFORM
           5.4.2 BIG DATA ANALYTICS AND CLOUD-NATIVE APPLICATION PROTECTION PLATFORM
           5.4.3 IOT AND CLOUD-NATIVE APPLICATION PROTECTION PLATFORM
           5.4.4 DEVSECOPS AND CLOUD-NATIVE APPLICATION PROTECTION PLATFORM
    5.5 REGULATORY IMPLICATIONS 
           5.5.1 PAYMENT CARD INDUSTRY DATA SECURITY STANDARD
           5.5.2 GENERAL DATA PROTECTION REGULATION
           5.5.3 CALIFORNIA CONSUMER PRIVACY ACT
           5.5.4 PERSONAL INFORMATION PROTECTION AND ELECTRONIC DOCUMENTS ACT
           5.5.5 HEALTH INSURANCE PORTABILITY AND ACCOUNTABILITY ACT
           5.5.6 INTERNATIONAL ORGANIZATION FOR STANDARDIZATION STANDARD 27001
           5.5.7 REGULATORY BODIES, GOVERNMENT AGENCIES, AND OTHER ORGANIZATIONS
                    TABLE 4 LIST OF REGULATORY BODIES, GOVERNMENT AGENCIES, AND OTHER ORGANIZATIONS
    5.6 PATENT ANALYSIS 
           FIGURE 21 PATENT ANALYSIS: CLOUD-NATIVE APPLICATION PROTECTION PLATFORM MARKET
    5.7 SUPPLY CHAIN ANALYSIS 
           FIGURE 22 SUPPLY CHAIN: CNAPP MARKET
           5.7.1 CNAPP PLATFORM PROVIDERS
           5.7.2 CNAPP SERVICE PROVIDERS
           5.7.3 RETAIL/DISTRIBUTION
           5.7.4 END USERS
    5.8 PORTER’S FIVE FORCES ANALYSIS 
           FIGURE 23 MARKET: PORTER’S FIVE FORCE ANALYSIS
           TABLE 5 IMPACT OF PORTER’S FIVE FORCES ON CLOUD-NATIVE APPLICATION PROTECTION PLATFORM MARKET
           5.8.1 THREAT FROM NEW ENTRANTS
           5.8.2 THREAT FROM SUBSTITUTES
           5.8.3 BARGAINING POWER OF SUPPLIERS
           5.8.4 BARGAINING POWER OF BUYERS
           5.8.5 RIVALRY AMONG EXISTING COMPETITORS
    5.9 USE CASES 
           5.9.1 SKEDULO INTEGRATES COMPREHENSIVE CLOUD SECURITY TO GAIN BUSINESS VALUE
           5.9.2 CUEBIQ IMPLEMENTS DEVSECOPS AT SCALE WITH PRISMA CLOUD
           5.9.3 BLACKSTONE TACKLES ADVANCED CLOUD-NATIVE SECURITY WITH WIZ
    5.10 PRICING ANALYSIS 
           TABLE 6 AVERAGE SELLING PRICE/PRICING MODEL: MARKET
           5.10.1 AVERAGE SELLING PRICE TREND
                    TABLE 7 CLOUD-NATIVE APPLICATION PROTECTION PLATFORM MARKET: APPLICATION PRICES
    5.11 TRENDS AND DISRUPTIONS IMPACTING CUSTOMERS 
                    FIGURE 24 MARKET: TRENDS AND DISRUPTIONS IMPACTING CUSTOMERS
    5.12 KEY STAKEHOLDERS AND BUYING CRITERIA 
           5.12.1 KEY STAKEHOLDERS IN BUYING PROCESS
                    FIGURE 25 INFLUENCE OF STAKEHOLDERS IN BUYING PROCESS
                    TABLE 8 INFLUENCE OF STAKEHOLDERS IN BUYING PROCESS
    5.13 KEY CONFERENCES AND EVENTS 
                    TABLE 9 CONFERENCES AND EVENTS, 2022–2023
 
6 CLOUD-NATIVE APPLICATION PROTECTION PLATFORM MARKET, BY OFFERING  (Page No. - 67 )
    6.1 INTRODUCTION 
           FIGURE 26 PLATFORM SEGMENT TO GROW AT HIGHER CAGR DURING FORECAST PERIOD
           TABLE 10 MARKET, BY OFFERING, 2020–2027 (USD MILLION)
    6.2 PLATFORM 
           6.2.1 PLATFORM DEPLOYED BY ORGANIZATIONS HELPS MITIGATE CYBER THREATS
           6.2.2 PLATFORM: MARKET DRIVERS
                    TABLE 11 PLATFORM: MARKET, BY REGION, 2020–2027 (USD MILLION)
    6.3 PROFESSIONAL SERVICES 
           6.3.1 PROFESSIONAL SERVICES USED BY ORGANIZATIONS ENABLE DEPLOYMENT OF CNAPP
           6.3.2 PROFESSIONAL SERVICES: MARKET DRIVERS
                    TABLE 12 PROFESSIONAL SERVICES: MARKET, BY REGION, 2020–2027 (USD MILLION)
 
7 CLOUD-NATIVE APPLICATION PROTECTION PLATFORM MARKET, BY CLOUD TYPE (Page No. - 71)
    7.1 INTRODUCTION 
           FIGURE 27 HYBRID CLOUD TO REGISTER HIGHER CAGR DURING FORECAST PERIOD
           TABLE 13 MARKET, BY CLOUD TYPE, 2020–2027 (USD MILLION)
    7.2 PUBLIC CLOUD 
           7.2.1 LOW MAINTENANCE COSTS AND INCREASED SCALABILITY
           7.2.2 PUBLIC CLOUD: MARKET DRIVERS
                    TABLE 14 PUBLIC CLOUD: MARKET, BY REGION, 2020–2027 (USD MILLION)
    7.3 HYBRID CLOUD 
           7.3.1 SCALABLE PRICING AND INCREASED SECURITY
           7.3.2 HYBRID CLOUD: MARKET DRIVERS
                    TABLE 15 HYBRID CLOUD: MARKET, BY REGION 2020–2027 (USD MILLION)
 
8 CLOUD-NATIVE APPLICATION PROTECTION PLATFORM MARKET, BY ORGANIZATION SIZE (Page No. - 75)
    8.1 INTRODUCTION 
           FIGURE 28 SMALL AND MEDIUM-SIZED ENTERPRISES TO REGISTER HIGHER CAGR DURING FORECAST PERIOD
           TABLE 16 MARKET, BY ORGANIZATION SIZE, 2020–2027 (USD MILLION)
    8.2 LARGE ENTERPRISES 
           8.2.1 INCREASING CYBER THREATS BOOST MARKET
           8.2.2 LARGE ENTERPRISES: MARKET DRIVERS
                    TABLE 17 LARGE ENTERPRISES: MARKET, BY REGION, 2020–2027 (USD MILLION)
    8.3 SMALL AND MEDIUM-SIZED ENTERPRISES 
           8.3.1 DEPLOYMENT OF CNAPP TO PROVIDE ENHANCED CUSTOMER EXPERIENCE
           8.3.2 SMALL AND MEDIUM-SIZED ENTERPRISES: MARKET DRIVERS
                    TABLE 18 SMALL AND MEDIUM-SIZED ENTERPRISES: MARKET, BY REGION, 2020–2027(USD MILLION)
 
9 CLOUD-NATIVE APPLICATION PROTECTION PLATFORM MARKET, BY VERTICAL (Page No. - 79)
    9.1 INTRODUCTION 
           FIGURE 29 IT AND ITES VERTICAL TO REGISTER HIGHEST CAGR DURING FORECAST PERIOD
           TABLE 19 MARKET, BY VERTICAL, 2020–2027 (USD MILLION)
    9.2 BANKING, FINANCIAL SERVICES, AND INSURANCE 
           9.2.1 ENHANCING SECURITY POSTURE AND COMPLIANCE WITH REGULATIONS
           9.2.2 BANKING, FINANCIAL SERVICES, AND INSURANCE: MARKET DRIVERS
                    TABLE 20 BANKING, FINANCIAL SERVICES, AND INSURANCE: PLATFORM MARKET, BY REGION, 2020–2027 (USD MILLION)
    9.3 HEALTHCARE 
           9.3.1 COMPLIANCE WITH REGULATIONS AND MITIGATING CYBERATTACKS
           9.3.2 HEALTHCARE: MARKET DRIVERS
                    TABLE 21 HEALTHCARE: MARKET, BY REGION, 2020–2027 (USD MILLION)
    9.4 RETAIL AND ECOMMERCE 
           9.4.1 INCREASING DIGITALIZATION AND STRINGENT REGULATIONS BOOST MARKET
           9.4.2 RETAIL AND ECOMMERCE: CLOUD-NATIVE APPLICATION PROTECTION PLATFORM MARKET DRIVERS
                    TABLE 22 RETAIL AND ECOMMERCE: MARKET, BY REGION, 2020–2027 (USD MILLION)
    9.5 TELECOMMUNICATION 
           9.5.1 INCREASING ADOPTION OF DIGITAL TECHNOLOGIES PROPELS MARKET GROWTH
           9.5.2 TELECOMMUNICATION: MARKET DRIVERS
                    TABLE 23 TELECOMMUNICATION: MARKET, BY REGION, 2020–2027 (USD MILLION)
    9.6 IT AND ITES 
           9.6.1 INCREASING CYBERATTACKS BOOST MARKET
           9.6.2 IT AND ITES: MARKET DRIVERS
                    TABLE 24 IT AND ITES: MARKET, BY REGION, 2020–2027 (USD MILLION)
    9.7 OTHER VERTICALS 
           9.7.1 OTHER VERTICALS: MARKET DRIVERS
 
10 CLOUD-NATIVE APPLICATION PROTECTION PLATFORM MARKET, BY REGION (Page No. - 87)
     10.1 INTRODUCTION 
               FIGURE 30 ASIA PACIFIC TO GROW AT HIGHEST CAGR DURING FORECAST PERIOD
               TABLE 25 MARKET, BY REGION, 2020–2027 (USD MILLION)
     10.2 NORTH AMERICA 
             10.2.1 NORTH AMERICA: MARKET DRIVERS
             10.2.2 NORTH AMERICA: REGULATORY LANDSCAPE
                       FIGURE 31 NORTH AMERICA: MARKET SNAPSHOT
                       TABLE 26 NORTH AMERICA: CLOUD-NATIVE APPLICATION PROTECTION PLATFORM MARKET, BY OFFERING, 2020–2027 (USD MILLION)
                       TABLE 27 NORTH AMERICA: MARKET, BY CLOUD TYPE, 2020–2027 (USD MILLION)
                       TABLE 28 NORTH AMERICA: MARKET, BY ORGANIZATION SIZE, 2020–2027 (USD MILLION)
                       TABLE 29 NORTH AMERICA: MARKET, BY VERTICAL, 2020–2027 (USD MILLION)
                       TABLE 30 NORTH AMERICA: MARKET, BY COUNTRY, 2020–2027 (USD MILLION)
             10.2.3 US
                       10.2.3.1 Large number of CNAPP vendors and strict regulations implemented
                                   TABLE 31 US: MARKET, BY OFFERING, 2020–2027 (USD MILLION)
                                   TABLE 32 US: MARKET, BY CLOUD TYPE, 2020–2027 (USD MILLION)
                                   TABLE 33 US: MARKET, BY ORGANIZATION SIZE, 2020–2027 (USD MILLION)
                                   TABLE 34 US: MARKET, BY VERTICAL, 2020–2027 (USD MILLION)
             10.2.4 CANADA
                       10.2.4.1 Increasing digitalization and strict regulations
                                   TABLE 35 CANADA: CLOUD-NATIVE APPLICATION PROTECTION PLATFORM MARKET, BY OFFERING, 2020–2027 (USD MILLION)
                                   TABLE 36 CANADA: MARKET, BY CLOUD TYPE, 2020–2027 (USD MILLION)
                                   TABLE 37 CANADA: MARKET, BY ORGANIZATION SIZE, 2020–2027 (USD MILLION)
                                   TABLE 38 CANADA: MARKET, BY VERTICAL, 2020–2027 (USD MILLION)
     10.3 EUROPE 
             10.3.1 EUROPE: MARKET DRIVERS
             10.3.2 EUROPE: REGULATORY LANDSCAPE
                       TABLE 39 EUROPE: MARKET, BY OFFERING, 2020–2027 (USD MILLION)
                       TABLE 40 EUROPE: MARKET, BY CLOUD TYPE, 2020–2027 (USD MILLION)
                       TABLE 41 EUROPE: MARKET, BY ORGANIZATION SIZE, 2020–2027 (USD MILLION)
                       TABLE 42 EUROPE: MARKET, BY VERTICAL, 2020–2027 (USD MILLION)
                       TABLE 43 EUROPE: MARKET, BY COUNTRY, 2020–2027 (USD MILLION)
             10.3.3 UK
                       10.3.3.1 Increasing use of cloud technology by government and enterprises
                                   TABLE 44 UK: CLOUD-NATIVE APPLICATION PROTECTION PLATFORM MARKET, BY OFFERING, 2020–2027 (USD MILLION)
                                   TABLE 45 UK: MARKET, BY CLOUD TYPE, 2020–2027 (USD MILLION)
                                   TABLE 46 UK: MARKET, BY ORGANIZATION SIZE, 2020–2027 (USD MILLION)
                                   TABLE 47 UK: MARKET, BY VERTICAL, 2020–2027 (USD MILLION)
             10.3.4 GERMANY
                       10.3.4.1 Increasing digitalization and cyberattacks
                                   TABLE 48 GERMANY: MARKET, BY OFFERING, 2020–2027 (USD MILLION)
                                   TABLE 49 GERMANY: MARKET, BY CLOUD TYPE, 2020–2027 (USD MILLION)
                                   TABLE 50 GERMANY: MARKET, BY ORGANIZATION SIZE, 2020–2027 (USD MILLION)
                                   TABLE 51 GERMANY: MARKET, BY VERTICAL, 2020–2027 (USD MILLION)
             10.3.5 FRANCE
                       10.3.5.1 Increasing rate of cybercrimes boosts market
                                   TABLE 52 FRANCE: CLOUD-NATIVE APPLICATION PROTECTION PLATFORM MARKET, BY OFFERING, 2020–2027 (USD MILLION)
                                   TABLE 53 FRANCE: MARKET, BY CLOUD TYPE, 2020–2027 (USD MILLION)
                                   TABLE 54 FRANCE: MARKET, BY ORGANIZATION SIZE, 2020–2027 (USD MILLION)
                                   TABLE 55 FRANCE: MARKET, BY VERTICAL, 2020–2027 (USD MILLION)
             10.3.6 REST OF EUROPE
                       TABLE 56 REST OF EUROPE: MARKET, BY OFFERING, 2020–2027 (USD MILLION)
                       TABLE 57 REST OF EUROPE: MARKET, BY CLOUD TYPE, 2020–2027 (USD MILLION)
                       TABLE 58 REST OF EUROPE: MARKET, BY ORGANIZATION SIZE, 2020–2027 (USD MILLION)
                       TABLE 59 REST OF EUROPE: MARKET, BY VERTICAL, 2020–2027 (USD MILLION)
     10.4 ASIA PACIFIC 
             10.4.1 ASIA PACIFIC: MARKET DRIVERS
             10.4.2 ASIA PACIFIC: REGULATORY LANDSCAPE
                       FIGURE 32 ASIA PACIFIC: MARKET SNAPSHOT
                       TABLE 60 ASIA PACIFIC: CLOUD-NATIVE APPLICATION PROTECTION PLATFORM MARKET, BY OFFERING, 2020–2027 (USD MILLION)
                       TABLE 61 ASIA PACIFIC: MARKET, BY CLOUD TYPE, 2020–2027 (USD MILLION)
                       TABLE 62 ASIA PACIFIC: MARKET, BY ORGANIZATION SIZE, 2020–2027 (USD MILLION)
                       TABLE 63 ASIA PACIFIC: MARKET, BY VERTICAL, 2020–2027 (USD MILLION)
                       TABLE 64 ASIA PACIFIC: MARKET, BY COUNTRY, 2020–2027 (USD MILLION)
             10.4.3 CHINA
                       10.4.3.1 Increasing adoption of cloud technology
                                   TABLE 65 CHINA: MARKET, BY OFFERING, 2020–2027 (USD MILLION)
                                   TABLE 66 CHINA: MARKET, BY CLOUD TYPE, 2020–2027 (USD MILLION)
                                   TABLE 67 CHINA: MARKET, BY ORGANIZATION SIZE, 2020–2027 (USD MILLION)
                                   TABLE 68 CHINA: MARKET, BY VERTICAL, 2020–2027 (USD MILLION)
             10.4.4 JAPAN
                       10.4.4.1 Government guidelines on use of cloud technology
                                   TABLE 69 JAPAN: CLOUD-NATIVE APPLICATION PROTECTION PLATFORM MARKET, BY OFFERING, 2020–2027 (USD MILLION)
                                   TABLE 70 JAPAN: MARKET, BY CLOUD TYPE, 2020–2027 (USD MILLION)
                                   TABLE 71 JAPAN: MARKET, BY ORGANIZATION SIZE, 2020–2027 (USD MILLION)
                                   TABLE 72 JAPAN: MARKET, BY VERTICAL, 2020–2027 (USD MILLION)
             10.4.5 INDIA
                       10.4.5.1 Growing adoption of cloud technology by SMEs
                                   TABLE 73 INDIA: MARKET, BY OFFERING, 2020–2027 (USD MILLION)
                                   TABLE 74 INDIA: MARKET, BY CLOUD TYPE, 2020–2027 (USD MILLION)
                                   TABLE 75 INDIA: MARKET, BY ORGANIZATION SIZE, 2020–2027 (USD MILLION)
                                   TABLE 76 INDIA: MARKET, BY VERTICAL, 2020–2027 (USD MILLION)
             10.4.6 SINGAPORE
                       10.4.6.1 Compliance with regulations and increasing use of cloud-based systems
                                   TABLE 77 SINGAPORE: CLOUD-NATIVE APPLICATION PROTECTION PLATFORM MARKET, BY OFFERING, 2020–2027 (USD MILLION)
                                   TABLE 78 SINGAPORE: MARKET, BY CLOUD TYPE, 2020–2027 (USD MILLION)
                                   TABLE 79 SINGAPORE: MARKET, BY ORGANIZATION SIZE, 2020–2027 (USD MILLION)
                                   TABLE 80 SINGAPORE: MARKET, BY VERTICAL, 2020–2027 (USD MILLION)
             10.4.7 REST OF ASIA PACIFIC
                       TABLE 81 REST OF ASIA PACIFIC: MARKET, BY OFFERING, 2020–2027 (USD MILLION)
                       TABLE 82 REST OF ASIA PACIFIC: MARKET, BY CLOUD TYPE, 2020–2027 (USD MILLION)
                       TABLE 83 REST OF ASIA PACIFIC: MARKET, BY ORGANIZATION SIZE, 2020–2027 (USD MILLION)
                       TABLE 84 REST OF ASIA PACIFIC: MARKET, BY VERTICAL, 2020–2027 (USD MILLION)
     10.5 MIDDLE EAST AND AFRICA 
             10.5.1 MIDDLE EAST AND AFRICA: MARKET DRIVERS
             10.5.2 MIDDLE EAST AND AFRICA: REGULATORY LANDSCAPE
                       TABLE 85 MIDDLE EAST AND AFRICA: CLOUD-NATIVE APPLICATION PROTECTION PLATFORM MARKET, BY OFFERING, 2020–2027 (USD MILLION)
                       TABLE 86 MIDDLE EAST AND AFRICA: MARKET, BY CLOUD TYPE, 2020–2027 (USD MILLION)
                       TABLE 87 MIDDLE EAST AND AFRICA: MARKET, BY ORGANIZATION SIZE, 2020–2027 (USD MILLION)
                       TABLE 88 MIDDLE EAST AND AFRICA: MARKET, BY VERTICAL, 2020–2027 (USD MILLION)
                       TABLE 89 MIDDLE EAST AND AFRICA: MARKET, BY COUNTRY, 2020–2027 (USD MILLION)
             10.5.3 MIDDLE EAST
                       10.5.3.1 Increasing digitalization initiatives
                                   TABLE 90 MIDDLE EAST: MARKET, BY OFFERING, 2020–2027 (USD MILLION)
                                   TABLE 91 MIDDLE EAST: MARKET, BY CLOUD TYPE, 2020–2027 (USD MILLION)
                                   TABLE 92 MIDDLE EAST: MARKET, BY ORGANIZATION SIZE, 2020–2027 (USD MILLION)
                                   TABLE 93 MIDDLE EAST: MARKET, BY VERTICAL, 2020–2027 (USD MILLION)
             10.5.4 AFRICA
                       10.5.4.1 Increasing efforts to create digital economy
                                   TABLE 94 AFRICA: CLOUD-NATIVE APPLICATION PROTECTION PLATFORM MARKET, BY OFFERING, 2020–2027 (USD MILLION)
                                   TABLE 95 AFRICA: MARKET, BY CLOUD TYPE, 2020–2027 (USD MILLION)
                                   TABLE 96 AFRICA: MARKET, BY ORGANIZATION SIZE, 2020–2027 (USD MILLION)
                                   TABLE 97 AFRICA: MARKET, BY VERTICAL, 2020–2027 (USD MILLION)
     10.6 LATIN AMERICA 
             10.6.1 LATIN AMERICA: MARKET DRIVERS
             10.6.2 LATIN AMERICA: REGULATORY LANDSCAPE
                       TABLE 98 LATIN AMERICA: MARKET, BY OFFERING, 2020–2027 (USD MILLION)
                       TABLE 99 LATIN AMERICA: MARKET, BY CLOUD TYPE, 2020–2027 (USD MILLION)
                       TABLE 100 LATIN AMERICA: MARKET, BY ORGANIZATION SIZE, 2020–2027 (USD MILLION)
                       TABLE 101 LATIN AMERICA: MARKET, BY VERTICAL, 2020–2027 (USD MILLION)
                       TABLE 102 LATIN AMERICA: MARKET, BY COUNTRY, 2020–2027 (USD MILLION)
             10.6.3 BRAZIL
                       10.6.3.1 Increasing cyberattacks and adoption of cloud-based systems
                                   TABLE 103 BRAZIL: CLOUD-NATIVE APPLICATION PROTECTION PLATFORM MARKET, BY OFFERING, 2020–2027 (USD MILLION)
                                   TABLE 104 BRAZIL: MARKET, BY CLOUD TYPE, 2020–2027 (USD MILLION)
                                   TABLE 105 BRAZIL: MARKET, BY ORGANIZATION SIZE, 2020–2027 (USD MILLION)
                                   TABLE 106 BRAZIL: MARKET, BY VERTICAL, 2020–2027 (USD MILLION)
             10.6.4 MEXICO
                       10.6.4.1 Growing opportunities for enterprises to adopt cloud technology
                                   TABLE 107 MEXICO: MARKET, BY OFFERING, 2020–2027 (USD MILLION)
                                   TABLE 108 MEXICO: MARKET, BY CLOUD TYPE, 2020–2027 (USD MILLION)
                                   TABLE 109 MEXICO: MARKET, BY ORGANIZATION SIZE, 2020–2027 (USD MILLION)
                                   TABLE 110 MEXICO: MARKET, BY VERTICAL, 2020–2027 (USD MILLION)
             10.6.5 REST OF LATIN AMERICA
                       TABLE 111 REST OF LATIN AMERICA: CLOUD-NATIVE APPLICATION PROTECTION PLATFORM MARKET, BY OFFERING, 2020–2027 (USD MILLION)
                       TABLE 112 REST OF LATIN AMERICA: MARKET, BY CLOUD TYPE, 2020–2027 (USD MILLION)
                       TABLE 113 REST OF LATIN AMERICA: MARKET, BY ORGANIZATION SIZE, 2020–2027 (USD MILLION)
                       TABLE 114 REST OF LATIN AMERICA: MARKET, BY VERTICAL, 2020–2027 (USD MILLION)
 
11 COMPETITIVE LANDSCAPE (Page No. - 131)
     11.1 OVERVIEW 
     11.2 STRATEGIES ADOPTED BY KEY PLAYERS 
               FIGURE 33 CLOUD-NATIVE APPLICATION PROTECTION PLATFORM: MARKET EVALUATION FRAMEWORK
     11.3 HISTORICAL REVENUE ANALYSIS 
               FIGURE 34 HISTORICAL REVENUE ANALYSIS OF KEY CNAPP VENDORS, 2020–2021 (USD MILLION)
     11.4 CLOUD-NATIVE APPLICATION PROTECTION PLATFORM MARKET: RANKING OF KEY PLAYERS 
               FIGURE 35 RANKING OF KEY PLAYERS
     11.5 MARKET SHARE ANALYSIS 
               FIGURE 36 MARKET SHARE, 2021
               TABLE 115 MARKET: DEGREE OF COMPETITION
     11.6 COMPANY EVALUATION QUADRANT 
               TABLE 116 EVALUATION CRITERIA
             11.6.1 STARS
             11.6.2 EMERGING LEADERS
             11.6.3 PERVASIVE PLAYERS
             11.6.4 PARTICIPANTS
                       FIGURE 37 MARKET: KEY COMPANY EVALUATION QUADRANT (2022)
             11.6.5 COMPETITIVE BENCHMARKING FOR KEY PLAYERS
                       TABLE 117 REGION FOOTPRINT OF KEY COMPANIES
                       FIGURE 38 PRODUCT FOOTPRINT OF KEY COMPANIES
     11.7 STARTUP/SME EVALUATION QUADRANT 
             11.7.1 PROGRESSIVE COMPANIES
             11.7.2 RESPONSIVE COMPANIES
             11.7.3 DYNAMIC COMPANIES
             11.7.4 STARTING BLOCKS
                       FIGURE 39 CLOUD-NATIVE APPLICATION PROTECTION PLATFORM MARKET: STARTUP EVALUATION QUADRANT (2022)
             11.7.5 COMPETITIVE BENCHMARKING FOR STARTUPS
                       TABLE 118 LIST OF STARTUP/SME AND FUNDING
                       TABLE 119 REGIONAL FOOTPRINT OF STARTUP/SME
     11.8 COMPETITIVE SCENARIO AND TRENDS 
             11.8.1 PRODUCT LAUNCHES AND ENHANCEMENTS
                       TABLE 120 MARKET: PRODUCT LAUNCHES AND ENHANCEMENTS, 2020–2022
             11.8.2 DEALS
                       TABLE 121 MARKET: DEALS, 2020–2022
 
12 COMPANY PROFILES (Page No. - 147)
     12.1 KEY PLAYERS 
(Business Overview, Solutions, Products & Services offered, Recent Developments, MnM View)*
             12.1.1 CHECK POINT
                       TABLE 122 CHECK POINT: BUSINESS OVERVIEW
                       FIGURE 40 CHECK POINT: COMPANY SNAPSHOT
                       TABLE 123 CHECK POINT: PRODUCTS/SOLUTIONS/SERVICES OFFERED
                       TABLE 124 CHECK POINT: PRODUCT LAUNCHES AND ENHANCEMENTS
                       TABLE 125 CHECK POINT: DEALS
             12.1.2 TREND MICRO
                       TABLE 126 TREND MICRO: BUSINESS OVERVIEW
                       FIGURE 41 TREND MICRO: COMPANY SNAPSHOT
                       TABLE 127 TREND MICRO: PRODUCTS/SOLUTIONS/SERVICES OFFERED
                       TABLE 128 TREND MICRO: PRODUCT LAUNCHES AND ENHANCEMENTS
                       TABLE 129 TREND MICRO: DEALS
             12.1.3 PALO ALTO NETWORKS
                       TABLE 130 PALO ALTO NETWORKS: BUSINESS OVERVIEW
                       FIGURE 42 PALO ALTO NETWORKS: COMPANY SNAPSHOT
                       TABLE 131 PALO ALTO NETWORKS: PRODUCTS/SOLUTIONS/SERVICES OFFERED
                       TABLE 132 PALO ALTO NETWORKS: PRODUCT LAUNCHES AND ENHANCEMENTS
             12.1.4 CROWDSTRIKE
                       TABLE 133 CROWDSTRIKE: BUSINESS OVERVIEW
                       FIGURE 43 CROWDSTRIKE: COMPANY SNAPSHOT
                       TABLE 134 CROWDSTRIKE: PRODUCTS/SOLUTIONS/SERVICES OFFERED
                       TABLE 135 CROWDSTRIKE: PRODUCT LAUNCHES AND ENHANCEMENTS
                       TABLE 136 CROWDSTRIKE: DEALS
             12.1.5 FORTINET
                       TABLE 137 FORTINET: BUSINESS OVERVIEW
                       FIGURE 44 FORTINET: COMPANY SNAPSHOT
                       TABLE 138 FORTINET: PRODUCTS/SOLUTIONS/SERVICES OFFERED
                       TABLE 139 FORTINET: PRODUCT LAUNCHES AND ENHANCEMENTS
                       TABLE 140 FORTINET: DEALS
             12.1.6 FORCEPOINT
                       TABLE 141 FORCEPOINT: BUSINESS OVERVIEW
                       TABLE 142 FORCEPOINT: PRODUCTS/SOLUTIONS/SERVICES OFFERED
                       TABLE 143 FORCEPOINT: PRODUCT LAUNCHES AND ENHANCEMENTS
             12.1.7 PROOFPOINT
                       TABLE 144 PROOFPOINT: BUSINESS OVERVIEW
                       FIGURE 45 PROOFPOINT: COMPANY SNAPSHOT
                       TABLE 145 PROOFPOINT: PRODUCTS/SOLUTIONS/SERVICES OFFERED
                       TABLE 146 PROOFPOINT: PRODUCT LAUNCHES AND ENHANCEMENTS
                       TABLE 147 PROOFPOINT: DEALS
             12.1.8 RADWARE
                       TABLE 148 RADWARE: BUSINESS OVERVIEW
                       FIGURE 46 RADWARE: COMPANY SNAPSHOT
                       TABLE 149 RADWARE: PRODUCTS/SOLUTIONS/SERVICES OFFERED
                       TABLE 150 RADWARE: DEALS
             12.1.9 ZSCALER
                       TABLE 151 ZSCALER: BUSINESS OVERVIEW
                       FIGURE 47 ZSCALER: COMPANY SNAPSHOT
                       TABLE 152 ZSCALER: PRODUCTS/SOLUTIONS/SERVICES OFFERED
                       TABLE 153 ZSCALER: PRODUCT LAUNCHES AND ENHANCEMENTS
                       TABLE 154 ZSCALER: DEALS
             12.1.10 SOPHOS
                       TABLE 155 SOPHOS: BUSINESS OVERVIEW
                       TABLE 156 SOPHOS: PRODUCTS/SOLUTIONS/SERVICES OFFERED
                       TABLE 157 SOPHOS: PRODUCT LAUNCHES AND ENHANCEMENTS
                       TABLE 158 SOPHOS: DEALS
*Details on Business Overview, Solutions, Products & Services offered, Recent Developments, MnM View might not be captured in case of unlisted companies.
     12.2 OTHER PLAYERS 
             12.2.1 AQUA SECURITY
             12.2.2 CEQUENCE SECURITY
             12.2.3 ILLUMIO
             12.2.4 RUNECAST
             12.2.5 DATA THEOREM
             12.2.6 METASECURE
             12.2.7 TIGERA
             12.2.8 ORCA SECURITY
             12.2.9 SKYHIGH SECURITY
             12.2.10 CAVEONIX
             12.2.11 WIZ.IO
             12.2.12 ERMETIC
             12.2.13 BANYAN CLOUD
             12.2.14 ACCUKNOX
 
13 APPENDIX (Page No. - 192)
     13.1 ADJACENT MARKETS 
               TABLE 159 ADJACENT MARKETS AND FORECASTS
     13.2 LIMITATIONS 
             13.2.1 CLOUD SECURITY POSTURE MANAGEMENT MARKET
                       TABLE 160 CLOUD SECURITY POSTURE MANAGEMENT MARKET, BY COMPONENT, 2016–2021 (USD MILLION)
                       TABLE 161 CLOUD SECURITY POSTURE MANAGEMENT MARKET, BY COMPONENT, 2022–2027 (USD MILLION)
                       TABLE 162 CLOUD SECURITY POSTURE MANAGEMENT MARKET, BY ORGANIZATION SIZE, 2016–2021 (USD MILLION)
                       TABLE 163 CLOUD SECURITY POSTURE MANAGEMENT MARKET, BY ORGANIZATION SIZE, 2022–2027 (USD MILLION)
                       TABLE 164 CLOUD SECURITY POSTURE MANAGEMENT MARKET, BY VERTICAL, 2016–2021 (USD MILLION)
                       TABLE 165 CLOUD SECURITY POSTURE MANAGEMENT MARKET, BY VERTICAL, 2022–2027 (USD MILLION)
                       TABLE 166 CLOUD SECURITY POSTURE MANAGEMENT MARKET, BY REGION, 2016–2021 (USD MILLION)
                       TABLE 167 CLOUD SECURITY POSTURE MANAGEMENT MARKET, BY REGION, 2022–2027 (USD MILLION)
             13.2.2 CLOUD SECURITY MARKET
                       TABLE 168 CLOUD SECURITY MARKET, BY SECURITY TYPE, 2015–2020 (USD MILLION)
                       TABLE 169 CLOUD SECURITY MARKET, BY SECURITY TYPE, 2020–2026 (USD MILLION)
                       TABLE 170 CLOUD SECURITY MARKET, BY APPLICATION, 2015–2020 (USD MILLION)
                       TABLE 171 CLOUD SECURITY MARKET, BY APPLICATION, 2020–2026 (USD MILLION)
                       TABLE 172 CLOUD SECURITY MARKET, BY ORGANIZATION SIZE, 2015–2020 (USD MILLION)
                       TABLE 173 CLOUD SECURITY MARKET, BY ORGANIZATION SIZE, 2020–2026 (USD MILLION)
                       TABLE 174 CLOUD SECURITY MARKET, BY VERTICAL, 2015–2020 (USD MILLION)
                       TABLE 175 CLOUD SECURITY MARKET, BY VERTICAL, 2020–2026 (USD MILLION)
                       TABLE 176 CLOUD SECURITY MARKET, BY REGION, 2015–2020 (USD MILLION)
                       TABLE 177 CLOUD SECURITY MARKET, BY REGION, 2020–2026 (USD MILLION)
             13.2.3 CLOUD WORKLOAD PROTECTION MARKET
                       TABLE 178 CLOUD WORKLOAD PROTECTION MARKET, BY COMPONENT, 2016–2023 (USD MILLION)
                       TABLE 179 CLOUD WORKLOAD PROTECTION MARKET, BY SOLUTION TYPE, 2016–2023 (USD MILLION)
                       TABLE 180 CLOUD WORKLOAD PROTECTION MARKET, BY DEPLOYMENT MODEL, 2016–2023 (USD MILLION)
                       TABLE 181 CLOUD WORKLOAD PROTECTION MARKET, BY ORGANIZATION SIZE, 2016–2023 (USD MILLION)
                       TABLE 182 CLOUD WORKLOAD PROTECTION MARKET, BY VERTICAL, 2016–2023 (USD MILLION)
                       TABLE 183 CLOUD WORKLOAD PROTECTION MARKET, BY REGION, 2016–2023 (USD MILLION)
     13.3 DISCUSSION GUIDE 
     13.4 KNOWLEDGESTORE: MARKETSANDMARKETS’ SUBSCRIPTION PORTAL 
     13.5 CUSTOMIZATION OPTIONS 
     13.6 RELATED REPORTS 
     13.7 AUTHOR DETAILS 

The study involved major activities in estimating the current market size of the CNAPP market. Exhaustive secondary research was done to collect information on the CNAPP industry. The next step was to validate these findings, assumptions, and sizing with industry experts across the value chain using primary research. Different approaches, such as top-down, bottom-up, etc., were employed to estimate the total market size. After that, the market breakup and data triangulation procedures were used to estimate the market size of the segments and sub-segments of the CNAPP market.

Secondary Research

In the secondary research process, various secondary sources were referred to for identifying and collecting information related to the study. Secondary sources included annual reports, press releases, and investor presentations of CNAPP vendors, forums, certified publications, and whitepapers. The secondary research was used to obtain key information related to the industry’s value chain, the total pool of key players, market classification, and segmentation from the market and technology-oriented perspectives.

The factors considered for estimating the regional-level market size include GDP growth, ICT security spending, recent market developments, technology adoption of CNAPP, and market ranking analysis of major CNAPP vendors.

Primary Research

Various primary sources from both supply and demand sides were interviewed to obtain qualitative and quantitative information for this report in the primary research process. The primary sources from the supply side included various industry experts, including Chief Executive Officers (CEOs), Vice Presidents (VPs), marketing directors, technology and innovation directors, and related key executives from various key companies and organizations operating in the CNAPP market.

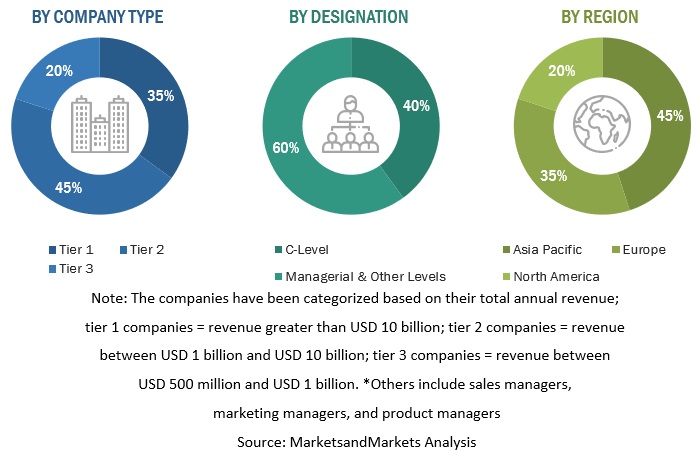
Following is the breakup of primary respondents:
Cloud-native Application Protection Platform (CNAPP) Market Size, and Share

To know about the assumptions considered for the study, download the pdf brochure

Market Size Estimation
Cloud-native Application Protection Platform (CNAPP) Market Size, and Share

To know about the assumptions considered for the study, Request for Free Sample Report

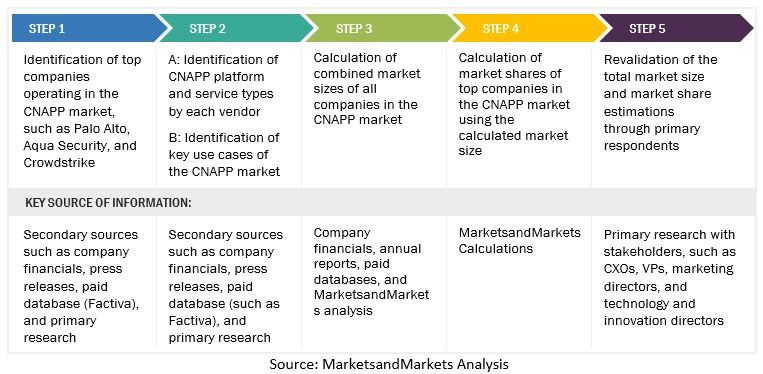
Multiple approaches were adopted to estimate and forecast the size of the CNAPP market. In the market engineering process, the top-down and bottom-up approaches were extensively used, along with several data triangulation methods, to perform the market estimation and market forecasting for the overall market segments and sub-segments listed in this report. Extensive qualitative and quantitative analyses were performed on the complete market engineering process to list key information/insights throughout the report. This entire procedure included the study of the annual and financial reports of top market players and extensive interviews for key insights from industry leaders, such as CEOs, VPs, directors, and marketing executives. All percentage splits and breakups were determined using secondary sources and verified through primary sources. All possible parameters that affect the market covered in this research study have been accounted for, viewed in extensive detail, verified through primary research, and analyzed to get the final quantitative and qualitative data. This data is consolidated and added to detailed inputs and analysis from MarketsandMarkets.

Data Triangulation

After arriving at the overall market size using the market size estimation processes, as explained above, the market was split into several segments and subsegments. The data triangulation and market breakup procedures were employed, wherever applicable, to complete the overall market engineering process and arrive at the exact statistics of each market segment and sub-segments. The data was triangulated by studying various factors and trends from the demand and supply sides.

Report Objectives

  • To describe and forecast the global cloud-native application protection platform (CNAPP) market by offering, cloud type, organization size, vertical, and region
  • To forecast the market size of five main regions: North America, Europe, the Asia Pacific (APAC), Middle East & Africa (MEA), and Latin America
  • To analyze the subsegments of the market concerning individual growth trends, prospects, and contributions to the overall market
  • To provide detailed information related to major factors (drivers, restraints, opportunities, and challenges) influencing the growth of the market
  • To analyze the opportunities in the market for stakeholders and provide the competitive landscape details of major players
  • To profile the key players of the CNAPP market and comprehensively analyze their market shares and core competencies
  • To track and analyze competitive developments, such as mergers and acquisitions (M&A), new product developments, partnerships, and collaborations in the market

Customization Options

With the given market data, MarketsandMarkets offers customizations based on company-specific needs. The following customization options are available for the report:

Geographic Analysis

  • Further breakup of the Asia Pacific market into countries contributing 75% to the regional market size
  • Further breakup of the North American market into countries contributing 75% to the regional market size
  • Further breakup of the Latin American market into countries contributing 75% to the regional market size
  • Further breakup of the Middle Eastern and African market into countries contributing 75% to the regional market size
  • Further breakup of the European market into countries contributing 75% to the regional market size

Company Information

  • Detailed analysis and profiling of additional market players (up to 5)

Cloud Infrastructure Entitlement Management Market & Its Impact on Cloud Native Application Protection Platform Market

Cloud Infrastructure Entitlement Management (CIEM) is focused on managing access and permissions to cloud resources and ensuring that users only have access to the resources they need to do their jobs. It involves identifying and analyzing user permissions, setting policies for access control, and monitoring activity to detect any unauthorized access or changes.

CIEM solutions are becoming increasingly important as more organizations move their applications and data to the cloud. CIEM solutions provide visibility and control over access to cloud resources, which is critical for maintaining security and compliance. As such, CIEM solutions are expected to become a standard part of the cloud security toolkit for many organizations.

The growing adoption of CIEM solutions is likely to have a positive impact on the Cloud Native Application Protection Platform (CNAPP) market. As more organizations become adept at managing access to cloud resources with CIEM solutions, they will be able to better identify potential security risks and vulnerabilities. This can help inform the development of CNAPP policies and strategies for securing cloud-native applications and services.

Furthermore, CIEM solutions can help ensure that only authorized users have access to sensitive data and applications. This reduces the risk of unauthorized access and data breaches, which are among the most significant security threats faced by organizations today. This can also help reduce the impact of security incidents and make it easier to respond to security events.

Futuristic Growth Use-Cases of Cloud Infrastructure Entitlement Management Market

  1. Zero-Trust Security: CIEM solutions can be used to implement a zero-trust security model, where all access requests are verified and authenticated before access is granted. This can help reduce the risk of unauthorized access and data breaches, which are among the most significant security threats faced by organizations today.
  2. Automated Compliance: CIEM solutions can automate the process of monitoring and reporting on compliance with security policies and regulations. This can help organizations to achieve and maintain compliance with a range of industry-specific regulations and standards, such as HIPAA, PCI DSS, and GDPR.
  3. Data Governance: CIEM solutions can help organizations to enforce data governance policies and ensure that sensitive data is only accessed by authorized personnel. This can help prevent data leaks, reduce the risk of insider threats, and ensure compliance with data privacy regulations.
  4. Identity and Access Management (IAM) Integration: CIEM solutions can be integrated with IAM systems to provide a comprehensive view of user access and permissions across cloud resources. This can help organizations to manage user access more efficiently and effectively, reducing the risk of security incidents and enabling rapid response to security events.
  5. DevOps Integration: CIEM solutions can be integrated into DevOps processes to ensure that security policies are built into the development and deployment of cloud-native applications. This can help reduce the risk of security vulnerabilities and ensure that cloud applications are secure by design.

Top Players in Cloud Infrastructure Entitlement Management Market

  1. Okta
  2. IBM
  3. SailPoint
  4. CyberArk
  5. Microsoft
  6. OneLogin
  7. Google
  8. Symantec

Industries Getting Impacted in Future by Cloud Infrastructure Entitlement Management Market

  1. Healthcare: Healthcare organizations are responsible for managing a large amount of sensitive data, including patient records and medical information. CIEM solutions can help healthcare organizations manage access to this data and ensure compliance with regulations such as HIPAA.
  2. Financial Services: Financial institutions are responsible for managing large amounts of sensitive financial data, including customer account information and transaction records. CIEM solutions can help financial organizations manage access to this data and ensure compliance with regulations such as PCI DSS.
  3. Retail: Retail organizations are responsible for managing customer data, including personal information and payment details. CIEM solutions can help retail organizations manage access to this data and ensure compliance with regulations such as GDPR.
  4. Manufacturing: Manufacturing organizations are responsible for managing data related to production processes and supply chain operations. CIEM solutions can help manufacturing organizations manage access to this data and ensure compliance with regulations such as ISO 27001.
  5. Education: Educational institutions are responsible for managing student data, including academic records and personal information. CIEM solutions can help educational institutions manage access to this data and ensure compliance with regulations such as FERPA.

New Business Opportunities in Cloud Infrastructure Entitlement Management Market

  1. CIEM Consulting Services: Many organizations are still new to cloud infrastructure entitlement management, and they may not have the internal expertise to implement and manage a CIEM solution. Consulting services that offer guidance and support for CIEM implementation and management can be in high demand.
  2. CIEM Managed Services: Some organizations may prefer to outsource the management of their CIEM solution to a third-party provider. Managed services that offer ongoing management and support for CIEM solutions can be a valuable business opportunity.
  3. CIEM Integration Services: CIEM solutions may need to be integrated with other systems and tools, such as identity and access management (IAM) systems or security information and event management (SIEM) solutions. Integration services that help organizations integrate CIEM solutions with their existing technology stack can be in high demand.
  4. CIEM Software Development: CIEM solutions require specialized software development expertise. Software development firms that specialize in CIEM solutions can be in high demand as organizations look to implement and customize CIEM solutions.
  5. CIEM Analytics and Reporting: CIEM solutions generate a significant amount of data related to user access and permissions. Analytics and reporting services that help organizations make sense of this data can be a valuable business opportunity.

Key Challenges for Growing Cloud Infrastructure Entitlement Management Business in the Future Market

  1. Balancing Security and User Convenience: One of the key challenges in CIEM is to strike a balance between security and user convenience. A CIEM solution that is too restrictive may discourage users from adopting cloud services, while a solution that is too permissive may put sensitive data at risk.
  2. Meeting Regulatory Requirements: Organizations in heavily regulated industries such as finance, healthcare, and government may face specific regulatory requirements related to data privacy and security. CIEM providers will need to ensure that their solutions comply with these regulations, which can be complex and time-consuming.
  3. Cloud Vendor Compatibility: As cloud providers continue to expand their offerings, CIEM solutions will need to be compatible with a growing number of cloud platforms and services. This can be challenging for CIEM providers as they seek to keep pace with evolving cloud architectures and API integrations.
  4. Addressing Shadow IT: Shadow IT refers to the use of cloud services by employees without the knowledge or approval of the IT department. CIEM solutions will need to address this challenge by providing visibility into all cloud services being used across the organization and ensuring that only authorized users have access to them.
  5. Keeping Up with Emerging Threats: Cybersecurity threats are constantly evolving, and CIEM providers will need to keep pace with emerging threats to ensure that their solutions remain effective in protecting against data breaches and other cyber threats.

Speak to our Analyst today to know more about the "Cloud Infrastructure Entitlement Management Market".

Custom Market Research Services

We will customize the research for you, in case the report listed above does not meet with your exact requirements. Our custom research will comprehensively cover the business information you require to help you arrive at strategic and profitable business decisions.

Request Customization

Instant Answers with GPT - Ask Now!

Ask real questions. Get complete answers !
Report Code
TC 8524
Published ON
Dec, 2022
Choose License Type
BUY NOW
  • SHARE
X
Request Customization
Speak to Analyst
Speak to Analyst
OR FACE-TO-FACE MEETING
PERSONALIZE THIS RESEARCH
  • Triangulate with your Own Data
  • Get Data as per your Format and Definition
  • Gain a Deeper Dive on a Specific Application, Geography, Customer or Competitor
  • Any level of Personalization
REQUEST A FREE CUSTOMIZATION
LET US HELP YOU!
  • What are the Known and Unknown Adjacencies Impacting the Cloud-native Application Protection Platform (CNAPP) Market
  • What will your New Revenue Sources be?
  • Who will be your Top Customer; what will make them switch?
  • Defend your Market Share or Win Competitors
  • Get a Scorecard for Target Partners
CUSTOMIZED WORKSHOP REQUEST
+1-888-600-6441
  • Call Us
  • +1-888-600-6441 (Corporate office hours)
  • +1-888-600-6441 (US/Can toll free)
  • +44-800-368-9399 (UK office hours)
CONNECT WITH US
ABOUT TRUST ONLINE
©2024 MarketsandMarkets Research Private Ltd. All rights reserved
DMCA.com Protection Status Website Feedback