Cloud Storage Market by Offering (Storage Type (Object, File, Block), Services), Use Case (Business Continuity, Application Management, Data Management), Deployment Model, Organization Size, Vertical and Region - Global Forecast to 2028
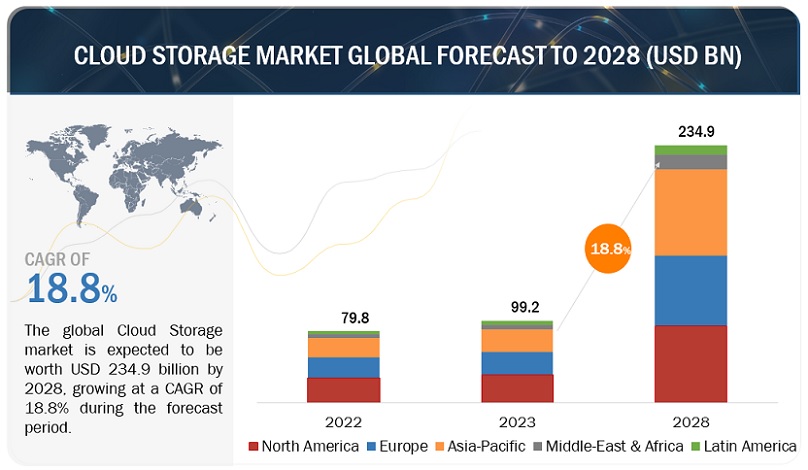
The global Cloud Storage Market size is expected to grow from USD 99.2 billion in 2023 to USD 234.9 billion by 2028 at a Compound Annual Growth Rate (CAGR) of 18.8% during the forecast period. The impact of the recession (before, during, and after the recession) on the market is covered throughout the report. Increasing data storage requirements, availability of secure, scalable, enterprise-friendly private cloud storage, reliable, seamless monitoring facilitated, affordable public cloud storage, convenient customization offered, greater user-control or user-friendly, SME-friendly hybrid cloud storage, proliferation and robust adoption of Cloud storage solutions worldwide, are few fundamental factors/forces that drive the global Cloud Storage market.
To know about the assumptions considered for the study, Request for Free Sample Report
To know about the assumptions considered for the study, download the pdf brochure
Recession Impact on the global Cloud Storage Market
A recession can significantly impact the Cloud Storage market across organizations, industry verticals, and regions. Businesses may delay investments in these technologies as they prioritize cost-cutting over innovation. Startups in the field may struggle to secure funding as investors become more risk-averse. However, Cloud Storage technologies can find resilience in some sectors, like gaming and entertainment, as people seek entertainment options during recessions. On the positive side, these technologies can facilitate remote work and collaboration, which may increase demand in a remote-work-focused economy. Government stimulus and investments in technology development can also help mitigate the recession's impact. In the end, the extent of the effect varies by region, industry, and the severity of the economic downturn.
Cloud Storage Market Dynamics
Drivers: Cloud storage providers of services driven by growth in data generation
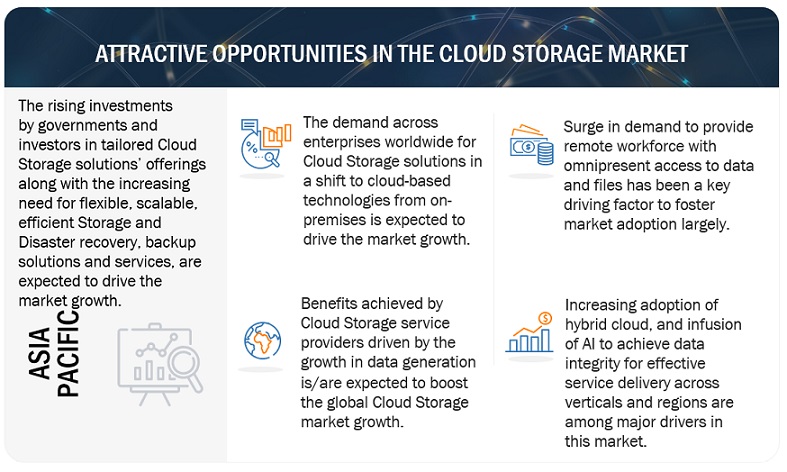
Several key factors drive the growth of the cloud storage market providing services. The exponential surge in data generation, with the demand for low CAPEX and OPEX on IT hardware, plays a crucial role. The cloud storage market is witnessing significant growth due to the expanding realms of IoT and big data. Cloud storage services offer an agile, flexible, and scalable model for data storage on the Internet, managed and operated by service providers. This model provides enterprises with advantages such as rapid deployment, scalability, reduced CAPEX, and uninterrupted business continuity.
Restraints: Surge in metadata
Experts in cloud storage claim that metadata is essential to the cloud storage sector. The amount of metadata in the modern world is growing startlingly and unprecedentedly. Due to the inevitable explosion of unstructured data, its problems will only worsen. Many businesses still recognize that their metadata exceeds the data they keep, which harms performance and scalability. It also affects database sharing and creates new problems that cost money and time. The metadata issue has forced IT companies to pay careful attention to their software stack. Consequently, they can ensure it suits modern, next-generation application demands.
Opportunities: Businesses have ample opportunities to delve into data encryption and edge computing
In the future (next 1-2 years commencing January 2024), cloud storage vendors will focus more on edge computing. Most people are unaware of how crucial it is to consider their location when choosing where to locate cloud services. Moreover, cloud service infrastructure will increase in cost with increased usage. But, providing a smooth link will also require additional work. For this reason, cloud storage vendors will concentrate on edge computing, in which providers try to make cloud resources available close to or close to users. To put it another way, edge computing forces companies to select a site for the service nearest to your address. This helps increase overall reliability and reduce latency.
Challenges: Threat of ransomware
Malware that encrypts access to the files and data of the target enterprise is known as ransomware. The hackers/cybercriminals then demand that the business pay a ransom—essentially an excessive amount in legal parlance—to access their files. This kind of malware could pose a severe threat to the business if it infiltrates the cloud storage used by the organization. A ransomware assault could prevent the company from accessing critical company data, potentially leading to the complete cessation of the company's business activities. Nonetheless, cloud storage companies have acknowledged this problem and are taking preventative measures to combat ransomware. Numerous cloud storage companies have created built-in malware scanning services that evaluate data once the user uploads them to ensure they are virus-free. The scanning services can automatically quarantine anything they find questionable.
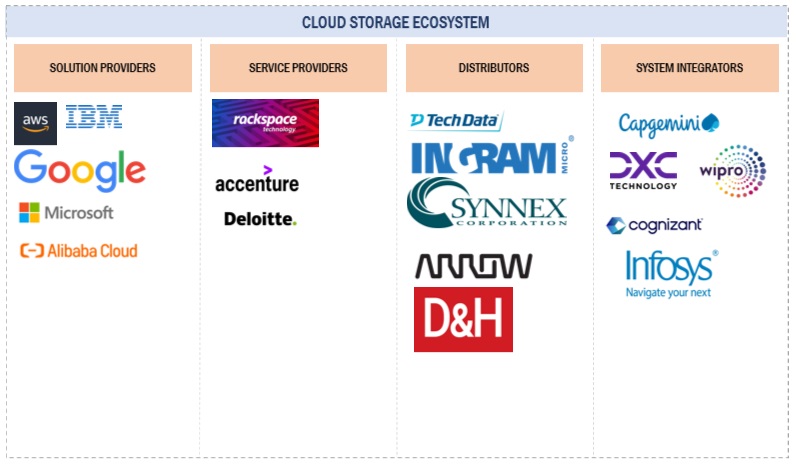
Cloud Storage Market Ecosystem
Based on use cases, backup & Recovery will hold the highest market share in the Cloud Storage market during the forecast period.
Backup & Recovery is crucial in safeguarding data and ensuring business continuity. These applications are purpose-built to address the unique challenges of modern, dynamic, and often distributed IT environments. By seamlessly integrating with cloud technologies and containerized workloads, they provide a layer of resilience that protects data against loss, corruption, or disasters. These solutions enable organizations to efficiently create backups, perform granular recoveries, and maintain data integrity, thereby supporting cloud applications and services reliable and uninterrupted operation. In an era where data is a paramount asset, Backup & Recovery applications in cloud storage are indispensable for mitigating risks and ensuring the availability and integrity of critical information.
Based on offering, the services segment recorded a higher CAGR in the Cloud Storage market during the forecast period.
Services are essential to the cloud storage market because they support customers before and after cloud storage solutions are deployed. Service providers help their customers with cloud storage solutions at several stages, including designing, implementing, maintaining, and upgrading. The significance of cloud storage services, including consultancy, integration and implementation, training, support, and maintenance, is explained in the upcoming chapter.
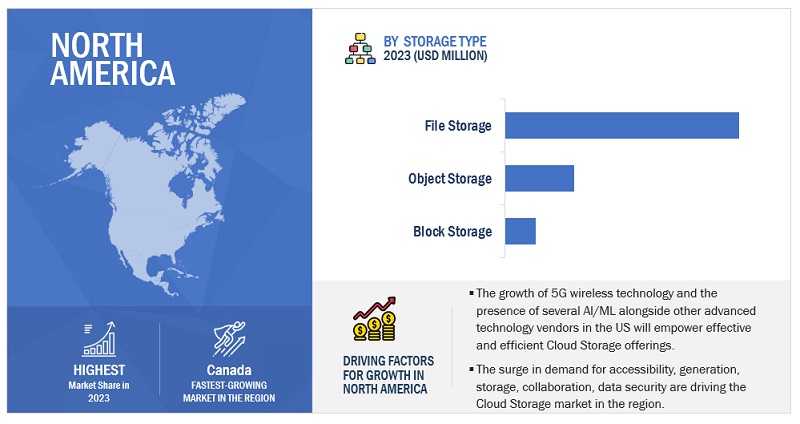
North America will hold the largest market share in the cloud storage market during the forecast period.
Cloud Storage adoption in the North American region has gained considerable momentum, positioning the region as a leader in the field/market. According to experts, North America is expected to have the highest adoption rate of Cloud Storage solutions and associated services compared to other regions. This is due to the growing interest of American households in innovative technologies as well as the increasing investment of North American companies in advanced technologies such as commercial and industrial IoT, 5G, cloud computing, and AI. The advanced technology incorporated/run Cloud Storage solutions are used across companies to reduce latency, handle network traffic, and lower operational expenses.
North America leads the rest in terms of cloud storage market share. The US and Canada are the two leading North American nations influencing the expansion of cloud storage acceptance and usage. A study found that over 55% of businesses have implemented cloud solutions, and over 91% offer at least one cloud-based service. Decreased capital expenditure, simplified IT administration, enhanced flexibility, and safety are among the primary motivators propelling cloud computing expansion in North America, boosting cloud storage solutions' uptake and expansion pace. Major market participants, such as AWS, IBM, Dell, HPE, and Microsoft, are US-based.
Key Market Players
The Cloud Storage market is dominated both by established companies as well as startups such as AWS (US), IBM (US), Google (US), Microsoft (US), Alibaba Cloud (China), Oracle (US), Dell Technologies (US), HPE (US), Huawei (China),. These vendors have a large customer base, a strong geographic footprint, and organized distribution channels. They incorporate organic and inorganic growth strategies, including product launches, deals, and business expansions, boosting revenue generation.
The study includes an in-depth competitive analysis of these key players in the Cloud Storage market with their company profiles, recent developments, and key market strategies.
Get online access to the report on the World's First Market Intelligence Cloud
- Easy to Download Historical Data & Forecast Numbers
- Company Analysis Dashboard for high growth potential opportunities
- Research Analyst Access for customization & queries
- Competitor Analysis with Interactive dashboard
- Latest News, Updates & Trend analysis
Request Sample Scope of the Report
Get online access to the report on the World's First Market Intelligence Cloud
- Easy to Download Historical Data & Forecast Numbers
- Company Analysis Dashboard for high growth potential opportunities
- Research Analyst Access for customization & queries
- Competitor Analysis with Interactive dashboard
- Latest News, Updates & Trend analysis
|
Report Metrics |
Details |
|
Market size available for years |
2018-2028 |
|
Base year considered |
2023 |
|
Forecast period |
2023–2028 |
|
Forecast units |
Value (USD Million) |
|
Segments Covered |
Offering, Use Case, Deployment Model, Organization Size, and Vertical |
|
Regions covered |
North America, Europe, Asia Pacific, Middle East & Africa, and Latin America |
|
Companies covered |
AWS (US), IBM (US), Google (US), Microsoft (US), Oracle (US), Alibaba Cloud (China), Huawei Cloud (China), Rackspace technology (US), HPE (US), MinIO (US), UpCloud (Finland), pCloud (Switzerland), Sync (Canada), Zadara (US), box (US), Dropbox (US), Tencent Cloud (China), Fujitsu (Japan), NetApp (US), VMware (US), Scality (US), Citrix (US), DigitalOcean (US), Vultr, Wasabi |
This research report categorizes the Cloud Storage market to forecast revenue and analyze trends in each of the following submarkets:
Based on Offering:
-
Storage type
- Block storage
- Object storage
- File storage
-
Services
- Training and Consulting
- Integration and implementation
- Support and maintenance
Based on Deployment model:
- Public cloud
- Private cloud
- Hybrid cloud
Based on Organization Size:
- Large Enterprises
- SMEs
Based on Vertical:
- BFSI
- Telecommunications
- IT & ITeS
- Government & Public sector
- Energy & Utilities
- Manufacturing
- Retail & Consumer goods
- Media & Entertainment
- Healthcare & Life sciences
- Education
- Other Verticals (transportation)
Based on Region:
-
North America
- US
- Canada
-
Europe
- UK
- Germany
- France
- Italy
- Rest of Europe
-
Asia Pacific
- China
- Japan
- Australia
- Rest of Asia Pacific
-
Middle East & Africa
- Saudi Arabia
- UAE
- South Africa
- Rest of the Middle East & Africa
-
Latin America
- Brazil
- Mexico
- Rest of Latin America
Recent Developments
- In September 2023, with the addition of a new feature, Amazon FSx for Windows File Server, Amazon (AWS) now enables its users to select and update the level of I/O operations per second (IOPS) separately from the storage capacity on the file system. Earlier, the IOPS performance level for accessing data on a user's file Solid State Drive (SSD) storage disks was fixed at a ratio of 3 IOPS per Gigabyte (GB) of storage capacity. Now, customers can configure SSD IOPS independently from storage capacity up to a ratio of 500 IOPS per GB.
- In September 2023, an MoU signed between Alibaba Cloud and Astra Tech will leverage Alibaba Cloud's Enterprise Mobile Application Studio (EMAS) mobile testing solution into Botim (which is underway to become an ultra-app) to enhance users' experience through unparalleled app performance, reliability, and seamless functionality. Botim is the Middle East & North Africa's leading communications platform.
- The partnership between both entities where Botim has leveraged Alibaba Cloud's products and services, including Elastic Compute Service (ECS), storage, networking, and database services.
- In August 2023, Google Cloud announced a private preview of a parallel file system named Parallelstore that helps users avoid/negate wasting precious GPU resources while parallelly waiting for storage I/O (Input/Output) by providing a high-performing parallel file storage solution for AI/ML and HPC (High-Performance Computing) workloads. The solution is based on the next-generation Intel Distributed Asynchronous Object Storage (DAOS) architecture.
- In March 2023, the collaboration between IBM and Wasabi aimed to enable enterprises to run applications across any environment, be it on-premises, in the cloud, or at the edge, while allowing users to access and utilize critical business data and analytics in real-time with cost-effectiveness. The Boston Red Sox will be the first to leverage the joint power (collaboration) of IBM Cloud Satellite® and Wasabi hot cloud storage, designed to improve the club's operations across its entire business unit.
Frequently Asked Questions (FAQ):
What is the projected market value of the Cloud Storage market?
The global Cloud Storage market is expected to grow from USD 99.2 billion in 2023 to USD 234.9 billion by 2028 at a Compound Annual Growth Rate (CAGR) of 18.8% during the forecast period.
Which region has the highest CAGR in the Cloud Storage market?
The Asia Pacific region has the highest CAGR in the Cloud Storage market.
Which offering/component holds a more significant market share during the forecast period?
The storage type segment is forecasted to hold the largest market share in the cloud storage market.
Which are the major vendors in the Cloud Storage market?
IBM, AWS, Google, HPE, and DELL are prominent vendors in the Cloud Storage market.
What are some of the drivers in the Cloud Storage market?
A surge in demand for cloud storage from colocation service providers has set up data centers close to the workplace and establishment of cloud storage in remote locations. .
To speak to our analyst for a discussion on the above findings, click Speak to Analyst
The study covered four main actions to estimate the current market size of the cloud storage market. We conducted a significant amount of secondary research to gather data on the market, the competing market, and the parent market. The following stage involved conducting primary research to confirm these conclusions' hypotheses and sizing with industry experts throughout the value chain. A combination of top-down and bottom-up methods was used to assess the overall market size. We then estimated the market sizes of the leading Cloud Storage segments using the market breakup and data triangulation techniques.
Secondary Research
A wide range of secondary sources, directories, and databases were employed in this research project, including product demos, vendor data sheets, D&B Hoovers, DiscoverOrg, Factiva, Vendor Surveys, Cloud Computing Association (CCA), Asia Cloud Computing Association, and The Software Alliance. We referred to sources to locate and gather important data for this technical, commercial, and market-focused analysis of the cloud storage market.
Primary Research
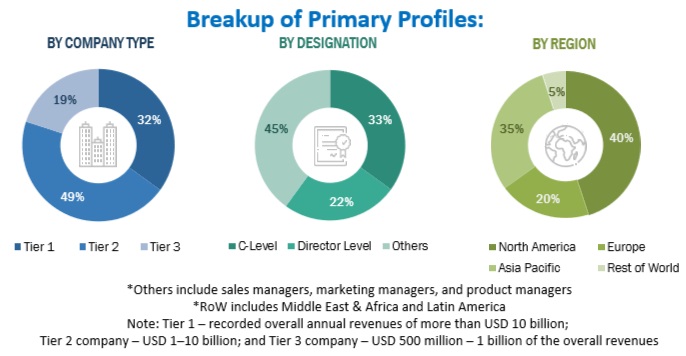
Several industry experts from the core and related industries and providers of preferred software, hardware manufacturers, distributors, service providers, technology developers, alliances, and organisations connected to every link in the industry value chain were the primary sources of information. Key industry participants, subject-matter experts, C-level executives of major market players, and industry consultants were among the primary respondents with whom in-depth interviews were conducted to gather and validate crucial qualitative and quantitative data and evaluate the market's potential.
To obtain information, we conducted primary interviews on market statistics, the most recent trends that are upending the industry, newly implemented use cases, data on revenue generated by goods and services, market segmentation, market size estimations, market forecasts, and data triangulation. Understanding different technological developments, segmentation types, industry trends, and geographical areas was also aided by primary research. To understand the buyer's perspective on suppliers, products, service providers, and their current use of services, which would affect the overall Cloud Storage market, demand-side stakeholders, such as Chief Executive Officers (CEOs), Chief Information Officers (CIOs), Chief Technology Officers (CTOs), Vice Presidents (VPs), and Chief Security Officers (CSOs), as well as the installation teams of governments/end users using cloud storage, and digital initiatives project teams, were interviewed.
To know about the assumptions considered for the study, download the pdf brochure
Market Size Estimation
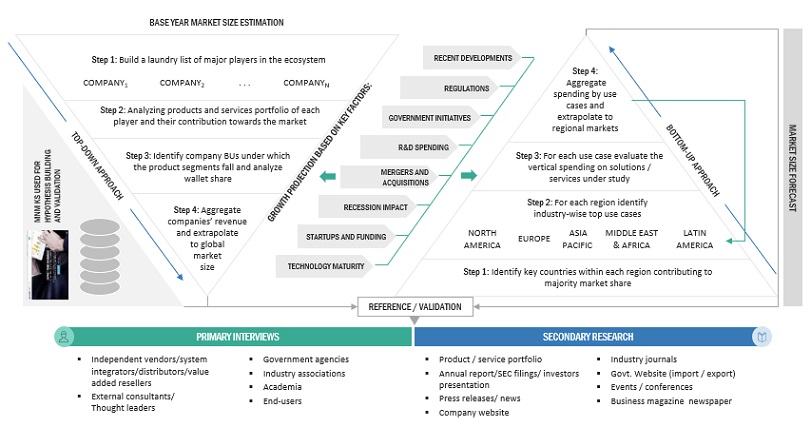
We employed top-down and bottom-up methodologies to estimate and forecast the Cloud Storage market and other associated submarkets. Using the revenues and product offerings of the major market players, the bottom-up approach assisted in determining the overall market size. This research ascertained and validated the precise value of the total parent market size through data triangulation techniques and primary interview validation. Using percentage splits of the market segments, we were able to estimate the size of other specific markets using the overall market size via the top-down approach.
The bottom-up approach identified the trend of Cloud Storage adoption among industry verticals in critical countries that contribute the most to the market. The adoption trend of cloud storage and varying cases of use concerning their business segments were identified and extrapolated for cross-validation. We gave weightage to the use cases identified in different solution areas for the calculation. We prepared an exhaustive list of all vendors offering Cloud Storage. We estimated the revenue contribution of all vendors in the market through annual reports, press releases, funding, investor presentations, paid databases, and primary interviews. We evaluated each vendor based on its service offerings across verticals. We extrapolated the aggregate of all companies' revenue to reach the overall market size. Each subsegment was studied and analyzed for its market size and regional penetration. We determined the region split through primary and secondary sources based on these numbers.
The top-down approach prepared an exhaustive list of all vendors in the Cloud Storage market. We estimated the revenue contribution of all vendors in the market through their annual reports, press releases, funding, investor presentations, paid databases, and primary interviews. We estimated the market size from revenues generated by vendors from different Cloud Storage offerings. Using secondary and primary sources, we located additional vendors and the income produced by each service type, which we then aggregated to calculate the market size. Additionally, the procedure included a regional penetration analysis of the cloud storage market. The investigation was utilized to ascertain and validate the precise values of the market sizes for Cloud Storage and its sectors, using the data triangulation process and primary data validation. The main procedure to gather essential insights was conducting in-depth interviews with CEOs, CTOs, CIOs, VPs, directors, and marketing executives. To confirm, we further triangulated market numbers using the current MarketsandMarkets repository.
Cloud Storage Market: Top-Down and Bottom-Up approaches
To know about the assumptions considered for the study, Request for Free Sample Report
Data Triangulation
The market was divided into several segments and subsegments using the previously described market size estimation procedures once the overall market size was determined. When required, market breakdown and data triangulation procedures were employed to complete the market engineering process and specify the exact figures for every market segment and subsegment. The data was triangulated by examining several variables and patterns from government entities' supply and demand sides.
Market Definition
Considering the views of various sources and associations on Cloud Storage, MarketsandMarkets defines Cloud Storage as "a cloud computing service model that allows end-users to store and access the data through the internet from various distributed and connected resources. Enterprises use cloud storage solutions to store, manage, and maintain enterprise data while leveraging cloud benefits, such as simplified accessibility, reliability, rapid deployment, secured data protection, and reduced infrastructure costs. Companies provide cloud storage solutions with three basic underlying architectures: object storage, block storage, and file storage".
Key Stakeholders
- Cloud storage providers
- Information Technology (IT) infrastructure equipment providers
- Cloud storage component providers
- System Integrators (SIs)
- Support service providers
- Consulting service providers
- Managed service providers
- Cloud Service Providers (CSPs)
Report Objectives
- To define, describe, and forecast the global Cloud Storage market based on offering, use case, deployment model, organization size, vertical, and region.
- To forecast the market size of the five major regional segments: North America, Europe, Asia Pacific, Middle East & Africa, and Latin America
- To strategically analyze the market subsegments for individual growth trends, prospects, and contributions to the total market
- To provide detailed information related to the major factors influencing the growth of the market (drivers, restraints, opportunities, and challenges)
- To strategically analyze macro and micro-markets for growth trends, prospects, and their contributions to the overall market
- To analyze industry trends, patents and innovations, and pricing data related to the Cloud Storage market.
- To analyze the opportunities in the market for stakeholders and provide details of the competitive landscape for major players.
- To profile key players in the market and comprehensively analyze their market share/ranking and core competencies
- To track and analyze competitive developments, such as mergers & acquisitions, product developments, and partnerships & collaborations in the market.
Note 1. Micromarkets are defined as the further segments and subsegments of the market included in the report.
Note 2. The companies' Core competencies are captured in terms of their key developments and essential strategies to sustain their position in the market.
Available Customizations
With the given market data, MarketsandMarkets offers customizations per the company's specific needs. The following customization options are available for the report:
Product Analysis
- The product matrix provides a detailed comparison of the product portfolio of each company.
Geographic Analysis
- Further breakup of the Asia Pacific market into countries contributing 75% to the regional market size
- Further breakup of the North American market into countries contributing 75% to the regional market size
- Further breakup of the Latin American market into countries contributing 75% to the regional market size
- Further breakup of the Middle Eastern & African market into countries contributing 75% to the regional market size
- Further breakup of the European market into countries contributing 75% to the regional market size
Company Information
- Detailed analysis and profiling of additional market players (up to 5)


 Generating Response ...


Growth opportunities and latent adjacency in Cloud Storage Market