Configuration Management Market by System (Software and Application, Storage, and Server), Module (CMDB, Service Catalog, and Service Definition), Component (Solution and Services), Enterprise Size, End-use Vertical, and Region - Global Forecast to 2024


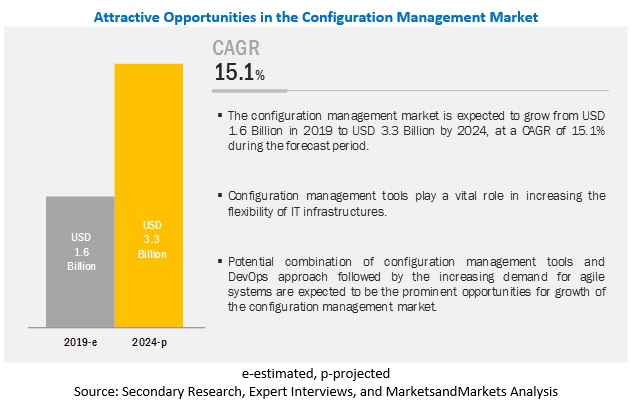
[150 Pages Report] The global Configuration Management Market size is projected to reach USD 3.3 billion by 2024, at a CAGR of 15.1%. Major growth factors for the market include Increased demand for simplifying and synchronizing IT resources and the emergence of digital technologies.
Configuration management for server system to grow at the highest CAGR during the forecast period
Server configuration management systematically handles changes to a system in a way that it maintains integrity over time. It enables servers to achieve the desired state using the tool�s specific language to make the allow server with swift automation. Over the coming years, deployment of configuration management within servers is expected to witness tremendous adoption, owing to maintain the efficiency within the systems.
Telecom and ITeS to hold the largest market size during the forecast period
Configuration management solutions play an essential role within telecom and ITeS, as they support all phases of the infrastructure life cycle. Moreover, telecom and ITeS end-use vertical has been experiencing rapid innovations and new technology adoption daily. Due to the pace of these innovations, IT infrastructures in both industries require a high level of scalability and flexibility to integrate with new applications and solutions smoothly.
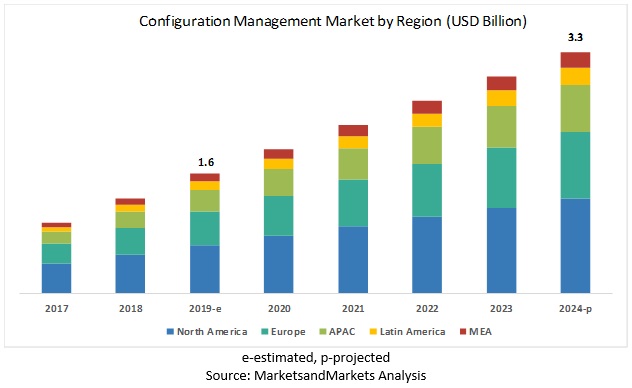
North America to hold the largest market size during the forecast period
North America is witnessing advancement within IT infrastructures and the presence of tech giants, such as Microsoft, IBM, Oracle, and BMC Software, which are the main contributors to the growth of the configuration management market in the region. The countries in the North American region have been open to the adoption of the latest technologies due to their well-established economies and deeply rooted infrastructures, which allow investments in these areas. The configuration management market is expected to grow significantly in the region due to the increasing demand for agile IT infrastructures driven by the emergence of digital technologies. Moreover, the region is actively controlled by government standards and regulations, leading to a more controlled environment of rapid and disruptive innovations
Key Market Players:
Key market players profiled in this report Microsoft (US), AWS (US), Oracle (US), BMC Software (US), IBM (US), Alibaba Cloud (China), CA Technologies (US), Puppet (US), Ansible (US), Chef (US), Micro Focus (UK), CloudBees (US), Northern Tech AS (Norway), Canonical (UK), SaltStack (US), Octopus Deplot (Australia), JetBrains (Czech Republic), Codenvy (US), and ServiceNow (US). The players offer configuration management tools to cater to the demands and needs of the market. Major growth strategies adopted by the players include partnerships, collaborations & agreements, and new product launches/product enhancements.
Please visit 360Quadrants to see the vendor listing of Best Configuration Management Software Quadrant
Get online access to the report on the World's First Market Intelligence Cloud
- Easy to Download Historical Data & Forecast Numbers
- Company Analysis Dashboard for high growth potential opportunities
- Research Analyst Access for customization & queries
- Competitor Analysis with Interactive dashboard
- Latest News, Updates & Trend analysis
Request Sample Scope of the Report
Get online access to the report on the World's First Market Intelligence Cloud
- Easy to Download Historical Data & Forecast Numbers
- Company Analysis Dashboard for high growth potential opportunities
- Research Analyst Access for customization & queries
- Competitor Analysis with Interactive dashboard
- Latest News, Updates & Trend analysis

|
Report Metrics |
Details |
|
Market size available for years |
2017�2024 |
|
Base year considered |
2018 |
|
Forecast period |
2019�2024 |
|
Forecast units |
Value (USD) |
|
Segments covered |
Module, component, system, enterprise size, end-use vertical, and Region |
|
Geographies covered |
North America, Europe, Asia Pacific, Latin America, and Middle East & Africa |
|
Companies covered |
Microsoft (US), AWS (US), Oracle (US), BMC Software (US), IBM (US), Alibaba Cloud (China), CA Technologies (US), Puppet (US), Ansible (US), Chef (US), Micro Focus (UK), CloudBees (US), Northern Tech AS (Norway), Canonical (UK), SaltStack (US), Octopus Deplot (Australia), JetBrains (Czech Republic), Codenvy (US), and ServiceNow (US). |
The research report categorizes the configuration management market to forecast revenues and analyze trends in each of the following submarkets:
By Component, the configuration management market has the following segments:
- Solution
- Services
By Services, the configuration management market has the following segments:
- Managed Services
- Professional Services
By Professional Services, the configuration management market has the following segments:
- Support and Maintenance
- Integration
- Training and Consulting
By Module, the configuration management market has the following segments:
- Configuration Management Database (CMDB)
- Service Catalog
- Service Definition
- Others*
*Others includes workflow management of service requests and financial management
By System, the configuration management market has the following segments:
- Software and Application
- Storage
- Server
By Enterprise Size, the configuration management market has the following segments:
- Small and Medium Enterprises
- Large Enterprises
By end-use Vertical, the Configuration management market has the following segments:
- Telecom and IT-enabled Services
- BFSI
- Government and Public Sector
- Healthcare and Life Sciences
- Manufacturing
- Retail and Consumer Packaged Goods
- Others*
*Others include travel, hospitality, utilities, and media and entertainment
By Region, the configuration management market has the following segments:
- North America
- US
- Canada
- Europe
- UK
- Germany
- France
- Rest of Europe
- Asia Pacific
- China
- Japan
- South Korea
- Rest of Asia Pacific
- Latin America
- Mexico
- Brazil
- Argentina
- Middle East & Africa
- Middle East
- Africa
Recent Developments
- In July 2019, IBM teamed up with DBmaestro, a provider of DevOps software services and solutions. The main objective of this partnership is to provide database automation capabilities to enterprise customers via DBmaestro's DevOps platform. These capabilities will be provided as a complementary offering to IBM UrbanCode Velocity customers.
- In June 2019, AWS launched a new service, named AWS Control Tower. The new service will help the customers set up and govern a secure and compliant multi-account AWS environment.
- In May, 2019, IBM launched a new service, named IBM Rapid Move. The new service is specially designed for SAP S/4HANA. The service will enable customers to accelerate the reinvention of business processes and the integration of new technology
- In April 2019, AWS launched a new managed service, �Amazon Managed Blockchain.� The service will assist customers to create, manage, and scale blockchain networks
- In April 2019, Oracle upgraded Oracle Enterprise Manager by adding new capabilities to it. The new updates introduced support for Oracle Autonomous Database on Oracle Cloud and other capabilities to enable the customers to monitor and manage their hybrid environments using the same tool.
Frequently Asked Questions (FAQ):
How big is the Configuration Management Market?
The global configuration management market size is projected to grow from USD 1.6 billion in 2019 to USD 3.3 billion by 2024, at a CAGR of 15.1% during 2019�2024.
What region holds the largest market size in the Configuration Management Market?
North America to hold the largest market size during the forecast period as the region is witnessing advancement within IT infrastructures and the presence of tech giants, such as Microsoft, IBM, Oracle, and BMC Software, which are the main contributors to the growth of the configuration management market in the region
Which among the Industry Vertical s holds the largest market size for Configuration Management Market?
Telecom and ITeS holds the largest market size during the forecast period. Configuration management solutions play an essential role within telecom and ITeS, as they support all phases of the infrastructure life cycle. Moreover, telecom and ITeS end-use vertical has been experiencing rapid innovations and new technology adoption daily. Due to the pace of these innovations, IT infrastructures in both industries require a high level of scalability and flexibility to integrate with new applications and solutions smoothly.
What are the major vendors in the Configuration Management Market?
major vendors in the Configuration Management Market are Microsoft (US), AWS (US), Oracle (US), BMC Software (US), IBM (US), Alibaba Cloud (China), CA Technologies (US), Puppet (US), Ansible (US), Chef (US), Micro Focus (UK), CloudBees (US), Northern Tech AS (Norway), Canonical (UK), SaltStack (US), Octopus Deplot (Australia), JetBrains (Czech Republic), Codenvy (US), and ServiceNow (US). .
To speak to our analyst for a discussion on the above findings, click Speak to Analyst
Table of Contents
1 Introduction (Page No. - 19)
1.1 Objectives of the Study
1.2 Market Definition
1.2.1 Inclusions and Exclusions
1.3 Market Scope
1.3.1 Market Segmentation
1.3.2 Regions Covered
1.4 Years Considered for the Study
1.5 Currency Considered
1.6 Stakeholders
2 Research Methodology (Page No. - 23)
2.1 Research Data
2.1.1 Secondary Data
2.1.2 Primary Data
2.1.2.1 Breakdown of Primary Profiles
2.1.2.2 Key Industry Insights
2.2 Market Breakdown and Data Triangulation
2.3 Market Size Estimation
2.3.1 Top-Down Approach
2.3.2 Bottom-Up Approach
2.4 Market Forecast
2.5 Competitive Leadership Mapping Research Methodology
2.6 Assumptions for the Study
2.7 Limitations of the Study
3 Executive Summary (Page No. - 30)
4 Premium Insights (Page No. - 34)
4.1 Attractive Market Opportunities in the Global Market
4.2 Configuration Management Market, By End-Use Vertical, 2019
4.3 North America: Market By System and Module, 2019
4.4 Asia Pacific: Market By System and Module, 2019
5 Market Overview and Industry Trends (Page No. - 38)
5.1 Introduction
5.2 Market Dynamics
5.2.1 Drivers
5.2.1.1 Increased Demand for Simplifying and Synchronizing It Resources to Boost the Adoption of Configuration Management Tools
5.2.1.2 Growing Need for Automated Management of It Processes and Policies to Drive the Use of Configuration Management Solutions
5.2.1.3 Emergence of Digital Technologies Driving the Need for Scalable and Flexible Systems
5.2.2 Restraints
5.2.2.1 Complexities in Configuring Applications From Different Environments While Maintaining the Optimum Performance
5.2.3 Opportunities
5.2.3.1 Potential Combination of Configuration Management Tools With the Devops to Boost the Adoption of Configuration Management Solutions
5.2.3.2 Increased Demand for Agile Systems to Foster the Growth of Configuration Management
5.2.4 Challenges
5.2.4.1 Complexities Introduced By Third-Party Integrations, Acquisitions, and Collaborations
5.2.4.2 Difficulties in Managing Large Amount of Configuration Data Collected From Different Environments
6 Configuration Management Market Analysis By Module (Page No. - 42)
6.1 Introduction
6.2 Configuration Management Database
6.2.1 CMDB Considered to Be the Backbone of Configuration Management Tools
6.3 Service Catalog
6.3.1 Service Catalog to Witness Tremendous Growth Opportunity Within the Asia Pacific Region
6.4 Service Definition
6.4.1 Service Definition Considered to Be A Critical Module for Configuration Management Tools
6.5 Others
7 Configuration Management Market Analysis By System (Page No. - 47)
7.1 Introduction
7.2 Software and Applications
7.2.1 Software and Applications System to Witness Tremendous Adoption Across Asia Pacific
7.3 Servers
7.3.1 Configuration Management for Servers to Be A Game-Changing Shift in the Ecosystem
7.4 Storage
7.4.1 Configuration Management for Storage to Be A Major Facilitator
8 Configuration Management Market Analysis By Component (Page No. - 51)
8.1 Introduction
8.2 Solution
8.2.1 Significant Revenue Growth Opportunities for the Solution Providers of Configuration Management
8.3 Services
8.3.1 Managed Services
8.3.1.1 Cost Competency to Be A Major Growth Supporting Factor for Managed Services
8.3.2 Professional Services
8.3.2.1 Training and Consulting
8.3.2.1.1 Rising Deployment for Standalone Solutions to Boost the Training and Consulting Market
8.3.2.2 Integration
8.3.2.2.1 Growing Demand for Cost-Efficient Open Source Platform to Support the Growth of Integration Services
8.3.2.3 Support and Maintenance
8.3.2.3.1 Growing Demand Within APAC and MEA Regions to Fuel Support and Maintenance Services Growth
9 Configuration Management Market Analysis By Enterprise Size (Page No. - 59)
9.1 Introduction
9.2 Small and Medium-Sized Enterprises
9.2.1 Small and Medium-Sized Enterprises to Be Significant Revenue Contributors for Configuration Management Vendors
9.3 Large Enterprises
9.3.1 Large Enterprises to Be the Highest Revenue Contributors for Configuration Management Business
10 Configuration Management Market Analysis By End-Use Vertical (Page No. - 64)
10.1 Introduction
10.2 Banking, Financial Services, and Insurance
10.2.1 Growing Competitiveness to Offer Swift Services to End Customers Compelling BFSI to Widely Adopt Configuration Management Tools
10.3 Telecom and ITeS
10.3.1 Growing Trends to Adopt Highly Augmented It Infrastructures to Propel Deployment Across ITeS
10.4 Healthcare and Life Sciences
10.4.1 Real-Time Decision-Making to Provide New Innovative Solutions and Treatments for Patients to Drive the Need for Configuration Management Tools
10.5 Retail and Consumer Packaged Goods
10.5.1 Demand for Understanding Consumer Needs and Delivering Augmented Offerings to Support the Demand for Configuration Management in Retail End-Use Vertical
10.6 Manufacturing
10.6.1 Configuration Management Tools Play A Vital Role in Maintaining Product Quality and Monitoring Product Efficiency in Manufacturing
10.7 Government and Public Sector
10.7.1 Growing Trends of Smart Governance to Support the Market Growth in Government and Public Sector
10.8 Others
11 Configuration Management Market By Region (Page No. - 74)
11.1 Introduction
11.2 North America
11.2.1 United States
11.2.1.1 Increase in Automation and Orchestration to Drive the Adoption of Configuration Management Solutions in the Us
11.2.2 Canada
11.2.2.1 Advanced It Infrastructure and Availability of Technical Expertise to Boost the Growth of Configuration Management Market in Canada
11.3 Europe
11.3.1 United Kingdom
11.3.1.1 Wide Adoption of Devops and Configuration Management Solutions By Government to Drive the Growth of the Market in the Uk
11.3.2 Germany
11.3.2.1 Cloud-Based Services and Existing Cloud Computing Infrastructure to Fuel the Adoption of Configuration Management Solutions in Germany
11.3.3 France
11.3.3.1 Growing Adoption of Devops for Effective Digital Transformation to Drive the Growth of Market in France
11.3.4 Rest of Europe
11.4 Asia Pacific
11.4.1 China
11.4.1.1 Rapid Adoption of Cloud Computing Technology to Boost the Growth of Configuration Management Market in China
11.4.2 Japan
11.4.2.1 Increasing Awareness of Agile and Devops Practices to Boost the Adoption of Configuration Management Solutions in Japan
11.4.3 South Korea
11.4.3.1 Advanced and Reliable It Infrastructure to Drive the Growth of Market in South Korea
11.4.4 Rest of Asia Pacific
11.5 Latin America
11.5.1 Mexico
11.5.1.1 Digital Transformation Initiatives to Boost the Growth of Market in Mexico
11.5.2 Brazil
11.5.2.1 Increasing Number of Enterprises Adopting Alm to Drive the Growth of Market in Brazil
11.5.3 Argentina
11.5.3.1 Improvements in It Infrastructure to Drive the Adoption of Configuration Management Tools in Argentina
11.5.4 Rest of Latin America
11.6 Middle East and Africa
11.6.1 Middle East
11.6.1.1 Significant Investments in the It Sector to Contribute to the Growth of Market in the Middle East
11.6.2 Africa
11.6.2.1 Rapid Digital Transformation to Foster the Growth of Configuration Management Market in Africa
12 Competitive Landscape (Page No. - 109)
12.1 Competitive Leadership Mapping
12.1.1 Visionary Leaders
12.1.2 Innovators
12.1.3 Dynamic Differentiators
12.1.4 Emerging Companies
12.2 Strength of Product Portfolio (30 Players)
12.3 Business Strategy Excellence (30 Players)
13 Company Profiles (Page No. - 113)
13.1 Microsoft
(Business Overview, Products, Solutions, & Services, Key Insights, Recent Developments, SWOT Analysis, MnM View)*
13.2 Oracle
13.3 IBM
13.4 Alibaba Cloud
13.5 AWS
13.6 Puppet
13.7 Ansible
13.8 Chef
13.9 Micro Focus
13.10 Cloudbees
13.11 Northern.Tech as
13.12 Canonical Ltd.
13.13 Saltstack
13.14 Octopus Deploy
13.15 Jetbrains
13.16 Codenvy
13.17 BMC Software
13.18 CA Technologies
13.19 Servicenow
13.20 Atlassian
*Details on Business Overview, Products, Soltuibns & Services, Key Insights, Recent Developments, SWOT Analysis, MnM View Might Not Be Captured in Case of Unlisted Companies.
14 Appendix (Page No. - 143)
14.1 Discussion Guide
14.2 Knowledge Store: Marketsandmarkets� Subscription Portal
14.3 Available Customization
14.4 Related Reports
14.5 Author Details
List of Tables (117 Tables)
Table 1 United States Dollar Exchange Rate, 2016�2018
Table 2 Factor Analysis
Table 3 Configuration Management Market Size, By Module, 2017�2024 (USD Million)
Table 4 Configuration Management Database: Market Size By Region, 2017�2024 (USD Million)
Table 5 Service Catalog: Market Size By Region, 2017�2024 (USD Million)
Table 6 Service Definition: Market Size By Region, 2017�2024 (USD Million)
Table 7 Others: Market Size By Region, 2017�2024 (USD Million)
Table 8 Configuration Management Market Size, By System, 2017�2024 (USD Million)
Table 9 Software and Applications: Market Size By Region, 2017�2024 (USD Million)
Table 10 Servers: Market Size By Region, 2017�2024 (USD Million)
Table 11 Storage: Market Size By Region, 2017�2024 (USD Million)
Table 12 Configuration Management Market Size, By Component, 2017�2024 (USD Million)
Table 13 Solution: Market Size By Region, 2017�2024 (USD Million)
Table 14 Services: Market Size By Type, 2017�2024 (USD Million)
Table 15 Services: Market Size By Region, 2017�2024 (USD Million)
Table 16 Managed Services Market Size, By Region, 2017�2024 (USD Million)
Table 17 Professional Services Market Size, By Service Type, 2017�2024 (USD Million)
Table 18 Professional Services Market Size, By Region, 2017�2024 (USD Million)
Table 19 Training and Consulting Market Size, By Region, 2017�2024 (USD Million)
Table 20 Integration Market Size, By Region, 2017�2024 (USD Million)
Table 21 Support and Maintenance Market Size, By Region, 2017�2024 (USD Million)
Table 22 Configuration Management Market Size, By Enterprise Size, 2017�2024 (USD Million)
Table 23 Small and Medium-Sized Enterprises: Market Size By End-Use Vertical, 2017�2024 (USD Million)
Table 24 Small and Medium-Sized Enterprises: Market Size By Region, 2017�2024 (USD Million)
Table 25 Large Enterprises: Market Size By End-Use Vertical, 2017�2024 (USD Million)
Table 26 Large Enterprises: Market Size By Region, 2017�2024 (USD Million)
Table 27 Configuration Management Market Size, By End-Use Vertical, 2017�2024 (USD Million)
Table 28 Banking, Financial Services, and Insurance: Market Size By Region, 2017�2024 (USD Million)
Table 29 Banking, Financial Services, and Insurance: Market Size By Enterprise Size, 2017�2024 (USD Million)
Table 30 Telecom and ITeS: Configuration Management Market Size, By Region, 2017�2024 (USD Million)
Table 31 Telecom and ITeS: Market Size By Enterprise Size, 2017�2024 (USD Million)
Table 32 Healthcare and Life Sciences: Market Size By Region, 2017�2024 (USD Million)
Table 33 Healthcare and Life Sciences: Market Size By Enterprise Size, 2017�2024 (USD Million)
Table 34 Retail and Consumer Packaged Goods: Market Size By Region, 2017�2024 (USD Million)
Table 35 Retail and Consumer Packaged Goods: Market Size By Enterprise Size, 2017�2024 (USD Million)
Table 36 Manufacturing: Configuration Management Market Size, By Region, 2017�2024 (USD Million)
Table 37 Manufacturing: Market Size By Enterprise Size, 2017�2024 (USD Million)
Table 38 Government and Public Sector: Market Size By Region, 2017�2024 (USD Million)
Table 39 Government and Public Sector: Market Size By Enterprise Size, 2017�2024 (USD Million)
Table 40 Others: Market Size By Region, 2017�2024 (USD Million)
Table 41 Others: Market Size By Enterprise Size, 2017�2024 (USD Million)
Table 42 Configuration Management Market Size, By Region, 2017�2024 (USD Million)
Table 43 North America: Configuration Management Market Size, By Module, 2017�2024 (USD Million)
Table 44 North America: Market Size By System, 2017�2024 (USD Million)
Table 45 North America: Market Size By Component, 2017�2024 (USD Million)
Table 46 North America: Market Size By Service, 2017�2024 (USD Million)
Table 47 North America: Market Size By Professional Service, 2017�2024 (USD Million)
Table 48 North America: Market Size By Enterprise Size, 2017�2024 (USD Million)
Table 49 North America: Market Size By End-Use Vertical, 2017�2024 (USD Million)
Table 50 North America: Banking, Financial Services, and Insurance Market Size, By Enterprise Size, 2017�2024 (USD Million)
Table 51 North America: Telecom and ITeS Market Size, By Enterprise Size, 2017�2024 (USD Million)
Table 52 North America: Healthcare and Life Sciences Market Size, By Enterprise Size, 2017�2024 (USD Million)
Table 53 North America: Retail and Consumer Packaged Goods Market Size, By Enterprise Size, 2017�2024 (USD Million)
Table 54 North America: Manufacturing Market Size, By Enterprise Size, 2017�2024 (USD Million)
Table 55 North America: Government and Public Sector Market Size, By Enterprise Size, 2017�2024 (USD Million)
Table 56 North America: Others Market Size, By Enterprise Size, 2017�2024 (USD Million)
Table 57 North America: Configuration Management Market Size, By Country, 2017�2024 (USD Million)
Table 58 Europe: Configuration Management Market Size, By Module, 2017�2024 (USD Million)
Table 59 Europe: Market Size By System, 2017�2024 (USD Million)
Table 60 Europe: Market Size By Component, 2017�2024 (USD Million)
Table 61 Europe: Market Size, By Service, 2017�2024 (USD Million)
Table 62 Europe: Market Size By Professional Service, 2017�2024 (USD Million)
Table 63 Europe: Market Size By Enterprise Size, 2017�2024 (USD Million)
Table 64 Europe: Market Size By End-Use Vertical, 2017�2024 (USD Million)
Table 65 Europe: Banking, Financial Services, and Insurance Market Size, By Enterprise Size, 2017�2024 (USD Million)
Table 66 Europe: Telecom and ITeS Market Size, By Enterprise Size, 2017�2024 (USD Million)
Table 67 Europe: Healthcare and Life Sciences Market Size, By Enterprise Size, 2017�2024 (USD Million)
Table 68 Europe: Retail and Consumer Packaged Goods Market Size, By Enterprise Size, 2017�2024 (USD Million)
Table 69 Europe: Manufacturing Market Size, By Enterprise Size, 2017�2024 (USD Million)
Table 70 Europe: Government and Public Sector Market Size, By Enterprise Size, 2017�2024 (USD Million)
Table 71 Europe: Others Market Size, By Enterprise Size, 2017�2024 (USD Million)
Table 72 Europe: Configuration Management Market Size, By Country, 2017�2024 (USD Million)
Table 73 Asia Pacific: Configuration Management Market Size, By Module, 2017�2024 (USD Million)
Table 74 Asia Pacific: Market Size By System, 2017�2024 (USD Million)
Table 75 Asia Pacific: Market Size By Component, 2017�2024 (USD Million)
Table 76 Asia Pacific: Market Size By Service, 2017�2024 (USD Million)
Table 77 Asia Pacific: Market Size By Professional Service, 2017�2024 (USD Million)
Table 78 Asia Pacific: Market Size By Enterprise Size, 2017�2024 (USD Million)
Table 79 Asia Pacific: Market Size By End-Use Vertical, 2017�2024 (USD Million)
Table 80 Asia Pacific: Banking, Financial Services, and Insurance Market Size, By Enterprise Size, 2017�2024 (USD Million)
Table 81 Asia Pacific: Telecom and ITeS Market Size, By Enterprise Size, 2017�2024 (USD Million)
Table 82 Asia Pacific: Healthcare and Life Sciences Market Size, By Enterprise Size, 2017�2024 (USD Million)
Table 83 Asia Pacific: Retail and Consumer Packaged Goods Market Size, By Enterprise Size, 2017�2024 (USD Million)
Table 84 Asia Pacific: Manufacturing Market Size, By Enterprise Size, 2017�2024 (USD Million)
Table 85 Asia Pacific: Government and Public Sector Market Size, By Enterprise Size, 2017�2024 (USD Million)
Table 86 Asia Pacific: Others Market Size, By Enterprise Size, 2017�2024 (USD Million)
Table 87 Asia Pacific: Configuration Management Market Size, By Country, 2017�2024 (USD Million)
Table 88 Latin America: Configuration Management Market Size, By Module, 2017�2024 (USD Million)
Table 89 Latin America: Market Size By System, 2017�2024 (USD Million)
Table 90 Latin America: Market Size By Component, 2017�2024 (USD Million)
Table 91 Latin America: Market Size By Service, 2017�2024 (USD Million)
Table 92 Latin America: Market Size By Professional Service, 2017�2024 (USD Million)
Table 93 Latin America: Market Size By Enterprise Size, 2017�2024 (USD Million)
Table 94 Latin America: Market Size By End-Use Vertical, 2017�2024 (USD Million)
Table 95 Latin America: Banking, Financial Services, and Insurance Market Size, By Enterprise Size, 2017�2024 (USD Million)
Table 96 Latin America: Telecom and ITeS Market Size, By Enterprise Size, 2017�2024 (USD Million)
Table 97 Latin America: Healthcare and Life Sciences Market Size, By Enterprise Size, 2017�2024 (USD Million)
Table 98 Latin America: Retail and Consumer Packaged Goods Market Size, By Enterprise Size, 2017�2024 (USD Million)
Table 99 Latin America: Manufacturing Market Size, By Enterprise Size, 2017�2024 (USD Million)
Table 100 Latin America: Government and Public Sector Market Size, By Enterprise Size, 2017�2024 (USD Million)
Table 101 Latin America: Others Market Size, By Enterprise Size, 2017�2024 (USD Million)
Table 102 Latin America: Configuration Management Market Size, By Country, 2017�2024 (USD Million)
Table 103 Middle East and Africa: Configuration Management Market Size, By Module, 2017�2024 (USD Million)
Table 104 Middle East and Africa: Market Size By System, 2017�2024 (USD Million)
Table 105 Middle East and Africa: Market Size By Component, 2017�2024 (USD Million)
Table 106 Middle East and Africa: Market Size By Service, 2017�2024 (USD Million)
Table 107 Middle East and Africa: Market Size By Professional Service, 2017�2024 (USD Million)
Table 108 Middle East and Africa: Market Size By Enterprise Size, 2017�2024 (USD Million)
Table 109 Middle East and Africa: Market Size By End-Use Vertical, 2017�2024 (USD Million)
Table 110 Middle East and Africa: Banking, Financial Services, and Insurance Market Size, By Enterprise Size, 2017�2024 (USD Million)
Table 111 Middle East and Africa: Telecom and ITeS Market Size, By Enterprise Size, 2017�2024 (USD Million)
Table 112 Middle East and Africa: Healthcare and Life Sciences Market Size, By Enterprise Size, 2017�2024 (USD Million)
Table 113 Middle East and Africa: Retail and Consumer Packaged Goods Market Size, By Enterprise Size, 2017�2024 (USD Million)
Table 114 Middle East and Africa: Manufacturing Market Size, By Enterprise Size, 2017�2024 (USD Million)
Table 115 Middle East and Africa: Government and Public Sector Market Size, By Enterprise Size, 2017�2024 (USD Million)
Table 116 Middle East and Africa: Others Market Size, By Enterprise Size, 2017�2024 (USD Million)
Table 117 Middle East and Africa: Configuration Management Market Size, By Country, 2017�2024 (USD Million)
List of Figures (35 Figures)
Figure 1 Global Configuration Management Market: Research Design
Figure 2 Configuration Management Market: Top-Down and Bottom-Up Approaches
Figure 3 Competitive Leadership Mapping: Criteria Weightage
Figure 4 Software and Applications System to Hold the Largest Market Size During the Forecast Period
Figure 5 Configuration Management Database Module to have the Largest Market Size During the Forecast Period
Figure 6 Telecom and ITeS End-Use Vertical to Hold the Highest Market Share Throughout the Forecast Period
Figure 7 Small and Medium-Sized Enterprises to Record the Highest Growth Rate During the Forecast Period
Figure 8 Asia Pacific Region to Witness the Highest Growth Rate During the Forecast Period
Figure 9 Growing Number of Applications to Support the Configuration Management Market Growth
Figure 10 Telecom and ITeS and BFSI End-Use Verticals to Account for the Highest Market Shares in 2019
Figure 11 CMDB Module and Applications System to Record the Highest Market Shares in North America in 2019
Figure 12 CMDB Module, and Software and Applications System to Record the Highest Market Shares in Asia Pacific in 2019
Figure 13 Drivers, Restraints, Opportunities, and Challenges: Configuration Management Market
Figure 14 Configuration Management Database Segment to Record the Largest Market Size During the Forecast Period
Figure 15 Software and Applications System to Record the Largest Market Size During the Forecast Period
Figure 16 Solution Segment to Record A Larger Market Size During the Forecast Period
Figure 17 Managed Services to Record A Larger Market Size During the Forecast Period
Figure 18 Integration Segment to Record the Largest Market Size During the Forecast Period
Figure 19 Large Enterprises Segment to Record A Larger Market Size During the Forecast Period
Figure 20 Telecom and ITeS to Record the Largest Market Size During the Forecast Period
Figure 21 Asia Pacific to Exhibit the Highest CAGR in the Configuration Management Market During the Forecast Period
Figure 22 North America: Market Snapshot
Figure 23 Asia Pacific: Market Snapshot
Figure 24 Configuration Management Market (Global) Competitive Leadership Mapping, 2019
Figure 25 Microsoft: Company Snapshot
Figure 26 Microsoft: SWOT Analysis
Figure 27 Oracle: Company Snapshot
Figure 28 Oracle: SWOT Analysis
Figure 29 IBM: Company Snapshot
Figure 30 IBM: SWOT Analysis
Figure 31 Alibaba: Company Snapshot
Figure 32 Alibaba: SWOT Analysis
Figure 33 AWS: Company Snapshot
Figure 34 AWS: SWOT Analysis
Figure 35 Micro Focus: Company Snapshot
The study involved four major activities in estimating the current size of the configuration management market. Extensive secondary research was done to collect information on the configuration management market. The next step was to validate these findings, assumptions, and sizing with industry experts across the value chain using primary research. Both top-down and bottom-up approaches were employed to estimate the complete market size. After that, market breakup and data triangulation procedures were used to determine the size of the segments and subsegments of the market.
Secondary Research
In the secondary research process, various secondary sources, such as D&B Hoovers, Bloomberg BusinessWeek, and Factiva have been referred to for identifying and collecting information for the study. The secondary sources included annual reports, press releases and investor presentations of companies; whitepapers, certified publications, and articles by recognized authors; gold standard and silver standard websites; regulatory bodies; trade directories; and databases.
Primary Research
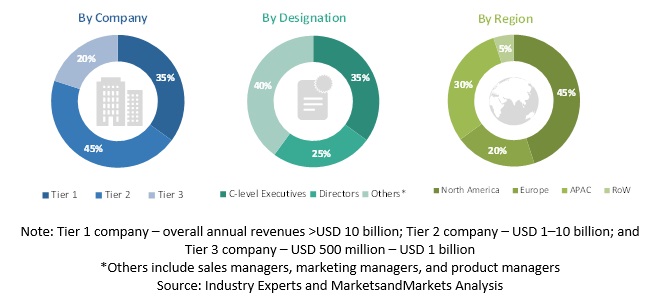
The configuration management market comprises several stakeholders, such as service providers, solution vendors, system integrators, technology partners, consulting firms, research organizations, managed service providers, government agencies, financial bodies, resellers and distributors, enterprise users, and technology providers. The demand side of the market consists of financial institutions, investors, and insurance companies. The supply side includes configuration management solutions providers. Various primary sources from both the supply and demand sides of the market were interviewed to obtain qualitative and quantitative information. Following is the profile breakup of the primary respondents:
To know about the assumptions considered for the study, download the pdf brochure
Market Size Estimation
Both top-down and bottom-up approaches were used to estimate and validate the total size of the configuration management market. The methods were also used extensively to estimate the size of various segments in the market. The research methodology used to estimate the market size includes the following:
- Key players in the market have been identified through extensive secondary research.
- The industry�s supply chain and market size, in terms of value, have been determined through primary and secondary research processes.
- All percentage shares split, and breakups have been determined using secondary sources and verified through primary sources.
Data Triangulation
After arriving at the overall market size using the market size estimation processes as explained above, the market was split into several segments and subsegments. To complete the overall market engineering process and arrive at the exact statistics of each market segment and subsegment, data triangulation, and market breakup procedures were employed, wherever applicable. The data was triangulated by studying various factors and trends from both the demand and supply sides.
Report Objectives
- To determine and forecast the global configuration management market by mode, components, deployment, organization size, end-users, verticals, and region from 2019 to 2024, and analyze the various macroeconomic and microeconomic factors that affect the market growth
- To forecast the size of the market segments concerning five main regions: North America, Europe, Asia Pacific (APAC), Latin America and Middle East and Africa (MEA)
- To analyze each submarket for individual growth trends, prospects, and contributions to the overall configuration management market
- To provide detailed information about the major factors (drivers, restraints, opportunities, and challenges) influencing the growth of the configuration management market
Available Customizations
With the given market data, MarketsandMarkets offers customizations as per the company�s specific needs. The following customization options are available for the report:
Geographic Analysis
- Further breakup of the APAC market into countries contributing 75% to the regional market size
- New breakup of the North American market into countries contributing 75% to the local market size
- Further breakup of the Latin American market into countries contributing 75% to the regional market size
- Further breakup of the MEA market into countries contributing 75% to the regional market size
- Further breakup of the European market into countries contributing 75% to the regional market size
Company Information
- Detailed analysis and profiling of additional market players (up to 5)


Growth opportunities and latent adjacency in Configuration Management Market