Container Monitoring Market by Component (Solution and Services), Operating System, Deployment Mode, Organization Size, Vertical (Telecom and IT, BFSI, Government, Healthcare and Life Sciences, Travel and Hospitality), and Region - Global Forecast to 2022


[119 Pages Report] The container monitoring market accounted for USD 144.1 Million in 2016 and is projected to reach USD 706.2 Million by 2022, at a Compound Annual Growth Rate (CAGR) of 33.0% during the forecast period. The base year considered for this study is 2016, and the forecast period is 2017�2022.
The rapidly growing DevOps, benefits of cost-effectiveness and increased productivity, and increasing popularity of containers and microservices are some of the major factors fuelling the growth of the global market.
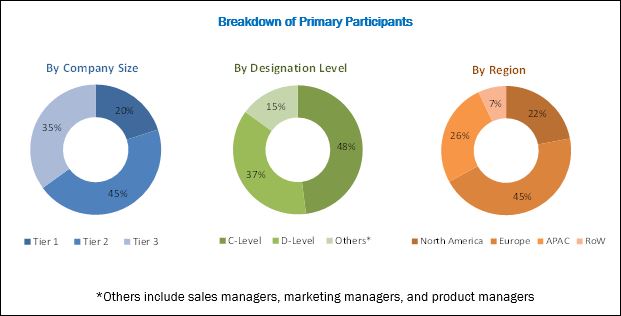
The research methodology used to estimate and forecast the container monitoring market began with the capturing of data on the revenues of the key vendors through secondary sources, such as annual reports; press releases; associations including Cloud Computing Association, Cloud Native Computing Foundation (CNCF), and Open Containers Initiative; databases such as Factiva, D&B Hoovers, and BusinessWeek; company websites; and news articles. Vendor offerings were also taken into consideration to determine the market segmentation. The bottom-up procedure was employed to arrive at the overall market size of the global market from the revenue of the key players in the market. After arriving at the overall market size, the total market was split into several segments and subsegments, which were then verified through primary research by conducting extensive interviews with key people, such as Chief Executive Officers (CEOs), Vice Presidents (VPs), directors, and executives. The data triangulation and market breakdown procedures were employed to complete the overall market engineering process and arrive at the exact statistics for all the segments. The breakdown of the primary profiles is depicted in the below figure:
To know about the assumptions considered for the study, download the pdf brochure
The container monitoring ecosystem includes several container monitoring solution and service providers, such as CA Technologies (US), AppDynamics (US), Splunk (US), Dynatrace (US), Datadog (US), BMC Software (US), Sysdig (US), SignalFx (US), Wavefront (US), and CoScale (Belgium). Other stakeholders in the container monitoring market include Cloud Service Providers (CSPs), developers, Independent Software Vendors (ISVs), system integrators, consulting companies, and enterprise customers.
Key Target Audience for Container Monitoring Market
- Container monitoring vendors
- Developers and IT operators
- CSPs
- ISVs
- System integrators
- Research organizations
- Consulting companies
- Government agencies
�The research study answers several questions for the stakeholders, primarily which market segments to focus on in the next 2 to 5 years, for prioritizing the efforts and investments.�
Scope of the Container Monitoring Market Report
|
Report Metric |
Details |
|
Market size available for years |
2015�2022 |
|
Base year considered |
2016 |
|
Forecast period |
2017�2022 |
|
Forecast unit |
Value (USD) |
|
Segments covered |
Solution, Services, Operating System, Deployment Mode, Organization Size, Vertical & Region |
|
Geographies covered |
North America, Europe, Asia Pacific (APAC), Latin America, and Middle East and Africa (MEA) |
|
Companies covered |
CA Technologies (US), AppDynamics (US), Splunk (US), Dynatrace (US), Datadog (US), BMC Software (US), Sysdig (US), SignalFx (US), Wavefront (US), and CoScale (Belgium) |
The research report segments the market into the following submarkets:
Container Monitoring Market By Component:
- Solution
- Services
- Professional Services
- Training and Development
- Integration and Consulting
- Support and Maintenance
- Managed Services
- Professional Services
Container Monitoring Market By Operating System:
- Linux
- Windows
Market By Deployment Mode
- Cloud
- Public Cloud
- Hybrid Cloud
- On-Premises
Container Monitoring Market By Organization Size
- Large Enterprises
- Small and Medium-sized Enterprises (SMEs)
Market By Vertical
- BFSI
- Telecom and IT
- Government
- Travel and Hospitality
- Manufacturing
- Healthcare and Life Sciences
- Retail and eCommerce
- Media and Entertainment
- Transportation and Logistics
- Others (Energy and Utilities, and Education)
Container Monitoring Market By Region
- North America
- Europe
- APAC
- MEA
- Latin America
Available Customizations
With the given market data, MarketsandMarkets offers customizations based on the company�s specific needs. The following customization options are available for the report:
Geographic Analysis
- Further breakdown of the North American market into countries contributing 75% of the regional market size
- Further breakdown of the European market into countries contributing 75% of the regional market size
- Further breakdown of the APAC market into countries contributing 75% of the regional market size
- Further breakdown of the MEA market into countries contributing 75% of the regional market size
- Further breakdown of the Latin American market into countries contributing 75% of the regional market size
Company Information
- Detailed analysis and profiling of additional market players (up to 5)
The container monitoring market is expected to grow from USD 169.6 Million in 2017 to USD 706.2 Million by 2022, at a Compound Annual Growth Rate (CAGR) of 33.0%. The demand for container monitoring is driven by many factors, such as increasing DevOps, benefits of cost-effectiveness, increased productivity, and increasing popularity of microservices.
The container monitoring market has been segmented on the basis of components, operating systems, deployment modes, organization size, verticals, and regions. Among the professional services, the training and development segment is expected to grow at the highest CAGR during the forecast period, and the consulting and integration segment is estimated to have the largest market size in 2017 in the market. Container monitoring offers insights into how the applications are connected to the container, how do container metrics relate to application workloads and the application performance. The adoption of container monitoring solutions and services among various enterprises has increased, due to the various benefits, such as faster development and deployment of applications, and optimum utilization of resources.
Among the deployment modes, the cloud segment is estimated to hold the largest market share in 2017. The cloud solutions are comparatively cheaper than the on-premises deployment mode. Hence, enterprises with budget constraints tend to choose the cloud deployment mode. The cloud deployment model offers various benefits to enterprises, such as scalability, reliability, and flexibility.
North America is estimated to have the largest market share in 2017, whereas the Europe region is projected to grow at the highest CAGR during the forecast period in the container monitoring market. The increasing use of microservices and the growth of DevOps is driving the demand for container monitoring globally.
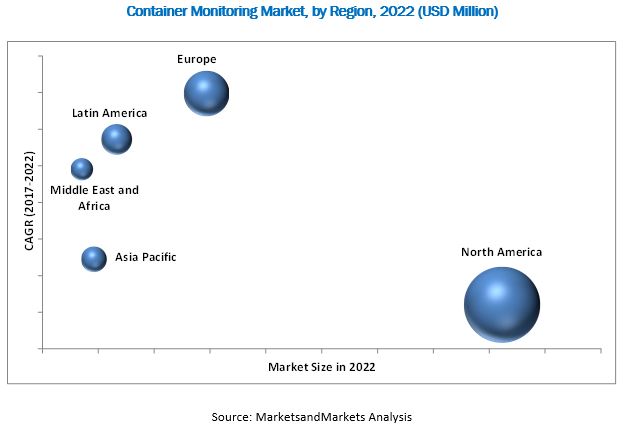
North America is estimated to hold the largest market size in 2017. Increasing DevOps and organization�s focus on digital transformation are driving the need of container monitoring solutions. Furthermore, rapid economic growth in the major countries, along with organization�s need to deliver enriched experience to their customers is driving the container monitoring market growth across the globe. In Latin America, SMEs as well as large enterprises, belonging to a range of verticals, such as Banking, Financial Services, and Insurance (BFSI); government defense; and IT and telecommunications, are expected to increase their investments in container monitoring solutions and services. Adoption of container monitoring is increasing in the market, owing to the increasing need for resource optimization and operational simplicity. However, the major issue faced by enterprises while adopting container monitoring is the difficulty in monitoring container sprawl.
The major vendors providing Container monitoring are CA Technologies (US), AppDynamics (US), Splunk (US), Dynatrace (US), Datadog (US), BMC Software (US), Sysdig (US), SignalFx (US), Wavefront (US), and CoScale (Belgium). These players have adopted various strategies, such as new product developments; partnerships and collaborations; mergers and acquisitions; and business expansions, to expand their presence in the global container monitoring market.
To speak to our analyst for a discussion on the above findings, click Speak to Analyst
Table of Contents
1 Introduction (Page No. - 13)
1.1 Objectives of the Study
1.2 Market Definition
1.3 Market Scope
1.4 Years Considered for the Study
1.5 Currency
1.6 Stakeholders
2 Research Methodology (Page No. - 16)
2.1 Research Data
2.1.1 Secondary Data
2.1.2 Primary Data
2.1.2.1 Breakdown of Primaries
2.1.2.2 Key Industry Insights
2.2 Market Size Estimation
2.2.1 Bottom-Up Approach
2.2.2 Top-Down Approach
2.3 Research Assumptions and Limitations
2.3.1 Limitations
3 Executive Summary (Page No. - 22)
4 Premium Insights (Page No. - 26)
4.1 Attractive Market Opportunities in the Container Monitoring Market
4.2 Market By Region 2017�2022
4.3 Market By Vertical 2017�2022
4.4 Life Cycle Analysis, By Region, 2017�2022
5 Container Monitoring Market Overview and Industry Trends (Page No. - 29)
5.1 Introduction
5.2 Timeline of Container Monitoring
5.3 Market Dynamics
5.3.1 Drivers
5.3.1.1 Easy to Implement Than Virtualization
5.3.1.2 Continuous Focus of Organizations on Digital Transformations
5.3.1.3 Widespread Presence of Open Source Vendors Offering Container-Based Solutions
5.3.1.4 Growth of Devops
5.3.2 Restraints
5.3.2.1 Persistent Storage Issues
5.3.3 Opportunities
5.3.3.1 Rise in Cloud-Based Technologies
5.3.4 Challenges
5.3.4.1 Monitoring the Container Sprawl
5.3.4.2 Parallel Implementation of Container Monitoring Tools With the Traditional Infrastructure
5.4 Architectural Framework
5.5 Innovation Spotlight
5.6 Impact of A Wide Array of Classes of Container Monitoring
5.7 Augmenting Security Strategies With Container Monitoring
5.8 Leveraging Analytics With Container Monitoring
5.9 State of Container Monitoring
5.10 Integration of Container Monitoring and Orchestration
6 Market By Component (Page No. - 36)
6.1 Introduction
6.2 Solution
6.3 Services
6.3.1 Professional Services
6.3.1.1 Training and Development
6.3.1.2 Consulting and Integration
6.3.1.3 Support and Maintenance
6.3.2 Managed Services
7 Container Monitoring Market By Operating System (Page No. - 44)
7.1 Introduction
7.2 Linux
7.3 Windows
8 Market By Deployment Mode (Page No. - 45)
8.1 Introduction
8.2 Cloud
8.2.1 Public Cloud
8.2.2 Private Cloud
8.3 On-Premises
9 Container Monitoring Market By Organization Size (Page No. - 49)
9.1 Introduction
9.2 Small and Medium-Sized Enterprises
9.3 Large Enterprises
10 Market By Vertical (Page No. - 53)
10.1 Introduction
10.2 Banking, Financial Services, and Insurance
10.3 Telecom and IT
10.4 Government
10.5 Travel and Hospitality
10.6 Manufacturing
10.7 Healthcare and Life Sciences
10.8 Retail and Ecommerce
10.9 Media and Entertainment
10.10 Transportation and Logistics
10.11 Others
11 Container Monitoring Market By Region (Page No. - 63)
11.1 Introduction
11.2 North America
11.3 Europe
11.4 Asia Pacific
11.5 Middle East and Africa
11.6 Latin America
12 Competitive Landscape (Page No. - 83)
12.1 Overview
12.2 Prominent Players Operating in the Container Monitoring Market
12.3 Competitive Scenario
12.3.1 New Product Launches
12.3.2 Partnerships and Collaborations
12.3.3 Business Expansions
12.3.4 Mergers and Acquisitions
13 Company Profiles (Page No. - 88)
(Business Overview, Products Offered, Recent Developments, SWOT Analysis, MnM View)*
13.1 CA Technologies
13.2 Appdynamics
13.3 Splunk
13.4 Dynatrace
13.5 Datadog
13.6 BMC Software
13.7 Sysdig
13.8 Signalfx
13.9 Wavefront
13.10 Coscale
*Details on Business Overview, Products Offered, Recent Developments, SWOT Analysis, MnM View Might Not Be Captured in Case of Unlisted Companies.
14 Appendix (Page No. - 109)
14.1 More Developments
14.1.1 New Product Launches, 2015�2017
14.1.2 Partnerships, Agreements, and Collaborations, 2015�2016
14.1.3 Mergers and Acquisitions, 2015
14.2 Discussion Guide
14.3 Knowledge Store: Marketsandmarkets� Subscription Portal
14.4 Introduction RT: Real-Time Market Intelligence
14.5 Available Customizations
14.6 Related Reports
14.7 Author Details
List of Tables (70 Tables)
Table 1 Global Container Monitoring Market Size and Growth Rate, 2015�2022 (USD Million, Y-O-Y %)
Table 2 Innovation Spotlight: Latest Container Monitoring Innovations
Table 3 Market Size By Component, 2015�2022 (USD Million)
Table 4 Solution: Market Size By Region, 2015�2022 (USD Million)
Table 5 Services: Market Size By Region, 2015�2022 (USD Million)
Table 6 Services: Container Monitoring Market Size By Type, 2015�2022 (USD Million)
Table 7 Professional Services Market Size, By Region, 2015�2022 (USD Million)
Table 8 Professional Services Market Size, By Type, 2015�2022 (USD Million)
Table 9 Training and Development Market Size, By Region, 2015�2022 (USD Million)
Table 10 Consulting and Integration Market Size, By Region, 2015�2022 (USD Million)
Table 11 Support and Maintenance Market Size, By Region, 2015�2022 (USD Million)
Table 12 Managed Services Market Size, By Region, 2015�2022 (USD Million)
Table 13 Container Monitoring Market Size, By Deployment Mode, 2015�2022 (USD Million)
Table 14 Cloud: Market Size By Region, 2015�2022 (USD Million)
Table 15 On-Premises: Market Size By Region, 2015�2022 (USD Million)
Table 16 Market Size By Organization Size, 2015�2022 (USD Million)
Table 17 Small and Medium-Sized Enterprises: Market Size By Region, 2015�2022 (USD Million)
Table 18 Large Enterprises: Market Size By Region, 2015�2022 (USD Million)
Table 19 Container Monitoring Market Size, By Vertical, 2015�2022 (USD Million)
Table 20 Banking, Financial Services, and Insurance: Market Size By Region, 2015�2022 (USD Million)
Table 21 Telecom and IT: Market Size By Region, 2015�2022 (USD Million)
Table 22 Government: Market Size By Region, 2015�2022 (USD Million)
Table 23 Travel and Hospitality: Market Size By Region, 2015�2022 (USD Million)
Table 24 Manufacturing: Market Size By Region, 2015�2022 (USD Million)
Table 25 Healthcare and Life Sciences: Container Monitoring Market Size By Region, 2015�2022 (USD Million)
Table 26 Retail and Ecommerce: Market Size By Region, 2015�2022 (USD Million)
Table 27 Media and Entertainment: Market Size By Region, 2015�2022 (USD Million)
Table 28 Transportation and Logistics: Market Size By Region, 2015�2022 (USD Million)
Table 29 Others: Market Size By Region, 2015�2022 (USD Million)
Table 30 Container Monitoring Market Size By Region, 2017�2022 (USD Million)
Table 31 North America: Market Size By Country, 2015�2022 (USD Million)
Table 32 North America: Market Size By Component, 2015�2022 (USD Million)
Table 33 North America: Market Size By Deployment Mode, 2015�2022 (USD Million)
Table 34 North America: Market Size By Service, 2015�2022 (USD Million)
Table 35 North America: Market Size By Professional Service, 2015�2022 (USD Million)
Table 36 North America: Market Size By Organization Size, 2015�2022 (USD Million)
Table 37 North America: Market Size By Vertical, 2015�2022 (USD Million)
Table 38 Europe: Container Monitoring Market Size, By Country, 2015�2022 (USD Million)
Table 39 Europe: Market Size By Component, 2015�2022 (USD Million)
Table 40 Europe: Market Size By Deployment Mode, 2015�2022 (USD Million)
Table 41 Europe: Market Size By Service, 2015�2022 (USD Million)
Table 42 Europe: Market Size By Professional Service, 2015�2022 (USD Million)
Table 43 Europe: Market Size By Organization Size, 2015�2022 (USD Million)
Table 44 Europe: Market Size By Vertical, 2015�2022 (USD Million)
Table 45 Asia Pacific: Container Monitoring Market Size, By Country, 2015�2022 (USD Million)
Table 46 Asia Pacific: Market Size By Component, 2015�2022 (USD Million)
Table 47 Asia Pacific: Market Size By Deployment Mode, 2015�2022 (USD Million)
Table 48 Asia Pacific: Market Size By Service, 2015�2022 (USD Million)
Table 49 Asia Pacific: Market Size By Professional Service, 2015�2022 (USD Million)
Table 50 Asia Pacific: Market Size By Organization Size, 2015�2022 (USD Million)
Table 51 Asia Pacific: Market Size By Vertical, 2015�2022 (USD Million)
Table 52 Middle East and Africa: Container Monitoring Market Size, By Subregion, 2015�2022 (USD Million)
Table 53 Middle East and Africa: Market Size By Component, 2015�2022 (USD Million)
Table 54 Middle East and Africa: Market Size By Deployment Mode, 2015�2022 (USD Million)
Table 55 Middle East and Africa: Market Size By Service, 2015�2022 (USD Million)
Table 56 Middle East and Africa: Market Size By Professional Service, 2015�2022 (USD Million)
Table 57 Middle East and Africa: Market Size By Organization Size, 2015�2022 (USD Million)
Table 58 Middle East and Africa: Market Size By Vertical, 2015�2022 (USD Million)
Table 59 Latin America: Container Monitoring Market Size, By Country, 2015�2022 (USD Million)
Table 60 Latin America: Market Size By Component, 2015�2022 (USD Million)
Table 61 Latin America: Market Size By Deployment Mode, 2015�2022 (USD Million)
Table 62 Latin America: Market Size By Service, 2015�2022 (USD Million)
Table 63 Latin America: Market Size By Professional Service, 2015�2022 (USD Million)
Table 64 Latin America: Market Size By Organization Size, 2015�2022 (USD Million)
Table 65 Latin America: Market Size By Vertical, 2015�2022 (USD Million)
Table 66 Leadership Mapping in the Container Monitoring Market, 2017
Table 67 New Product Launches, 2017
Table 68 Partnerships and Collaborations, 2016�2017
Table 69 Business Expansions, 2015�2017
Table 70 Mergers and Acquisitions, 2016�2017
List of Figures (35 Figures)
Figure 1 Global Container Monitoring Market Segmentation
Figure 2 Regional Scope
Figure 3 Global Container Monitoring Market: Research Design
Figure 4 Breakdown of Primary Interviews: By Company, Designation, and Region
Figure 5 Data Triangulation
Figure 6 Market Size Estimation Methodology: Bottom-Up Approach
Figure 7 Market Size Estimation Methodology: Top-Down Approach
Figure 8 Container Monitoring Market: Assumptions
Figure 9 Solution Segment is Expected to Grow at A Higher CAGR During the Forecast Period
Figure 10 Training and Development Segment is Expected to Grow at the Highest CAGR During the Forecast Period
Figure 11 Cloud Deployment Mode is Expected to Grow at A Higher CAGR During the Forecast Period
Figure 12 North America is Estimated to Hold the Largest Market Share in 2017
Figure 13 Digital Transformation and Agile Application Development are Expected to Drive the Overall Growth of the Container Monitoring Market During the Forecast Period
Figure 14 Europe is Expected to Witness the Highest CAGR During the Forecast Period
Figure 15 Telecom and IT Vertical is Expected to Have the Highest CAGR During the Forecast Period
Figure 16 Europe is Expected to Exhibit the Highest Growth Potential During the Forecast Period
Figure 17 Container Monitoring Market: Drivers, Restraints, Opportunities, and Challenges
Figure 18 Container Monitoring Architecture
Figure 19 Solution Segment is Expected to Register A Higher CAGR During the Forecast Period
Figure 20 Cloud Deployment Mode is Expected to Exhibit A Higher CAGR During the Forecast Period
Figure 21 Large Enterprises Segment is Expected to Exhibit A Higher CAGR During the Forecast Period
Figure 22 Telecom and IT Vertical is Expected to Have the Highest CAGR During the Forecast Period
Figure 23 Europe is Expected to Exhibit the Highest CAGR During the Forecast Period
Figure 24 North America: Container Monitoring Market Snapshot
Figure 25 Europe: Market Snapshot
Figure 26 Key Developments By the Leading Players in the Container Monitoring Market During 2015�2017
Figure 27 Market Evaluation Framework
Figure 28 CA Technologies: Company Snapshot
Figure 29 CA Technologies: SWOT Analysis
Figure 30 Appdynamics: Company Snapshot
Figure 31 Appdynamics: SWOT Analysis
Figure 32 Splunk: Company Snapshot
Figure 33 Splunk: SWOT Analysis
Figure 34 Dynatrace: SWOT Analysis
Figure 35 Datadog: SWOT Analysis


Growth opportunities and latent adjacency in Container Monitoring Market