Continuous Testing Market by Service (Professional Services and Managed Services), Interface (Web, Mobile, and Desktop), Deployment Type, Organization Size, Industry Vertical, and Region - Global Forecast to 2023


[147 Pages Report] The Continuous Testing Market predicted to grow from $1.01 Billion in 2017 to reach $2.41 Billion by 2023 at a Compound Annual Growth Rate (CAGR) of 15.9% during the forecast period 2018 to 2023, while 2017 has been considered as the base year for estimating the market size.
Objective of the Continuous Testing Market Study
The main objective of this report is to define, describe, and forecast the continuous testing market by service, deployment type, organization size, interface, industry vertical, and region. The report provides detailed information related to the major factors (drivers, restraints, opportunities, and industry-specific challenges), influencing the market growth. The report forecasts the market size with respect to 5 major regions, namely, North America, Europe, Asia Pacific (APAC), the Middle East and Africa (MEA), and Latin America. The report profiles the key players and comprehensively analyzes their core competencies. Moreover, this report tracks and analyzes competitive developments, such as mergers and acquisitions, new product developments, and Research and Development (R&D) activities in the market.
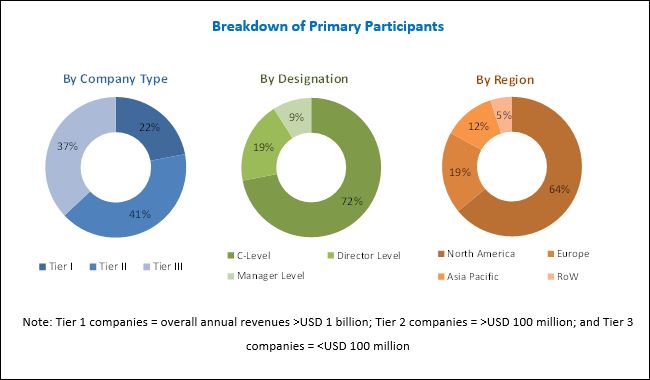
The research methodology used to estimate and forecast the continuous testing market began with the collection and analysis of data on the key vendors� product offerings and business strategies from secondary sources.These secondary sources include IT service providers, technology providers, press releases, investor presentations of companies, white papers, technology journals, certified publications, and articles from recognized authors, directories, and databases, such as D&B Hoovers, Bloomberg Businessweek, and Factiva. Moreover, vendor offerings have been taken into consideration to determine the market segmentation. The bottom-up procedure was employed to arrive at the total market size of the continuous testing market from the revenue of the key market solution and service providers. After arriving at the overall market size, the total market was split into several segments and subsegments, which were then verified through primary research by conducting extensive interviews with the key people, such as Chief Executive Officers (CEOs), Vice Presidents (VPs), directors, and executives.
To know about the assumptions considered for the study, Request for Free Sample Report
Industry Ecosystem
The major vendors in the continuous testing market include Mindtree (India), EPAM Systems (US), HCL Technologies (India), Atos (France), Tech Mahindra (India), Hexaware (India), Tricentis (Austria), Cigniti (India), Larsen and Toubro Infotech (India), NIIT Technologies (India), CA Technologies (US), IBM (US), Capgemini (France), Spirent Communications (UK), Micro Focus (UK), Syntel (US), Cognizant (US), Parasoft (US), Softcrylic (US), LogiGear (US), QualiTest (US), Testplant (UK), Vector Software (US), QA Mentor (US), and SmartBear Software(US).
Key Target Audience for Continuous Testing Market
- Continuous testing providers
- Professional service providers
- Managed service providers
- System integrators
- Cloud vendors
- Research organizations
- Resellers and distributors
Scope of the Continuous Testing Market Study
|
Report Metric |
Details |
|
Market size available for years |
2017�2023 |
|
Base year considered |
2017 |
|
Forecast period |
2018�2023 |
|
Forecast units |
Billion (USD) |
|
Segments covered |
Service, Deployment Type, Organization size, interface, industry vertical and region |
|
Geographies covered |
North America, Europe, APAC, Latin America, and MEA |
|
Companies covered |
Mindtree (India), EPAM Systems (US), HCL Technologies (India), Atos (France), Tech Mahindra (India), Hexaware (India), Tricentis (Austria), Cigniti (India), Larsen and Toubro Infotech (India), NIIT Technologies (India), CA Technologies (US), IBM (US), Capgemini (France), Spirent Communications (UK), Micro Focus (UK), Syntel (US), Cognizant (US), Parasoft (US), Softcrylic (US), LogiGear (US), QualiTest (US), Testplant (UK), Vector Software (US), QA Mentor (US), and SmartBear Software(US). |
The research report categorizes the continuous testing market to forecast the revenues and analyze the trends in each of the following submarkets:
Continuous Testing Market By Service
- Managed Services
- Professional Services
- Implementation
- Advisory and Consulting
- Support and Maintenance
- Training and Education
Market By Interface
- Web
- Desktop
- Mobile
Continuous Testing Market By Deployment Type
- On-premises
- Cloud
Market By Organization Size
- Small and Medium-sized Enterprises (SMEs)
- Large Enterprises
Market By Vertical
- Banking, Financial Services, and Insurance (BFSI)
- Retail and Consumer Goods
- Transportation and Logistics
- Healthcare
- Manufacturing
- Telecom and IT
- Energy and Utilities
- Government
- Media and Entertainment
- Others (Education, and Travel and Hospitality)
Continuous Testing Market By Region
- North America
- Europe
- MEA
- APAC
- Latin America
The continuous testing market is expected to grow from USD 1.15 Billion in 2018 to USD 2.41 Billion by 2023, at a Compound Annual Growth Rate (CAGR) of 15.9% during the forecast period, owing to the growing need for continuous and timely delivery of software. In addition to this, organizations across various industry verticals are looking forward to digital transformation for enhancing their business operations and DevOps going mainstream are the factors that are driving the growth of market. Moreover, enterprises consider continuous testing important, as they help them minimize their business risks associated with their software assets.
The rapidly changing competitive scenarios has encouraged enterprises to adopt continuous testing to facilitate continuous delivery by continual improvement through feedback from business stakeholders, and by proper validation of processes and transactions. The Banking, Financial Services, and Insurance (BFSI) companies deal with critical credit management, collection management, and fraud detection management in its day to day financial operations. BFSI organizations are looking forward to provide customer friendly digital solutions and software platforms, so that they can serve their customers in a better way. The BFSI industry has been a major contributor, in terms of the revenue generated, in the continuous testing market.
The adoption of smart devices, IoT, cloud, and mobile technologies has transformed organizations across various industry verticals. With the help of these technologies, organizations streamline their business flows and operations. Hence, based on the specific nature of their requirements, organizations are customizing their mobile technology solutions. The rapid adoption of the mobile technology and the proliferation of smartphone users have increased the demand for mobile-based software and applications. Many mobile technology vendors help enterprises test their technology platforms that assist them in meeting their business goals. These platforms also help in creating and managing connections with people, machines, and information across enterprises, readily available at any time and anywhere. continuous testing market empowers organizations to seamlessly integrate their software with their existing systems, thereby facilitating them to enhance their business operations through the effective implementation of smart technologies. As a result, the mobile segment is expected to grow at the highest CAGR during the forecast period.
To know about the assumptions considered for the study, download the pdf brochure
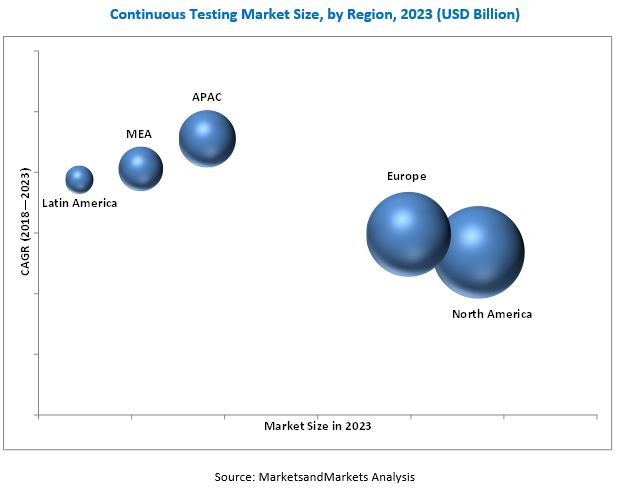
North America is estimated to account for the largest market size and dominate the continuous testing market from 2018 to 2023. This region has a high concentration of BFSI, retail and consumer goods, healthcare, and transportation and logistics companies, which largely contribute to the market. However, the Asia Pacific (APAC) region is expected to provide opportunities for continuous testing service providers. These growth opportunities can be attributed to the increasing commercial investments by several companies in the APAC region. However, the heavy dependency of organizations on traditional testing approaches is expected to restrain the growth of market.
Available Customizations
With the given market data, MarketsandMarkets offers customizations as per the company�s specific needs. The following customization options are available for the report:
Product Analysis
- Product matrix which gives a detailed comparison of the product portfolio of each company
Geographic Analysis
- Further breakdown of the North American continuous testing market into countries
- Further breakdown of the European market into countries
- Further breakdown of the APAC market into countries
- Further breakdown of the MEA market into countries
- Further breakdown of the Latin American market into countries
Company Information
- Detailed analysis and profiling of additional market players
To speak to our analyst for a discussion on the above findings, click Speak to Analyst
Table of Contents
1 Introduction (Page No. - 14)
1.1 Objectives of the Study
1.2 Market Definition
1.3 Market Scope
1.4 Years Considered for the Study
1.5 Currency
1.6 Stakeholders
2 Research Methodology (Page No. - 17)
2.1 Research Data
2.1.1 Secondary Data
2.1.2 Primary Data
2.1.2.1 Breakdown of Primaries
2.1.2.2 Key Industry Insights
2.2 Market Size Estimation
2.3 Research Assumptions
2.4 Limitations
3 Executive Summary (Page No. - 23)
4 Premium Insights (Page No. - 26)
4.1 Attractive Market Opportunities in the Continuous Testing Market
4.2 Market By Service
4.3 Market By Deployment Type
4.4 Market By Organization Size
4.5 Market By Interface
4.6 Market By Industry Vertical and Region
5 Continuous Testing Market Overview (Page No. - 30)
5.1 Introduction
5.2 Market Dynamics
5.2.1 Drivers
5.2.1.1 Devops Going Mainstream
5.2.1.2 Growing Need for Continuous and Timely Delivery
5.2.1.3 Digital Transformations
5.2.2 Restraints
5.2.2.1 Heavy Dependency on Traditional Approaches
5.2.3 Opportunities
5.2.3.1 Advancements in AI, Neural Networks, and Machine Learning Technologies
5.2.3.2 Increasing Adoption of IoT-Enabled Devices
5.2.4 Challenges
5.2.4.1 Heterogeneous Test Environment
5.2.4.2 Lack of Skilled and Experienced Test Automation Professionals
6 Market, By Service (Page No. - 33)
6.1 Introduction
6.2 Managed Services
6.3 Professional Services
6.3.1 Implementation
6.3.2 Advisory and Consulting
6.3.3 Support and Maintenance
6.3.4 Training and Education
7 Continuous Testing Market By Deployment Type (Page No. - 40)
7.1 Introduction
7.2 On-Premises
7.3 Cloud
8 Market By Organization Size (Page No. - 44)
8.1 Introduction
8.2 Small and Medium-Sized Enterprises
8.3 Large Enterprises
9 Continuous Testing Market, By Interface (Page No. - 48)
9.1 Introduction
9.2 Web
9.3 Mobile
9.4 Desktop
10 Market, By Industry Vertical (Page No. - 52)
10.1 Introduction
10.2 Banking, Financial Services, and Insurance
10.3 Retail and Consumer Goods
10.4 Transportation and Logistics
10.5 Healthcare
10.6 Manufacturing
10.7 Telecom and It
10.8 Energy and Utilities
10.9 Government
10.10 Media and Entertainment
10.11 Others
11 Continuous Testing Market, By Region (Page No. - 64)
11.1 Introduction
11.2 North America
11.3 Europe
11.4 Asia Pacific
11.5 Middle East and Africa
11.6 Latin America
12 Competitive Landscape (Page No. - 84)
12.1 Overview
12.2 Market Ranking
12.3 Competitive Scenario
12.3.1 New Product/Service Launches and Product Upgradations
12.3.2 Business Expansions
12.3.3 Acquisitions
12.3.4 Partnerships, Agreements, and Collaborations
13 Company Profiles (Page No. - 90)
(Business Overview, Services Offered, Recent Developments, SWOT Analysis & MnM View)*
13.1 EPAM Systems
13.2 Mindtree
13.3 HCL Technologies
13.4 ATOS
13.5 Tech Mahindra
13.6 Hexaware
13.7 Tricentis
13.8 Cigniti
13.9 Larsen & Toubro Infotech
13.10 NIIT Technologies
13.11 Qualitest
13.12 CA Technologies
13.13 Logigear
13.14 IBM
13.15 Capgemini
13.16 Parasoft
13.17 Softcrylic
13.18 Spirent Communications
13.19 Cognizant
13.20 Micro Focus
13.21 Syntel
13.22 Key Innovators
*Details on Business Overview, Services Offered, Recent Developments, SWOT Analysis & MnM View Might Not Be Captured in Case of Unlisted Companies.
14 Appendix (Page No. - 137)
14.1 Key Industry Insights
14.2 Discussion Guide
14.3 Knowledge Store: Marketsandmarkets� Subscription Portal
14.4 Introducing RT: Real Time Market Intelligence
14.5 Available Customizations
14.6 Related Reports
14.7 Author Details
List of Tables (66 Tables)
Table 1 United States Dollar Exchange Rate
Table 2 Continuous Testing Market Size, By Service, 2016�2023 (USD Million)
Table 3 Managed Services: Market Size By Region, 2016�2023 (USD Million)
Table 4 Professional Services: Market Size By Type, 2016�2023 (USD Million)
Table 5 Professional Services: Market Size By Region, 2016�2023 (USD Million)
Table 6 Implementation Market Size, By Region, 2016�2023 (USD Million)
Table 7 Advisory and Consulting Market Size, By Region, 2016�2023 (USD Million)
Table 8 Support and Maintenance Market Size, By Region, 2016�2023 (USD Million)
Table 9 Training and Education Market Size, By Region, 2016�2023 (USD Million)
Table 10 Continuous Testing Market Size, By Deployment Type, 2016�2023 (USD Million)
Table 11 On-Premises: Market Size By Region, 2016�2023 (USD Million)
Table 12 Cloud: Market Size By Region, 2016�2023 (USD Million)
Table 13 Market Size By Organization Size, 2016�2023 (USD Million)
Table 14 Small and Medium-Sized Enterprises: Market Size By Region, 2016�2023 (USD Million)
Table 15 Large Enterprises: Market Size By Region, 2016�2023 (USD Million)
Table 16 Market Size By Interface, 2016�2023 (USD Million)
Table 17 Web: Market Size By Region, 2016�2023 (USD Million)
Table 18 Mobile: Market Size By Region, 2016�2023 (USD Million)
Table 19 Desktop: Market Size By Region, 2016�2023 (USD Million)
Table 20 Continuous Testing Market Size, By Industry Vertical, 2016�2023 (USD Million)
Table 21 Banking, Financial Services, and Insurance: Market Size By Region, 2016�2023 (USD Million)
Table 22 Retail and Consumer Goods: Market Size By Region, 2016�2023 (USD Million)
Table 23 Transportation and Logistics: Market Size By Region, 2016�2023 (USD Million)
Table 24 Healthcare: Market Size By Region, 2016�2023 (USD Million)
Table 25 Manufacturing: Market Size By Region, 2016�2023 (USD Million)
Table 26 Telecom and It: Market Size By Region, 2016�2023 (USD Million)
Table 27 Energy and Utilities: Market Size By Region, 2016�2023 (USD Million)
Table 28 Government: Market Size By Region, 2016�2023 (USD Million)
Table 29 Media and Entertainment: Market Size By Region, 2016�2023 (USD Million)
Table 30 Others: Market Size By Region, 2016�2023 (USD Million)
Table 31 Continuous Testing Market Size, By Region, 2016�2023 (USD Million)
Table 32 North America: Market Size By Service, 2016�2023 (USD Million)
Table 33 North America: Market Size By Professional Service, 2016�2023 (USD Million)
Table 34 North America: Market Size By Deployment Type, 2016�2023 (USD Million)
Table 35 North America: Market Size By Organization Size, 2016�2023 (USD Million)
Table 36 North America: Market Size By Interface, 2016�2023 (USD Million)
Table 37 North America: Market Size By Industry Vertical, 2016�2023 (USD Million)
Table 38 Europe: Market Size, By Service, 2016�2023 (USD Million)
Table 39 Europe: Market Size By Professional Service, 2016�2023 (USD Million)
Table 40 Europe: Market Size By Deployment Type, 2016�2023 (USD Million)
Table 41 Europe: Market Size By Organization Size, 2016�2023 (USD Million)
Table 42 Europe: Market Size By Interface, 2016�2023 (USD Million)
Table 43 Europe: Market Size By Industry Vertical, 2016�2023 (USD Million)
Table 44 Asia Pacific: Continuous Testing Market Size, By Service, 2016�2023 (USD Million)
Table 45 Asia Pacific: Market Size By Professional Service, 2016�2023 (USD Million)
Table 46 Asia Pacific: Market Size By Deployment Type, 2016�2023 (USD Million)
Table 47 Asia Pacific: Market Size By Organization Size, 2016�2023 (USD Million)
Table 48 Asia Pacific: Market Size By Interface, 2016�2023 (USD Million)
Table 49 Asia Pacific: Market Size By Industry Vertical, 2016�2023 (USD Million)
Table 50 Middle East and Africa: Continuous Testing Market Size, By Service, 2016�2023 (USD Million)
Table 51 Middle East and Africa: Market Size By Professional Service, 2016�2023 (USD Million)
Table 52 Middle East and Africa: Market Size By Deployment Type, 2016�2023 (USD Million)
Table 53 Middle East and Africa: Market Size By Organization Size, 2016�2023 (USD Million)
Table 54 Middle East and Africa: Market Size By Interface, 2016�2023 (USD Million)
Table 55 Middle East and Africa: Market Size By Industry Vertical, 2016�2023 (USD Million)
Table 56 Latin America: Market Size, By Service, 2016�2023 (USD Million)
Table 57 Latin America: Market Size By Professional Service, 2016�2023 (USD Million)
Table 58 Latin America: Market Size By Deployment Type, 2016�2023 (USD Million)
Table 59 Latin America: Market Size By Organization Size, 2016�2023 (USD Million)
Table 60 Latin America: Market Size By Interface, 2016�2023 (USD Million)
Table 61 Latin America: Market Size By Industry Vertical, 2016�2023 (USD Million)
Table 62 Market Ranking for the Continuous Testing Market, 2018
Table 63 New Product/Service Launches and Product Upgradations, 2016�2017
Table 64 Business Expansions, 2017
Table 65 Acquisitions, 2016�2017
Table 66 Partnerships, Agreements, Collaborations, and Contracts, 2016�2017
List of Figures (48 Figures)
Figure 1 Continuous Testing Market Segmentation
Figure 2 Market Research Design
Figure 3 Breakdown of Primary Interviews: By Company, Designation, and Region
Figure 4 Data Triangulation
Figure 5 Market Size Estimation Methodology: Bottom-Up Approach
Figure 6 Market Size Estimation Methodology: Top-Down Approach
Figure 7 Continuous Testing Market: Assumptions
Figure 8 Top 3 Segments With the Largest Market Shares in 2018
Figure 9 Market Regional Snapshot
Figure 10 The Growing Need for the Continuous and Timely Delivery of Software is Expected to Drive the Growth of the Continuous Testing Market
Figure 11 Managed Services Segment is Expected to Grow at A Higher CAGR During the Forecast Period
Figure 12 Cloud Deployment Type is Expected to Grow at A Higher CAGR During the Forecast Period
Figure 13 Small and Medium-Sized Enterprises Segment is Expected to Grow at A Higher CAGR During the Forecast Period
Figure 14 Mobile Interface is Expected to Grow at the Highest CAGR During the Forecast Period
Figure 15 Banking, Financial Services, and Insurance Industry Vertical, and North America are Estimated to Dominate the Continuous Testing Services Market in 2018
Figure 16 Continuous Testing Market: Drivers, Restraints, Opportunities, and Challenges
Figure 17 Managed Services Segment is Expected to Grow at A Higher CAGR During the Forecast Period
Figure 18 Implementation Segment is Expected to Have the Highest CAGR During the Forecast Period
Figure 19 Cloud Deployment Type is Expected to Grow at A Higher CAGR During the Forecast Period
Figure 20 Small and Medium-Sized Enterprises Segment is Expected to Grow at A Higher CAGR During the Forecast Period
Figure 21 Mobile Interface is Expected to Grow at the Highest CAGR During the Forecast Period
Figure 22 Retail and Consumer Goods Vertical is Expected to Grow at the Highest CAGR During the Forecast Period
Figure 23 Asia Pacific is Expected to Register the Highest CAGR During the Forecast Period
Figure 24 North America: Market Snapshot
Figure 25 Asia Pacific: Market Snapshot
Figure 26 Key Developments By the Leading Players in the Continuous Testing Services Market, 2015�2018
Figure 27 Continuous Testing Market Evaluation Framework
Figure 28 EPAM Systems: Company Snapshot
Figure 29 EPAM Systems: SWOT Analysis
Figure 30 Mindtree: Company Snapshot
Figure 31 Mindtree: SWOT Analysis
Figure 32 HCL Technologies: Company Snapshot
Figure 33 HCL Technologies: SWOT Analysis
Figure 34 ATOS: Company Snapshot
Figure 35 ATOS: SWOT Analysis
Figure 36 Tech Mahindra: Company Snapshot
Figure 37 Tech Mahindra: SWOT Analysis
Figure 38 Hexaware: Company Snapshot
Figure 39 Cigniti: Company Snapshot
Figure 40 Larsen & Toubro Infotech: Company Snapshot
Figure 41 NIIT Technologies: Company Snapshot
Figure 42 CA Technologies: Company Snapshot
Figure 43 IBM: Company Snapshot
Figure 44 Capgemini: Company Snapshot
Figure 45 Spirent Communications: Company Snapshot
Figure 46 Cognizant: Company Snapshot
Figure 47 Micro Focus: Company Snapshot
Figure 48 Syntel: Company Snapshot


Growth opportunities and latent adjacency in Continuous Testing Market