Cross-linked Polyethylene (PEX) Market

Cross-linked Polyethylene (PEX) Market by Type (HDPE, LDPE), Technology (PEXa, PEXb, PEXc), End-use Industry (Wires & Cables, Plumbing, Automotive), Region (North America, Europe, Asia Pacific, South America, MEA) - Global Forecast to 2028

Report Code: CH 4904 Oct, 2023, by marketsandmarkets.com

The cross-linked polyethylene (PEX) market is projected to grow from USD 7.6 billion in 2023 to USD 11.0 billion by 2028, recording a CAGR of 7.6% during the forecast period. The expansion of the cross-linked polyethylene (PEX) market is primarily propelled by several key factors. One significant driver is the increasing demand for cross-linked polyethylene (PEX) in the automotive sector, where it finds extensive use in wiring and cable applications. Additionally, the construction industry, both in terms of pipes and wiring applications, has been a pivotal growth contributor. These trends are particularly pronounced in the emerging economies of the Asia Pacific region.

In the automotive sector, cross-linked polyethylene (PEX) has gained prominence due to its excellent electrical insulation properties and durability, making it a preferred choice for wiring and cable systems. As the automotive industry continues to evolve and expand, especially in Asia Pacific, the demand for cross-linked polyethylene (PEX) in this sector is expected to remain robust.

Furthermore, the construction industry, which includes applications like pipes and wiring, has witnessed a surge in the utilization of cross-linked polyethylene (PEX). Its flexibility, corrosion resistance, and ease of installation make it an attractive option for various construction projects. In the context of Asia Pacific, where rapid urbanization and infrastructure development are ongoing, the adoption of cross-linked polyethylene (PEX) in construction applications is poised for continued growth.

Another crucial factor driving the cross-linked polyethylene (PEX) market is the increasing need for plastic pipes in the global solar industry. Solar energy has gained significant traction as a renewable energy source, and cross-linked polyethylene (PEX) pipes play a pivotal role in solar thermal systems. These pipes are well-suited for transporting heat transfer fluids in solar panels due to their thermal resistance and durability. As the global shift towards renewable energy sources like solar power continues to gain momentum, the demand for cross-linked polyethylene (PEX) in the solar industry is expected to rise steadily.
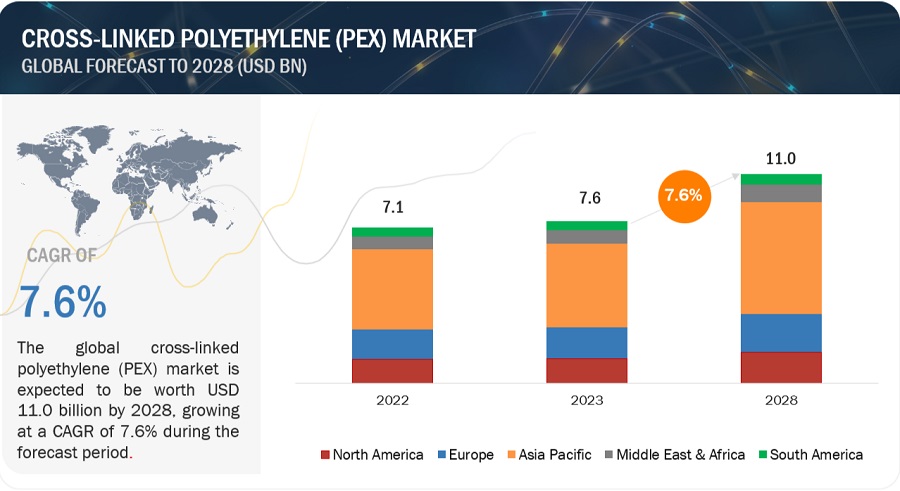
Cross-linked Polyethylene (PEX) Market

To know about the assumptions considered for the study, Request for Free Sample Report
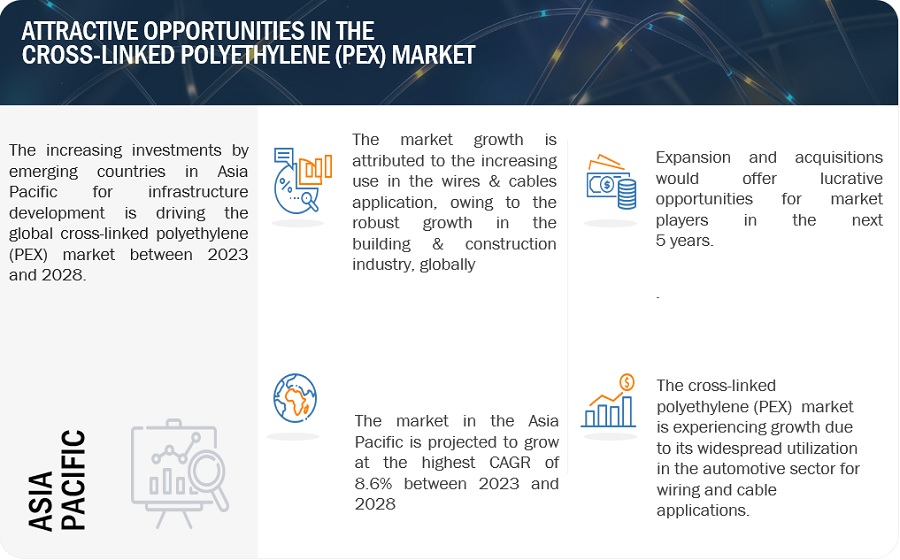
Cross-linked Polyethylene (PEX) Market

Cross-linked polyethylene (PEX) Market Dynamics

Driver: Growth in Automotive industry

In today’s rapidly evolving technological landscape, the growth of the automotive industry stands out as a key driving force for cross-linked polyethylene (PEX) market. Automotive is one of the fastest-growing application segments in the global Cross-linked polyethylene (PEX) market. One of the primary reasons behind this is the increasing utilization of cross-linked polyethylene (PEX) in the production of various automobile parts and components. This includes applications in automotive wiring systems, where PEX is valued for its electrical insulation properties, durability, and resistance to extreme temperatures. The growth of the automobile industry directly translates into an increased demand for PEX materials to be integrated into these components. Additionally, the declining market share of PVC (Polyvinyl Chloride) in automotive applications is driving the search for alternative materials. Cross-linked polyethylene (PEX) is well-positioned to fill this gap. Its superior characteristics, such as resistance to chemical corrosion and enhanced mechanical properties, make it an attractive choice for insulation in automotive wires and cables. Consequently, the demand for PEX in this specific application is anticipated to rise significantly in the near future.

Restraints: Safety issues and chances of plumbing failure

PEX piping systems have their own set of limitations. One notable concern is the potential for PEX pipes to fail under certain conditions. This is mainly because PEX is highly flexible and ductile, allowing for the installation of bends. However, if these bends are too sharp or steep, they can put excessive stress on the PEX material, leading to failures. Additionally, pipes can fail when exposed to chlorine within the water or due to overexposure to sunlight before installation, and as far as fittings are concerned, the main failure in a brass fitting used with cross-linked polyethylene (PEX) is caused by dezincification.

Another drawback of PEX is its susceptibility to oxidative degradation and embrittlement when exposed to hot chlorinated water. This contrasts with CPVC, which is not vulnerable to damage from chlorinated water. While working with drinkable water supplies, it is quite common that the water comes from the water treatment facility with a small level of chlorine in it to disinfect the water supply. However, in cross-linked polyethylene (PEX) pipes, chlorine can cause oxidation on the inner wall of the pipes. To combat this issue, PEX pipes are typically infused with significant amounts of antioxidant stabilizers during manufacturing to prevent them from becoming brittle.

Opportunity: Increased demand for cross-linked HDPE

Cross-linked high-density polyethylene (HDPE) holds a significant share in the cross-linked polyethylene (PEX) market, and its dominance can be attributed to several key factors. Notably, its higher density, superior strength, and enhanced chemical resistance contribute to creating valuable opportunities for increased product sales. One noteworthy aspect to consider is the material's greater density, which sets it apart in terms of performance. This attribute not only adds to its overall strength but also enhances its resistance to various chemicals. These characteristics collectively bolster its appeal in the market and pave the way for its growth.

A pivotal driver of its market expansion is the rising demand for pipes and tubing. This burgeoning demand signifies a promising trajectory for cross-linked HDPE within the cross-linked polyethylene (PEX) market. The material's unique properties position it as a preferred choice in this context, aligning with the industry's evolving needs. Moreover, cross-linked HDPE is finding increased application in chemical storage tanks, demonstrating its versatility and competitive edge over alternative materials. It outperforms substitutes like linear polyethylene, fiberglass-reinforced plastic, and stainless steel in various aspects, such as durability, corrosion resistance, and cost-effectiveness. This growing adoption in chemical storage solutions further bolsters the development and expansion of the cross-linked polyethylene (PEX) market, solidifying the position of cross-linked HDPE as a pivotal player in this arena.

Challenges: Fluctuations in the prices of raw materials

Fluctuations in the prices of raw materials, particularly polyethylene, and various cross-linking agents, along with the broader volatility in crude oil prices, have emerged as significant challenges in the cross-linked polyethylene (PEX) market. PEX is a widely used material in plumbing, heating, and insulation applications due to its flexibility, durability, and cost-effectiveness. However, its production heavily relies on polyethylene and cross-linking agents, which are derived from crude oil. The fluctuation of crude oil prices also puts cross-linked polyethylene (PEX) producers in adverse situations, which, in turn, affects the profitability models. As crude oil prices fluctuate due to geopolitical tensions, supply and demand imbalances, and other economic factors, the PEX industry faces a precarious situation. These price variations directly impact manufacturing costs, forcing PEX producers to constantly adapt their pricing strategies. Such uncertainty can have ripple effects throughout the supply chain, affecting both manufacturers and consumers, posing a challenge for businesses operating in the PEX market. The changing crude oil prices in the last few years have affected the polymer value chain and caused a similar trend in the unit prices of the basic raw material, primarily polyethylene, which directly affects the cross-linked polyethylene (PEX) market. This fluctuation can mount pressure on the cross-linked polyethylene (PEX) producers to reduce the prices of cross-linked polyethylene (PEX) products to have a competitive edge in the market..

Market Ecosystem
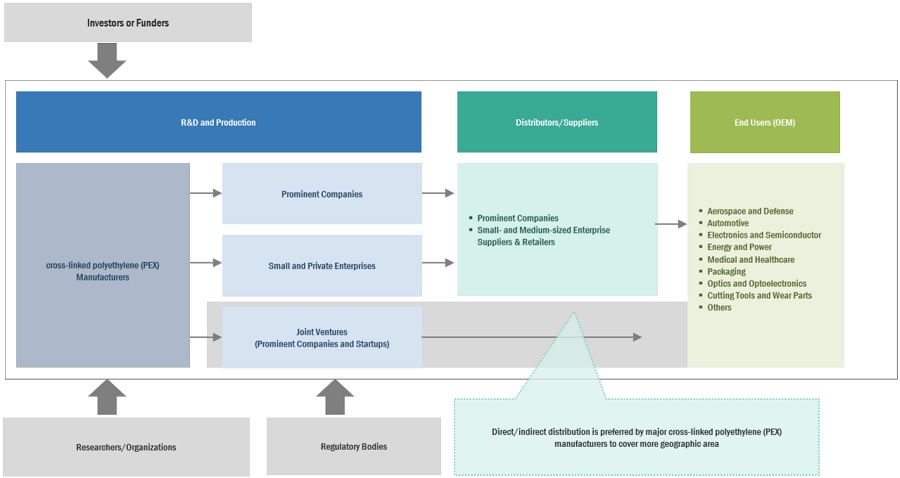
Cross-linked Polyethylene (PEX) Market Ecosystem

By type, HDPE segment is estimated to dominate the overall cross-linked polyethylene (PEX) market.

HDPE is expected to be the largest type of cross-linked polyethylene (PEX)used globally in terms of both value and volume. Cross-linked High-Density Polyethylene (HDPE) stands as a versatile material of choice for plumbing applications due to its exceptional blend of properties. One prominent application of HDPE is in the manufacturing of pipes and tubing, and it has gained considerable prominence in the construction and industrial sectors. HDPE pipes are renowned for their ease of installation. Their lightweight nature and flexibility enable rapid deployment, reducing labor and installation costs. This swiftness in installation can be especially advantageous in time-sensitive projects. The flexibility of HDPE pipes is also a pivotal feature. It allows them to adapt to different terrains and ground movements without compromising their structural integrity. This flexibility ensures a longer service life for the pipelines, as they can withstand ground shifts and settle into their surroundings. Additionally, the most appealing aspects of HDPE pipes is their cost-effectiveness. Their low material and installation costs contribute to overall project savings. Furthermore, their longevity and resistance to corrosion result in lower maintenance and replacement costs over the long term.

By technology, PEXa segment is estimated to dominate the overall cross-linked polyethylene (PEX) market.

PEXa is expected to be the largest technology of cross-linked polyethylene (PEX)used globally in terms of both value and volume. The PEXa technology uses peroxide cross-linking to produce cross-linked polyethylene (PEX). It is the most common method used for the cross-linking of polyethylene. In this method, organic peroxide, generally in its original form, is used as an initiator. The peroxide process performs "hot" cross-linking above the crystal melting point. This process takes slightly longer than the other two methods as the polymer has to be kept at a higher temperature and pressure for long periods during the extrusion of the material. The reaction takes place until all peroxide is consumed or the temperature falls below the decomposition point and finally leads to the three-dimensional cross-linked structure of polyethylene. Dicumyl peroxide (DCP) is widely used for cross-linking of thermoplastics. The cross-linking efficiency of DCP is more than other peroxides. This technology provides the highest flexibility (softness) and the highest degree of cross-linking compared to other technology types.

By end-use industry, wires & cables is the largest market for cross-linked polyethylene (PEX).

By end-use industry, Wires & cables is the largest end-use industry of cross-linked polyethylene (PEX). Cross-linked polyethylene (PEX) has found significant applications in the wires and cables industry due to its excellent electrical and mechanical properties. PEX is commonly used as insulation and jacketing material for various types of cables and wires, and its demand is expected to increase in the future for several reasons. In the wires and cables industry, PEX is used primarily as an insulation material for power cables and communication cables. Its high-temperature resistance, electrical insulation properties, and resistance to moisture make it an ideal choice for protecting the conductive elements within the cables. PEX's ability to maintain its structural integrity even in extreme conditions, such as high heat or exposure to chemicals, makes it a durable and reliable option for long-lasting cable insulation. Furthermore, PEX is valued for its flexibility and ease of installation. Its flexibility allows for easier bending and routing of cables, reducing the labor and time required for installation. This is particularly advantageous in the construction and infrastructure sectors, where the demand for efficient and cost-effective cable installation solutions is high. The ongoing development of global infrastructure, including the expansion of power grids, telecommunications networks, and renewable energy projects, will drive the demand for high-quality cables and wires. PEX's versatility and reliability position it as a suitable material to meet these demands.

Asia Pacific is expected to be the largest market during the forecast period

The Crossed-Linked Polyethylene (PEX) market in Asia Pacific is projected to register the highest CAGR between 2023 and 2028. Asia Pacific leads the global Crossed-Linked Polyethylene (PEX) market in terms of volume and value The Asia Pacific region is experiencing a rising demand for Crossed-Linked Polyethylene (PEX) across various sectors, including plumbing, wires & cables, and automotive applications, with a particular focus on China, Japan, and India. This surge in demand is primarily propelled by several factors. These include the continuous expansion of the construction industry, heightened research and development efforts by major industry players, the ready availability of raw materials, and the implementation of strategies to cater to the increasing demand for cross-linked polyethylene (PEX) in both well-established and emerging applications. One of the driving forces behind this market growth is the consistent increase in construction expenditures, particularly in emerging nations such as India and Indonesia. Additionally, substantial investments in industrial and public infrastructure projects are contributing significantly to the expansion of the PEX market in the Asia Pacific region.
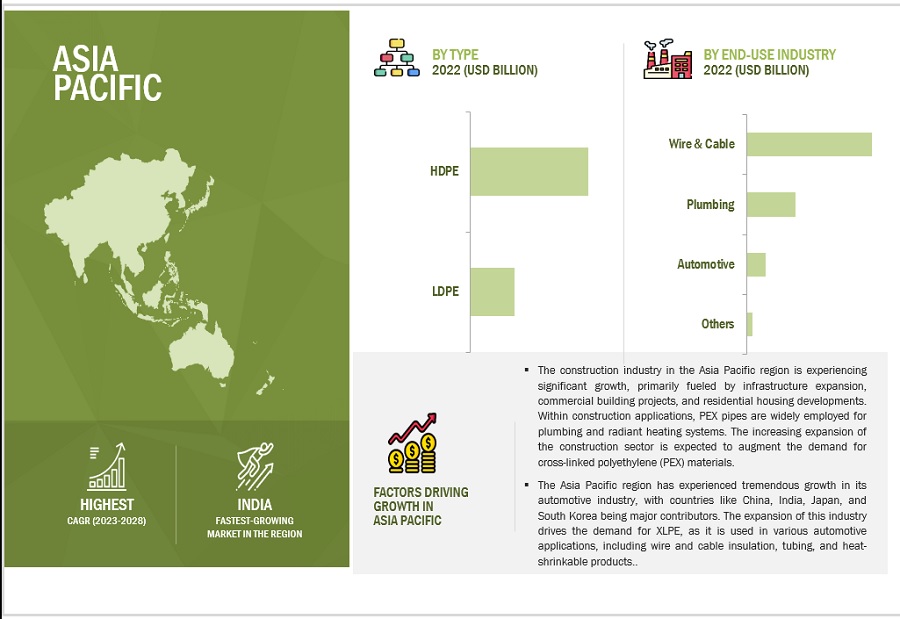
Cross-linked Polyethylene (PEX) Market by Region

To know about the assumptions considered for the study, download the pdf brochure

Key Market Players

The major key players in the cross-linked polyethylene (PEX) market include Dow, Inc. (US), Borealis AG (Austria), LyondellBasell Industries Holding B.V. (Netherlands), Avient Corporation (US), Exxon Mobil Corporation (US), Finproject S.p.A. (Italy), SACO AEI Polymers (US), HDC Hyundai EP Company (South Korea) and 3H Vinacom Co., Ltd (China)

Get online access to the report on the World's First Market Intelligence Cloud

  • Easy to Download Historical Data & Forecast Numbers
  • Company Analysis Dashboard for high growth potential opportunities
  • Research Analyst Access for customization & queries
  • Competitor Analysis with Interactive dashboard
  • Latest News, Updates & Trend analysis
Request Sample

Scope of the Report

:

Report Metric

Details

Years Considered

2021–2028

Base year

2022

Forecast period

2023–2028

Unit considered 

Value (USD Million), Volume (Kiloton)

Segments

Type, Technology, End-use Industry, and Region

Regions

North America, Asia Pacific, Europe, South America, and the Middle East & Africa

Companies

The major players are Dow, Inc. (US), Borealis AG (Austria), LyondellBasell Industries Holding B.V. (Netherlands), Avient Corporation (US), Exxon Mobil Corporation (US), Finproject S.p.A. (Italy), SACO AEI Polymers (US), HDC Hyundai EP Company (South Korea) and 3H Vinacom Co., Ltd (China)

This research report categorizes the global cross-linked polyethylene (PEX) market based on Technology, End-use Industry and Region

The cross-linked polyethylene (PEX)Market, By Type:
The cross-linked polyethylene (PEX)Market, By Technology:
  • PEXa
  • PEXb
  • PEXc
The cross-linked polyethylene (PEX)Market, By End-use Industry:
The cross-linked polyethylene (PEX)Market, By Region:
  • Asia Pacific
  • Europe
  • North America
  • Middle East & Africa
  • South America

Recent Developments

  • In July 2023, LyondellBasell acquired a 50% stake in Stiphout Industries B.V., a Dutch recycling company. The acquisition is part of LyondellBasell's strategy to invest in recycling and plastic waste processing companies.
  • In February 2023, Borealis, Neste, Uponor, and Wastewise Group have collaborated to successfully produce pipes made of cross-linked polyethylene (PEX) based on feedstock gained from chemically recycled post-industrial waste plastic from PEX pipe production.
  • In June 2022, Borealis Bornewables and Uponor have collaborated to create the world's first cross-linked polyethylene (PEX) pipes based on renewable feedstock. The new PEX Pipe Blue products are made from Borealis' Bornewables polyethylene (PE), which is derived from second-generation natural resources, such as waste from pulp production or residues from food processing oils. This makes the PEX Pipe Blue products up to 90% more sustainable than conventional fossil-based PE-X pipes.
  • In September 2021, Versalis, Eni's chemical company, acquired full ownership of Finproject, including its subsidiary Padanaplast, while retaining all of the existing management and employees. This strategic merger aims to establish a leading supply chain in the specialty polymer market, enhancing Versalis' competitive position.
  • In August 2020, Borealis completed the acquisition of a controlling stake in South Korean compounder DYM Solution Co. Ltd. The acquisition solidifies Borealis' position as a partner of choice for global wire and cable customers. DYM Solution is a leading compounder in South Korea, with a focus on semi-conductive, halogen-free flame retardant (HFFR), rubber, and silane cross-linkable compounds. The acquisition will give Borealis a strong foothold in the growing South Korean wires & cables market and will also expand its global reach.

Frequently Asked Questions (FAQ):

To speak to our analyst for a discussion on the above findings, click Speak to Analyst

TABLE OF CONTENTS
 
1 INTRODUCTION (Page No. - 41)
    1.1 STUDY OBJECTIVES 
    1.2 MARKET DEFINITION 
    1.3 STUDY SCOPE 
           1.3.1 MARKETS COVERED
           1.3.2 REGIONS COVERED
           1.3.3 YEARS CONSIDERED
           1.3.4 INCLUSIONS AND EXCLUSIONS
    1.4 CURRENCY CONSIDERED 
    1.5 UNITS CONSIDERED 
    1.6 LIMITATIONS 
    1.7 STAKEHOLDERS 
    1.8 SUMMARY OF CHANGES 
 
2 RESEARCH METHODOLOGY (Page No. - 46)
    2.1 RESEARCH DATA 
          FIGURE 1 CROSS-LINKED POLYETHYLENE (PEX) MARKET: RESEARCH DESIGN
           2.1.1 SECONDARY DATA
                    2.1.1.1 Key data from secondary sources
           2.1.2 PRIMARY DATA
                    2.1.2.1 Key data from primary sources
                    2.1.2.2 Key industry insights
                    2.1.2.3 Breakdown of primary interviews
    2.2 BASE NUMBER CALCULATION 
           2.2.1 SUPPLY-SIDE APPROACH
                    FIGURE 2 CROSS-LINKED POLYETHYLENE MARKET (PEX) MARKET SIZE CALCULATION: SUPPLY-SIDE ANALYSIS
           2.2.2 DEMAND-SIDE APPROACH
                    FIGURE 3 CROSS-LINKED POLYETHYLENE MARKET (PEX) SIZE CALCULATION: DEMAND-SIDE ANALSIS
    2.3 MARKET SIZE ESTIMATION 
           2.3.1 TOP-DOWN APPROACH
                    FIGURE 4 CROSS-LINKED POLYETHYLENE (PEX) MARKET SIZE ESTIMATION: TOP-DOWN APPROACH
           2.3.2 BOTTOM-UP APPROACH
                    FIGURE 5 CROSS-LINKED POLYETHYLENE (PEX) MARKETSIZE ESTIMATION: BOTTOM-UP APPROACH
    2.4 MARKET BREAKDOWN AND DATA TRIANGULATION 
          FIGURE 6 DATA TRIANGULATION
    2.5 RESEARCH ASSUMPTIONS 
    2.6 STUDY LIMITATIONS 
           2.6.1 RECESSION IMPACT
 
3 EXECUTIVE SUMMARY (Page No. - 55)
    FIGURE 7 HDPE TO BELARGEST TYPE SEGMENT IN 2023
    FIGURE 8 PEXA TO BE FASTEST-GROWING TECHNOLOGY SEGMENT DURING FORECAST PERIOD
    FIGURE 9 WIRES & CABLES TO BE LARGEST END-USE INDUSTRY SEGMENT DURING FORECAST PERIOD
    FIGURE 10 ASIA PACIFIC DOMINATED MARKET IN 2022
 
4 PREMIUM INSIGHTS (Page No. - 59)
    4.1 ATTRACTIVE OPPORTUNITIES IN CROSS-LINKED POLYETHYLENE (PEX) MARKET 
          FIGURE 11 INCREASING USE OF CROSS-LINKED POLYETHYLENE (PEX) IN BUILDING & CONSTRUCTION INDUSTRY TO DRIVE MARKET DURING FORECAST PERIOD
    4.2 CROSS-LINKED POLYETHYLENE (PEX) MARKET GROWTH, BY TYPE 
          FIGURE 12 HDPE TYPE SEGMENT TO LEAD MARKET DURING FORECAST PERIOD
    4.3 ASIA PACIFIC CROSS-LINKED POLYETHYLENE (PEX) MARKET,  BY TYPE AND COUNTRY 
          FIGURE 13 HDPE AND CHINA ACCOUNTED FOR LARGEST SHARES OF MARKET IN 2022
    4.4 CROSS-LINKED POLYETHYLENE (PEX) MARKET, BY END-USE INDUSTRY 
          FIGURE 14 WIRES & CABLES TO BE LARGEST END-USE INDUSTRY SEGMENT DURING FORECAST PERIOD
    4.5 CROSS-LINKED POLYETHYLENE (PEX) MARKET, BY TECHNOLOGY 
          FIGURE 15 PEXA TO BE LARGEST TECHNOLOGY SEGMENT DURING FORECAST PERIOD
    4.6 CROSS-LINKED POLYETHYLENE (PEX) MARKET, BY COUNTRY 
          FIGURE 16 CHINA TO REGISTER HIGHEST GROWTH DURING FORECAST PERIOD
 
5 MARKET OVERVIEW (Page No. - 62)
    5.1 INTRODUCTION 
    5.2 MARKET DYNAMICS 
          FIGURE 17 DRIVERS, RESTRAINTS, OPPORTUNITIES, AND CHALLENGES IN CROSS-LINKED POLYETHYLENE (PEX) MARKET
           5.2.1 DRIVERS
                    5.2.1.1 Superior properties compared to conventional materials
                    5.2.1.2 Growth in automotive industry
                                FIGURE 18 GLOBAL VEHICLE PRODUCTION, 2021 VS 2022
                    5.2.1.3 Extensive use in medical packaging industry
                    5.2.1.4 Growth in solar energy sector
           5.2.2 RESTRAINTS
                    5.2.2.1 Susceptibility to degradation due to sunlight and perforation by insects
                    5.2.2.2 Safety issues and chances of plumbing failure
           5.2.3 OPPORTUNITIES
                    5.2.3.1 Increased demand for cross-linked HDPE
           5.2.4 CHALLENGES
                    5.2.4.1 Rise in preference for polypropylene pipes
                    5.2.4.2 Fluctuation in raw material prices
 
6 INDUSTRY TRENDS (Page No. - 69)
    6.1 TRENDS & DISRUPTIONS IMPACTING CUSTOMERS’ BUSINESSES 
          FIGURE 19 REVENUE SHIFT FOR CROSS-LINKED POLYETHYLENE (PEX) MANUFACTURERS
    6.2 PRICING ANALYSIS 
           6.2.1 PRICING ANALYSIS BASED ON REGION
           6.2.2 PRICING ANALYSIS BASED ON TYPE
           6.2.3 CHANGES IN CROSS-LINKED POLYETHYLENE (PEX) PRICING IN 2022
    6.3 VALUE CHAIN ANALYSIS 
          FIGURE 20 VALUE CHAIN ANALYSIS OF CROSS-LINKED POLYETHYLENE (PEX) MARKET
    6.4 ECOSYSTEM MAPPING 
          FIGURE 21 CROSS-LINKED POLYETHYLENE (PEX) MARKET: ECOSYSTEM MAPPING
          TABLE 1 ECOSYSTEM OF CROSS-LINKED POLYETHYLENE (PEX) MARKET
    6.5 TECHNOLOGY ANALYSIS 
           6.5.1 PEROXIDE TECHNOLOGY
           6.5.2 SILANE GRAFTING TECHNOLOGY
           6.5.3 ELECTRON BEAM TECHNOLOGY
           6.5.4 THERMOPLASTICIZING TECHNOLOGY FOR RECYCLING OF PEX
           6.5.5 ADVANCEMENTS IN ELECTRICAL AND THERMAL INSULATION PROPERTIES BY USING NANOCOMPOSITES (NANO FILLERS)
    6.6 PATENT ANALYSIS 
           6.6.1 INTRODUCTION
           6.6.2 METHODOLOGY
           6.6.3 DOCUMENT TYPES
                    TABLE 2 TOTAL NUMBER OF PATENTS GRANTED IN CROSS-LINKED POLYETHYLENE MARKET
                    FIGURE 22 CROSS-LINKED POLYETHYLENE: GRANTED PATENTS, LIMITED PATENTS, AND PATENT APPLICATIONS
                    FIGURE 23 PUBLICATION TRENDS, 2013–2022
           6.6.4 INSIGHTS
                    FIGURE 24 JURISDICTION ANALYSIS (2013–2022)
           6.6.5 TOP COMPANIES/APPLICANTS
                    FIGURE 25 TOP APPLICANTS OF CROSS-LINKED POLYETHYLENE TILL 2022
                    TABLE 3 PATENTS GRANTED IN CROSS-LINKED POLYETHYLENE MARKET, 2020-2022
    6.7 TRADE ANALYSIS 
          TABLE 4 EXPORT SCENARIO, HS CODE 3917, ENCOMPASSING PLASTIC TUBES, PIPES, HOSES, AND RELATED FITTINGS SUCH AS JOINTS, ELBOWS, AND FLANGES, 2022 (USD BILLION)
          TABLE 5 IMPORT SCENARIO, HS CODE 3917, ENCOMPASSING PLASTIC TUBES, PIPES, HOSES, AND RELATED FITTINGS SUCH AS JOINTS, ELBOWS, AND FLANGES, 2022 (USD BILLION)
    6.8 KEY CONFERENCES AND EVENTS IN 2023–2024 
          TABLE 6 CROSS-LINKED POLYETHYLENE (PEX) MARKET: DETAILED LIST OF CONFERENCES & EVENTS, 2023–2024
    6.9 REGULATORY BODIES, GOVERNMENT AGENCIES, AND OTHER ORGANIZATIONS 
          TABLE 7 CROSS-LINKED POLYETHYLENE (PEX) MARKET: REGULATORY BODIES, GOVERNMENT AGENCIES, AND OTHER ORGANIZATIONS
    6.10 TARIFF AND REGULATORY LANDSCAPE 
           6.10.1 REGULATIONS AND STANDARDS FOR PEX PIPES
                     TABLE 8 CROSS-LINKED POLYETHYLENE (PEX) MARKET: DETAILED LIST OF REGULATIONS AND STANDARDS FOR PEX PIPES
           6.10.2 REGULATIONS AND STANDARDS FOR PEX CABLES
                     TABLE 9 CROSS-LINKED POLYETHYLENE (PEX) MARKET: DETAILED LIST OF REGULATIONS AND STANDARDS FOR PEX CABLES
    6.11 PORTER’S FIVE FORCES ANALYSIS 
           FIGURE 26 MODERATE BARGAINING POWER OF BUYERS OWING TO REQUIREMENT OF LARGE ORDER QUANTITIES
           6.11.1 BARGAINING POWER OF SUPPLIERS
           6.11.2 THREAT OF NEW ENTRANTS
           6.11.3 THREAT OF SUBSTITUTES
           6.11.4 BARGAINING POWER OF BUYERS
           6.11.5 INTENSITY OF COMPETITIVE RIVALRY
    6.12 MACROECONOMIC INDICATORS 
           6.12.1 INTRODUCTION
           6.12.2 GDP TRENDS AND FORECASTS
                     TABLE 10 WORLD GDP GROWTH PROJECTION, 2021–2028 (USD TRILLION)
           6.12.3 CONSTRUCTION INDUSTRY AS PERCENTAGE OF GDP AND ROLE IN CROSS-LINKED POLYETHYLENE (PEX) MARKET
                     TABLE 11 CONSTRUCTION INDUSTRY AS PERCENTAGE OF GDP, BY KEY COUNTRIES, 2021
           6.12.4 GLOBAL AUTOMOBILE PRODUCTION AND GROWTH
                     TABLE 12 GLOBAL AUTOMOBILE PRODUCTION (UNITS) AND GROWTH, BY COUNTRY, 2021–2022
           6.12.5 AVERAGE CONSUMER PRICE INDEX (% CHANGE)
                     TABLE 13 AVERAGE CONSUMER PRICE INDEX (ANNUAL PERCENT CHANGE)
           6.12.6 GROWING POPULATION AND URBANIZATION
                     TABLE 14 URBANIZATION, BY REGION, 2021–2050 (IN MILLION)
                     TABLE 15 POPULATION, BY REGION, 2022–2050 (IN MILLION)
    6.13 KEY STAKEHOLDERS AND BUYING CRITERIA 
           6.13.1 KEY STAKEHOLDERS IN BUYING PROCESS
                     FIGURE 27 INFLUENCE OF STAKEHOLDERS ON BUYING PROCESS
                     TABLE 16 INFLUENCE OF STAKEHOLDERS ON BUYING PROCESS OF CROSS-LINKED  POLYETHYLENE (PEX)
           6.13.2 BUYING CRITERIA
                     FIGURE 28 KEY BUYING CRITERIA OF CROSS-LINKED POLYETHYLENE (PEX), BY END-USE INDUSTRY
                     TABLE 17 KEY BUYING CRITERIA FOR CROSS-LINKED POLYETHYLENE (PEX), BY END-USE INDUSTRY
    6.14 CASE STUDY ANALYSIS 
           6.14.1 BOREALIS AG LEADS WAY IN RECYCLING PEX FOR SUSTAINABLE SOLUTIONS IN CABLE INDUSTRY
           6.14.2 ENHANCED PACKAGING OF MEDICAL DEVICES USING PEX FOAM
           6.14.3 FAIRFIELD INN &SUITES AT HARRISBURG INTERNATIONAL AIRPORT DEPLOYED REHAU PEXA PLUMBING SYSTEMS
 
7 CROSS-LINKED POLYETHYLENE (PEX) MARKET, BY TECHNOLOGY (Page No. - 109)
    7.1 INTRODUCTION 
          FIGURE 29 PEXA TO BE FASTEST-GROWING TECHNOLOGY SEGMENT DURING THE FORECAST PERIOD
          TABLE 18 CROSS-LINKED POLYETHYLENE (PEX) MARKET SIZE, BY TECHNOLOGY,  2019–2021 (USD MILLION)
          TABLE 19 CROSS-LINKED POLYETHYLENE (PEX) MARKET SIZE, BY TECHNOLOGY,  2022–2028 (USD MILLION)
          TABLE 20 CROSS-LINKED POLYETHYLENE (PEX) MARKET SIZE, BY TECHNOLOGY,  2019–2021 (KILOTON)
          TABLE 21 CROSS-LINKED POLYETHYLENE (PEX) MARKET SIZE, BY TECHNOLOGY,  2022–2028 (KILOTON)
    7.2 PEXA 
           7.2.1 INCREASED DEMAND IN CABLE INSULATION AND PLUMBING APPLICATION TO DRIVE DEMAND
    7.3 PEXB 
           7.3.1 LOW COST AND RESISTANCE TO CHLORINE TO BOOST DEMAND
    7.4 PEXC 
           7.4.1 ENERGY-EFFICIENT CHARACTERISTICS TO PROPEL SEGMENT
 
8 CROSS-LINKED POLYETHYLENE (PEX) MARKET, BY TYPE (Page No. - 114)
    8.1 INTRODUCTION 
          FIGURE 30 HDPE TO BE FASTEST-GROWING TYPE SEGMENT DURING FORECAST PERIOD
          TABLE 22 CROSS-LINKED POLYETHYLENE (PEX) MARKET SIZE, BY TYPE, 2019–2021 (USD MILLION)
          TABLE 23 CROSS-LINKED POLYETHYLENE (PEX) MARKET SIZE, BY TYPE, 2022–2028 (USD MILLION)
          TABLE 24 CROSS-LINKED POLYETHYLENE (PEX) MARKET SIZE, BY TYPE, 2019–2021 (KILOTON)
          TABLE 25 CROSS-LINKED POLYETHYLENE (PEX) MARKET SIZE, BY TYPE, 2022–2028 (KILOTON)
    8.2 HDPE 
           8.2.1 NON-CORROSIVE PROPERTY AND EFFICIENT PRICING TO DRIVE DEMAND IN PLUMBING INDUSTRY
    8.3 LDPE 
           8.3.1 EXTENSIVE USE AS INSULATION MATERIAL IN WIRES & CABLES INDUSTRY TO PROPEL SEGMENT
    8.4 OTHERS 
 
9 CROSS-LINKED POLYETHYLENE (PEX) MARKET, BY END-USE INDUSTRY (Page No. - 118)
    9.1 INTRODUCTION 
          FIGURE 31 WIRES & CABLES TO BE LARGEST END-USE INDUSTRY SEGMENT IN 2028
          TABLE 26 CROSS-LINKED POLYETHYLENE (PEX) MARKET SIZE, BY END-USE INDUSTRY,  2019–2021 (USD MILLION)
          TABLE 27 CROSS-LINKED POLYETHYLENE (PEX) MARKET SIZE, BY END-USE INDUSTRY,  2022–2028 (USD MILLION)
          TABLE 28 CROSS-LINKED POLYETHYLENE (PEX) MARKET SIZE, BY END-USE INDUSTRY,  2019–2021 (KILOTON)
          TABLE 29 CROSS-LINKED POLYETHYLENE (PEX) MARKET SIZE, BY END-USE INDUSTRY,  2022–2028 (KILOTON)
    9.2 WIRES & CABLES 
           9.2.1 EXTENSIVE USE IN ELECTRICAL INSULATION TO DRIVE DEMAND
    9.3 PLUMBING 
           9.3.1 LOWER COST AS COMPARED TO COPPER PIPES TO PROPEL DEMAND IN PLUMBING INSTALLATIONS
    9.4 AUTOMOTIVE 
           9.4.1 LOW PRODUCTION COST AND EASY AVAILABILITY TO BOOST CONSUMPTION
    9.5 OTHERS 
 
10 CROSS-LINKED POLYETHYLENE (PEX) MARKET, BY REGION (Page No. - 123)
     10.1 INTRODUCTION 
             FIGURE 32 EMERGING COUNTRIES IN ASIA PACIFIC TO BE STRATEGIC LOCATIONS FOR CROSS-LINKED POLYETHYLENE (PEX) MARKET
             TABLE 30 CROSS-LINKED POLYETHYLENE (PEX) MARKET SIZE, BY REGION,  2019–2021 (USD MILLION)
             TABLE 31 CROSS-LINKED POLYETHYLENE (PEX) MARKET SIZE, BY REGION,  2022–2028 (USD MILLION)
             TABLE 32 CROSS-LINKED POLYETHYLENE (PEX) MARKET SIZE, BY REGION, 2019–2021 (KILOTON)
             TABLE 33 CROSS-LINKED POLYETHYLENE (PEX) MARKET SIZE, BY REGION, 2022–2028 (KILOTON)
     10.2 ASIA PACIFIC 
             10.2.1 ASIA PACIFIC: RECESSION IMPACT
                        FIGURE 33 ASIA PACIFIC: CROSS-LINKED POLYETHYLENE (PEX) MARKET SNAPSHOT
                        TABLE 34 ASIA PACIFIC: CROSS-LINKED POLYETHYLENE (PEX) MARKET SIZE, BY COUNTRY,  2019–2021 (USD MILLION)
                        TABLE 35 ASIA PACIFIC: CROSS-LINKED POLYETHYLENE (PEX) MARKET SIZE, BY COUNTRY,  2022–2028 (USD MILLION)
                        TABLE 36 ASIA PACIFIC: CROSS-LINKED POLYETHYLENE (PEX) MARKET SIZE, BY COUNTRY,  2019–2021 (KILOTON)
                        TABLE 37 ASIA PACIFIC: CROSS-LINKED POLYETHYLENE (PEX) MARKET SIZE, BY COUNTRY,  2022–2028 (KILOTON)
                        TABLE 38 ASIA PACIFIC: CROSS-LINKED POLYETHYLENE (PEX) MARKET SIZE, BY TYPE,  2019–2021 (USD MILLION)
                        TABLE 39 ASIA PACIFIC: CROSS-LINKED POLYETHYLENE (PEX) MARKET SIZE, BY TYPE,  2022–2028 (USD MILLION)
                        TABLE 40 ASIA PACIFIC: CROSS-LINKED POLYETHYLENE (PEX) MARKET SIZE, BY TYPE,  2019–2021 (KILOTON)
                        TABLE 41 ASIA PACIFIC: CROSS-LINKED POLYETHYLENE (PEX) MARKET SIZE,  BY TYPE, 2022–2028 (KILOTON)
                        TABLE 42 ASIA PACIFIC: CROSS-LINKED POLYETHYLENE (PEX) MARKET SIZE, BY TECHNOLOGY, 2019–2021 (USD MILLION)
                        TABLE 43 ASIA PACIFIC: CROSS-LINKED POLYETHYLENE (PEX) MARKET SIZE, BY TECHNOLOGY, 2022–2028 (USD MILLION)
                        TABLE 44 ASIA PACIFIC: CROSS-LINKED POLYETHYLENE (PEX) MARKET SIZE, BY TECHNOLOGY, 2019–2021 (KILOTON)
                        TABLE 45 ASIA PACIFIC: CROSS-LINKED POLYETHYLENE (PEX) MARKET SIZE, BY TECHNOLOGY, 2022–2028 (KILOTON)
                        TABLE 46 ASIA PACIFIC: CROSS-LINKED POLYETHYLENE (PEX) MARKET SIZE, BY END-USE INDUSTRY, 2019–2021 (USD MILLION)
                        TABLE 47 ASIA PACIFIC: CROSS-LINKED POLYETHYLENE (PEX) MARKET SIZE, BY END-USE INDUSTRY, 2022–2028 (USD MILLION)
                        TABLE 48 ASIA PACIFIC: CROSS-LINKED POLYETHYLENE (PEX) MARKET SIZE, BY END-USE INDUSTRY, 2019–2021 (KILOTON)
                        TABLE 49 ASIA PACIFIC: CROSS-LINKED POLYETHYLENE (PEX) MARKET SIZE, BY END-USE INDUSTRY, 2022–2028 (KILOTON)
             10.2.2 CHINA
                        10.2.2.1 Increased use in in-vehicle wiring applications to boost market
                                      TABLE 50 CHINA: CROSS-LINKED POLYETHYLENE (PEX) MARKET SIZE, BY TYPE,  2019–2021 (USD MILLION)
                                      TABLE 51 CHINA: CROSS-LINKED POLYETHYLENE (PEX) MARKET SIZE, BY TYPE,  2022–2028 (USD MILLION)
                                      TABLE 52 CHINA: CROSS-LINKED POLYETHYLENE (PEX) MARKET SIZE, BY TYPE,  2019–2021 (KILOTON)
                                      TABLE 53 CHINA: CROSS-LINKED POLYETHYLENE (PEX) MARKET SIZE, BY TYPE,  2022–2028 (KILOTON)
                                      TABLE 54 CHINA: CROSS-LINKED POLYETHYLENE (PEX) MARKET SIZE, BY END-USE INDUSTRY, 2019–2021 (USD MILLION)
                                      TABLE 55 CHINA: CROSS-LINKED POLYETHYLENE (PEX) MARKET SIZE, BY END-USE INDUSTRY, 2022–2028 (USD MILLION)
                                      TABLE 56 CHINA: CROSS-LINKED POLYETHYLENE (PEX) MARKET SIZE, BY END-USE INDUSTRY, 2019–2021 (KILOTON)
                                      TABLE 57 CHINA: CROSS-LINKED POLYETHYLENE (PEX) MARKET SIZE, BY END-USE INDUSTRY, 2022–2028 (KILOTON)
             10.2.3 JAPAN
                        10.2.3.1 Advancements in telecommunication industry and rise in use of electronic cars to boost market
                                      TABLE 58 JAPAN: CROSS-LINKED POLYETHYLENE (PEX) MARKET SIZE, BY TYPE,  2019–2021 (USD MILLION)
                                      TABLE 59 JAPAN: CROSS-LINKED POLYETHYLENE (PEX) MARKET SIZE, BY TYPE,  2022–2028 (USD MILLION)
                                      TABLE 60 JAPAN: CROSS-LINKED POLYETHYLENE (PEX) MARKET SIZE, BY TYPE,  2019–2021 (KILOTON)
                                      TABLE 61 JAPAN: CROSS-LINKED POLYETHYLENE (PEX) MARKET SIZE, BY TYPE,  2022–2028 (KILOTON)
                                      TABLE 62 JAPAN: CROSS-LINKED POLYETHYLENE (PEX) MARKET SIZE, BY END-USE INDUSTRY, 2019–2021 (USD MILLION)
                                      TABLE 63 JAPAN: CROSS-LINKED POLYETHYLENE (PEX) MARKET SIZE, BY END-USE INDUSTRY, 2022–2028 (USD MILLION)
                                      TABLE 64 JAPAN: CROSS-LINKED POLYETHYLENE (PEX) MARKET SIZE, BY END-USE INDUSTRY, 2019–2021 (KILOTON)
                                      TABLE 65 JAPAN: CROSS-LINKED POLYETHYLENE (PEX) MARKET SIZE, BY END-USE INDUSTRY, 2022–2028 (KILOTON)
             10.2.4 INDIA
                        10.2.4.1 Upcoming infrastructure development projects and growing urbanization to fuel demand
                                      TABLE 66 INDIA: CROSS-LINKED POLYETHYLENE (PEX) MARKET SIZE, BY TYPE,  2019–2021 (USD MILLION)
                                      TABLE 67 INDIA: CROSS-LINKED POLYETHYLENE (PEX) MARKET SIZE, BY TYPE,  2022–2028 (USD MILLION)
                                      TABLE 68 INDIA: CROSS-LINKED POLYETHYLENE (PEX) MARKET SIZE, BY TYPE,  2019–2021 (KILOTON)
                                      TABLE 69 INDIA: CROSS-LINKED POLYETHYLENE (PEX) MARKET SIZE, BY TYPE,  2022–2028 (KILOTON)
                                      TABLE 70 INDIA: CROSS-LINKED POLYETHYLENE (PEX) MARKET SIZE, BY END-USE INDUSTRY, 2019–2021 (USD MILLION)
                                      TABLE 71 INDIA: CROSS-LINKED POLYETHYLENE (PEX) MARKET SIZE, BY END-USE INDUSTRY, 2022–2028 (USD MILLION)
                                      TABLE 72 INDIA: CROSS-LINKED POLYETHYLENE (PEX) MARKET SIZE, BY END-USE INDUSTRY, 2019–2021 (KILOTON)
                                      TABLE 73 INDIA: CROSS-LINKED POLYETHYLENE (PEX) MARKET SIZE, BY END-USE INDUSTRY, 2022–2028 (KILOTON)
             10.2.5 SOUTH KOREA
                        10.2.5.1 Infrastructural developments and rapid industrialization to propel market
                                      TABLE 74 SOUTH KOREA: CROSS-LINKED POLYETHYLENE (PEX) MARKET SIZE, BY TYPE,  2019–2021 (USD MILLION)
                                      TABLE 75 SOUTH KOREA: CROSS-LINKED POLYETHYLENE (PEX) MARKET SIZE, BY TYPE,  2022–2028 (USD MILLION)
                                      TABLE 76 SOUTH KOREA: CROSS-LINKED POLYETHYLENE (PEX) MARKET SIZE, BY TYPE, 2019–2021 (KILOTON)
                                      TABLE 77 SOUTH KOREA: CROSS-LINKED POLYETHYLENE (PEX) MARKET SIZE, BY TYPE,  2022–2028 (KILOTON)
                                      TABLE 78 SOUTH KOREA: CROSS-LINKED POLYETHYLENE (PEX) MARKET SIZE, BY END-USE INDUSTRY, 2019–2021 (USD MILLION)
                                      TABLE 79 SOUTH KOREA: CROSS-LINKED POLYETHYLENE (PEX) MARKET SIZE, BY END-USE INDUSTRY, 2022–2028 (USD MILLION)
                                      TABLE 80 SOUTH KOREA: CROSS-LINKED POLYETHYLENE (PEX) MARKET SIZE, BY END-USE INDUSTRY, 2019–2021 (KILOTON)
                                      TABLE 81 SOUTH KOREA: CROSS-LINKED POLYETHYLENE (PEX) MARKET SIZE, BY END-USE INDUSTRY, 2022–2028 (KILOTON)
             10.2.6 AUSTRALIA
                        10.2.6.1 Growth across various end-use industries to drive market
                                      TABLE 82 AUSTRALIA: CROSS-LINKED POLYETHYLENE (PEX) MARKET SIZE, BY TYPE,  2019–2021 (USD MILLION)
                                      TABLE 83 AUSTRALIA: CROSS-LINKED POLYETHYLENE (PEX) MARKET SIZE, BY TYPE,  2022–2028 (USD MILLION)
                                      TABLE 84 AUSTRALIA: CROSS-LINKED POLYETHYLENE (PEX) MARKET SIZE, BY TYPE,  2019–2021 (KILOTON)
                                      TABLE 85 AUSTRALIA: CROSS-LINKED POLYETHYLENE (PEX) MARKET SIZE, BY TYPE,  2022–2028 (KILOTON)
                                      TABLE 86 AUSTRALIA: CROSS-LINKED POLYETHYLENE (PEX) MARKET SIZE, BY END-USE INDUSTRY, 2019–2021 (USD MILLION)
                                      TABLE 87 AUSTRALIA: CROSS-LINKED POLYETHYLENE (PEX) MARKET SIZE, BY END-USE INDUSTRY, 2022–2028 (USD MILLION)
                                      TABLE 88 AUSTRALIA: CROSS-LINKED POLYETHYLENE (PEX) MARKET SIZE, BY END-USE INDUSTRY, 2019–2021 (KILOTON)
                                      TABLE 89 AUSTRALIA: CROSS-LINKED POLYETHYLENE (PEX) MARKET SIZE, BY END-USE INDUSTRY, 2022–2028 (KILOTON)
             10.2.7 REST OF APAC
                        TABLE 90 REST OF ASIA PACIFIC: CROSS-LINKED POLYETHYLENE (PEX) MARKET SIZE, BY TYPE, 2019–2021 (USD MILLION)
                        TABLE 91 REST OF ASIA PACIFIC: CROSS-LINKED POLYETHYLENE (PEX) MARKET SIZE, BY TYPE, 2022–2028 (USD MILLION)
                        TABLE 92 REST OF ASIA PACIFIC: CROSS-LINKED POLYETHYLENE (PEX) MARKET SIZE, BY TYPE, 2019–2021 (KILOTON)
                        TABLE 93 REST OF ASIA PACIFIC: CROSS-LINKED POLYETHYLENE (PEX) MARKET SIZE, BY TYPE, 2022–2028 (KILOTON)
                        TABLE 94 REST OF ASIA PACIFIC: CROSS-LINKED POLYETHYLENE (PEX) MARKET SIZE,  BY END-USE INDUSTRY, 2019–2021 (USD MILLION)
                        TABLE 95 REST OF ASIA PACIFIC: CROSS-LINKED POLYETHYLENE (PEX) MARKET SIZE, BY END-USE INDUSTRY, 2022–2028 (USD MILLION)
                        TABLE 96 REST OF ASIA PACIFIC: CROSS-LINKED POLYETHYLENE (PEX) MARKET SIZE, BY END-USE INDUSTRY, 2019–2021 (KILOTON)
                        TABLE 97 REST OF ASIA PACIFIC: CROSS-LINKED POLYETHYLENE (PEX) MARKET SIZE, BY END-USE INDUSTRY, 2022–2028 (KILOTON)
     10.3 NORTH AMERICA 
             10.3.1 NORTH AMERICA: RECESSION IMPACT
                        FIGURE 34 NORTH AMERICA: CROSS-LINKED POLYETHYLENE (PEX) MARKET SNAPSHOT
                        TABLE 98 NORTH AMERICA: CROSS-LINKED POLYETHYLENE (PEX) MARKET SIZE, BY COUNTRY, 2019–2021 (USD MILLION)
                        TABLE 99 NORTH AMERICA: CROSS-LINKED POLYETHYLENE (PEX) MARKET SIZE, BY COUNTRY, 2022–2028 (USD MILLION)
                        TABLE 100 NORTH AMERICA: CROSS-LINKED POLYETHYLENE (PEX) MARKET SIZE, BY COUNTRY, 2019–2021 (KILOTON)
                        TABLE 101 NORTH AMERICA: CROSS-LINKED POLYETHYLENE (PEX) MARKET SIZE, BY COUNTRY, 2022–2028 (KILOTON)
                        TABLE 102 NORTH AMERICA: CROSS-LINKED POLYETHYLENE (PEX) MARKET SIZE, BY TYPE,  2019–2021 (USD MILLION)
                        TABLE 103 NORTH AMERICA: CROSS-LINKED POLYETHYLENE (PEX) MARKET SIZE, BY TYPE,  2022–2028 (USD MILLION)
                        TABLE 104 NORTH AMERICA: CROSS-LINKED POLYETHYLENE (PEX) MARKET SIZE, BY TYPE,  2019–2021 (KILOTON)
                        TABLE 105 NORTH AMERICA: CROSS-LINKED POLYETHYLENE (PEX) MARKET SIZE, BY TYPE,  2022–2028 (KILOTON)
                        TABLE 106 NORTH AMERICA: CROSS-LINKED POLYETHYLENE (PEX) MARKET SIZE, BY TECHNOLOGY, 2019–2021 (USD MILLION)
                        TABLE 107 NORTH AMERICA: CROSS-LINKED POLYETHYLENE (PEX) MARKET SIZE, BY TECHNOLOGY, 2022–2028 (USD MILLION)
                        TABLE 108 NORTH AMERICA: CROSS-LINKED POLYETHYLENE (PEX) MARKET SIZE, BY TECHNOLOGY, 2019–2021 (KILOTON)
                        TABLE 109 NORTH AMERICA: CROSS-LINKED POLYETHYLENE (PEX) MARKET SIZE, BY TECHNOLOGY, 2022–2028 (KILOTON)
                        TABLE 110 NORTH AMERICA: CROSS-LINKED POLYETHYLENE (PEX) MARKET SIZE, BY END-USE INDUSTRY, 2019–2021 (USD MILLION)
                        TABLE 111 NORTH AMERICA: CROSS-LINKED POLYETHYLENE (PEX) MARKET SIZE, BY END-USE INDUSTRY, 2022–2028 (USD MILLION)
                        TABLE 112 NORTH AMERICA: CROSS-LINKED POLYETHYLENE (PEX) MARKET SIZE, BY END-USE INDUSTRY, 2019–2021 (KILOTON)
                        TABLE 113 NORTH AMERICA: CROSS-LINKED POLYETHYLENE (PEX) MARKET SIZE,  BY END-USE INDUSTRY, 2022–2028 (KILOTON)
             10.3.2 US
                        10.3.2.1 Increased use in radiant heating applications to drive market
                                      TABLE 114 US: CROSS-LINKED POLYETHYLENE (PEX) MARKET SIZE, BY TYPE,  2019–2021 (USD MILLION)
                                      TABLE 115 US: CROSS-LINKED POLYETHYLENE (PEX) MARKET SIZE, BY TYPE,  2022–2028 (USD MILLION)
                                      TABLE 116 US: CROSS-LINKED POLYETHYLENE (PEX) MARKET SIZE, BY TYPE, 2019–2021 (KILOTON)
                                      TABLE 117 US: CROSS-LINKED POLYETHYLENE (PEX) MARKET SIZE, BY TYPE, 2022–2028 (KILOTON)
                                      TABLE 118 US: CROSS-LINKED POLYETHYLENE (PEX) MARKET SIZE, BY END-USE INDUSTRY,  2019–2021 (USD MILLION)
                                      TABLE 119 US: CROSS-LINKED POLYETHYLENE (PEX) MARKET SIZE, BY END-USE INDUSTRY,  2022–2028 (USD MILLION)
                                      TABLE 120 US: CROSS-LINKED POLYETHYLENE (PEX) MARKET SIZE, BY END-USE INDUSTRY,  2019–2021 (KILOTON)
                                      TABLE 121 US: CROSS-LINKED POLYETHYLENE (PEX) MARKET SIZE, BY END-USE INDUSTRY,  2022–2028 (KILOTON)
             10.3.3 CANADA
                        10.3.3.1 Increased public and private investments in modernization projects to boost market
                                      TABLE 122 CANADA: CROSS-LINKED POLYETHYLENE (PEX) MARKET SIZE, BY TYPE,  2019–2021 (USD MILLION)
                                      TABLE 123 CANADA: CROSS-LINKED POLYETHYLENE (PEX) MARKET SIZE, BY TYPE,  2022–2028 (USD MILLION)
                                      TABLE 124 CANADA: CROSS-LINKED POLYETHYLENE (PEX) MARKET SIZE, BY TYPE,  2019–2021 (KILOTON)
                                      TABLE 125 CANADA: CROSS-LINKED POLYETHYLENE (PEX) MARKET SIZE, BY TYPE,  2022–2028 (KILOTON)
                                      TABLE 126 CANADA: CROSS-LINKED POLYETHYLENE (PEX) MARKET SIZE, BY END-USE INDUSTRY, 2019–2021 (USD MILLION)
                                      TABLE 127 CANADA: CROSS-LINKED POLYETHYLENE (PEX) MARKET SIZE, BY END-USE INDUSTRY, 2022–2028 (USD MILLION)
                                      TABLE 128 CANADA: CROSS-LINKED POLYETHYLENE (PEX) MARKET SIZE, BY END-USE INDUSTRY, 2019–2021 (KILOTON)
                                      TABLE 129 CANADA: CROSS-LINKED POLYETHYLENE (PEX) MARKET SIZE, BY END-USE INDUSTRY, 2022–2028 (KILOTON)
             10.3.4 MEXICO
                        10.3.4.1 Extensive use in power and automotive industries to propel market
                                      TABLE 130 MEXICO: CROSS-LINKED POLYETHYLENE (PEX) MARKET SIZE, BY TYPE,  2019–2021 (USD MILLION)
                                      TABLE 131 MEXICO: CROSS-LINKED POLYETHYLENE (PEX) MARKET SIZE, BY TYPE,  2022–2028 (USD MILLION)
                                      TABLE 132 MEXICO: CROSS-LINKED POLYETHYLENE (PEX) MARKET SIZE, BY TYPE,  2019–2021 (KILOTON)
                                      TABLE 133 MEXICO: CROSS-LINKED POLYETHYLENE (PEX) MARKET SIZE, BY TYPE,  2022–2028 (KILOTON)
                                      TABLE 134 MEXICO: CROSS-LINKED POLYETHYLENE (PEX) MARKET SIZE, BY END-USE INDUSTRY, 2019–2021 (USD MILLION)
                                      TABLE 135 MEXICO: CROSS-LINKED POLYETHYLENE (PEX) MARKET SIZE, BY END-USE INDUSTRY, 2022–2028 (USD MILLION)
                                      TABLE 136 MEXICO: CROSS-LINKED POLYETHYLENE (PEX) MARKET SIZE, BY END-USE INDUSTRY, 2019–2021 (KILOTON)
                                      TABLE 137 MEXICO: CROSS-LINKED POLYETHYLENE (PEX) MARKET SIZE, BY END-USE INDUSTRY, 2022–2028 (KILOTON)
     10.4 EUROPE 
             10.4.1 EUROPE: RECESSION IMPACT
                        FIGURE 35 EUROPE: CROSS-LINKED POLYETHYLENE (PEX) MARKET SNAPSHOT
                        TABLE 138 EUROPE: CROSS-LINKED POLYETHYLENE (PEX) MARKET SIZE, BY COUNTRY,  2019–2021 (USD MILLION)
                        TABLE 139 EUROPE: CROSS-LINKED POLYETHYLENE (PEX) MARKET SIZE, BY COUNTRY,  2022–2028 (USD MILLION)
                        TABLE 140 EUROPE: CROSS-LINKED POLYETHYLENE (PEX) MARKET SIZE, BY COUNTRY,  2019–2021 (KILOTON)
                        TABLE 141 EUROPE: CROSS-LINKED POLYETHYLENE (PEX) MARKET SIZE, BY COUNTRY,  2022–2028 (KILOTON)
                        TABLE 142 EUROPE: CROSS-LINKED POLYETHYLENE (PEX) MARKET SIZE, BY TYPE,  2019–2021 (USD MILLION)
                        TABLE 143 EUROPE: CROSS-LINKED POLYETHYLENE (PEX) MARKET SIZE, BY TYPE,  2022–2028 (USD MILLION)
                        TABLE 144 EUROPE: CROSS-LINKED POLYETHYLENE (PEX) MARKET SIZE, BY TYPE,  2019–2021 (KILOTON)
                        TABLE 145 EUROPE: CROSS-LINKED POLYETHYLENE (PEX) MARKET SIZE, BY TYPE,  2022–2028 (KILOTON)
                        TABLE 146 EUROPE: CROSS-LINKED POLYETHYLENE (PEX) MARKET SIZE, BY TECHNOLOGY,  2019–2021 (USD MILLION)
                        TABLE 147 EUROPE: CROSS-LINKED POLYETHYLENE (PEX) MARKET SIZE, BY TECHNOLOGY,  2022–2028 (USD MILLION)
                        TABLE 148 EUROPE: CROSS-LINKED POLYETHYLENE (PEX) MARKET SIZE, BY TECHNOLOGY, 2019–2021 (KILOTON)
                        TABLE 149 EUROPE: CROSS-LINKED POLYETHYLENE (PEX) MARKET SIZE, BY TECHNOLOGY,  2022–2028 (KILOTON)
                        TABLE 150 EUROPE: CROSS-LINKED POLYETHYLENE (PEX) MARKET SIZE, BY END-USE INDUSTRY, 2019–2021 (USD MILLION)
                        TABLE 151 EUROPE: CROSS-LINKED POLYETHYLENE (PEX) MARKET SIZE, BY END-USE INDUSTRY, 2022–2028 (USD MILLION)
                        TABLE 152 EUROPE: CROSS-LINKED POLYETHYLENE (PEX) MARKET SIZE, BY END-USE INDUSTRY, 2019–2021 (KILOTON)
                        TABLE 153 EUROPE: CROSS-LINKED POLYETHYLENE (PEX) MARKET SIZE, BY END-USE INDUSTRY, 2022–2028 (KILOTON)
             10.4.2 GERMANY
                        10.4.2.1 Robust automotive industry to drive market
                                      TABLE 154 GERMANY: CROSS-LINKED POLYETHYLENE (PEX) MARKET SIZE, BY TYPE,  2019–2021 (USD MILLION)
                                      TABLE 155 GERMANY: CROSS-LINKED POLYETHYLENE (PEX) MARKET SIZE, BY TYPE,  2022–2028 (USD MILLION)
                                      TABLE 156 GERMANY: CROSS-LINKED POLYETHYLENE (PEX) MARKET SIZE, BY TYPE,  2019–2021 (KILOTON)
                                      TABLE 157 GERMANY: CROSS-LINKED POLYETHYLENE (PEX) MARKET SIZE, BY TYPE,  2022–2028 (KILOTON)
                                      TABLE 158 GERMANY: CROSS-LINKED POLYETHYLENE (PEX) MARKET SIZE, BY END-USE INDUSTRY, 2019–2021 (USD MILLION)
                                      TABLE 159 GERMANY: CROSS-LINKED POLYETHYLENE (PEX) MARKET SIZE, BY END-USE INDUSTRY, 2022–2028 (USD MILLION)
                                      TABLE 160 GERMANY: CROSS-LINKED POLYETHYLENE (PEX) MARKET SIZE, BY END-USE INDUSTRY, 2019–2021 (KILOTON)
                                      TABLE 161 GERMANY: CROSS-LINKED POLYETHYLENE (PEX) MARKET SIZE, BY END-USE INDUSTRY, 2022–2028 (KILOTON)
             10.4.3 FRANCE
                        10.4.3.1 Growing automotive and construction sectors to boost market
                                      TABLE 162 FRANCE: CROSS-LINKED POLYETHYLENE (PEX) MARKET SIZE, BY TYPE,  2019–2021 (USD MILLION)
                                      TABLE 163 FRANCE: CROSS-LINKED POLYETHYLENE (PEX) MARKET SIZE, BY TYPE,  2022–2028 (USD MILLION)
                                      TABLE 164 FRANCE: CROSS-LINKED POLYETHYLENE (PEX) MARKET SIZE, BY TYPE,  2019–2021 (KILOTON)
                                      TABLE 165 FRANCE: CROSS-LINKED POLYETHYLENE (PEX) MARKET SIZE, BY TYPE,  2022–2028 (KILOTON)
                                      TABLE 166 FRANCE: CROSS-LINKED POLYETHYLENE (PEX) MARKET SIZE, BY END-USE INDUSTRY, 2019–2021 (USD MILLION)
                                      TABLE 167 FRANCE: CROSS-LINKED POLYETHYLENE (PEX) MARKET SIZE, BY END-USE INDUSTRY, 2022–2028 (USD MILLION)
                                      TABLE 168 FRANCE: CROSS-LINKED POLYETHYLENE (PEX) MARKET SIZE, BY END-USE INDUSTRY, 2019–2021 (KILOTON)
                                      TABLE 169 FRANCE: CROSS-LINKED POLYETHYLENE (PEX) MARKET SIZE, BY END-USE INDUSTRY, 2022–2028 (KILOTON)
             10.4.4 UK
                        10.4.4.1 Increased spending on infrastructure development to propel  market
                                      TABLE 170 UK: CROSS-LINKED POLYETHYLENE (PEX) MARKET SIZE, BY TYPE,  2019–2021 (USD MILLION)
                                      TABLE 171 UK: CROSS-LINKED POLYETHYLENE (PEX) MARKET SIZE, BY TYPE,  2022–2028 (USD MILLION)
                                      TABLE 172 UK: CROSS-LINKED POLYETHYLENE (PEX) MARKET SIZE, BY TYPE, 2019–2021 (KILOTON)
                                      TABLE 173 UK: CROSS-LINKED POLYETHYLENE (PEX) MARKET SIZE, BY TYPE, 2022–2028 (KILOTON)
                                      TABLE 174 UK: CROSS-LINKED POLYETHYLENE (PEX) MARKET SIZE, BY END-USE INDUSTRY,  2019–2021 (USD MILLION)
                                      TABLE 175 UK: CROSS-LINKED POLYETHYLENE (PEX) MARKET SIZE, BY END-USE INDUSTRY,  2022–2028 (USD MILLION)
                                      TABLE 176 UK: CROSS-LINKED POLYETHYLENE (PEX) MARKET SIZE, BY END-USE INDUSTRY,  2019–2021 (KILOTON)
                                      TABLE 177 UK: CROSS-LINKED POLYETHYLENE (PEX) MARKET SIZE, BY END-USE INDUSTRY,  2022–2028 (KILOTON)
             10.4.5 RUSSIA
                        10.4.5.1 Increased investments in replacing aging pipes used in transportation of natural gas to drive market
                                      TABLE 178 RUSSIA: CROSS-LINKED POLYETHYLENE (PEX) MARKET SIZE, BY TYPE,  2019–2021 (USD MILLION)
                                      TABLE 179 RUSSIA: CROSS-LINKED POLYETHYLENE (PEX) MARKET SIZE, BY TYPE,  2022–2028 (USD MILLION)
                                      TABLE 180 RUSSIA: CROSS-LINKED POLYETHYLENE (PEX) MARKET SIZE, BY TYPE,  2019–2021 (KILOTON)
                                      TABLE 181 RUSSIA: CROSS-LINKED POLYETHYLENE (PEX) MARKET SIZE, BY TYPE,  2022–2028 (KILOTON)
                                      TABLE 182 RUSSIA: CROSS-LINKED POLYETHYLENE (PEX) MARKET SIZE, BY END-USE INDUSTRY, 2019–2021 (USD MILLION)
                                      TABLE 183 RUSSIA: CROSS-LINKED POLYETHYLENE (PEX) MARKET SIZE, BY END-USE INDUSTRY, 2022–2028 (USD MILLION)
                                      TABLE 184 RUSSIA: CROSS-LINKED POLYETHYLENE (PEX) MARKET SIZE, BY END-USE INDUSTRY, 2019–2021 (KILOTON)
                                      TABLE 185 RUSSIA: CROSS-LINKED POLYETHYLENE (PEX) MARKET SIZE, BY END-USE INDUSTRY, 2022–2028 (KILOTON)
             10.4.6 ITALY
                        10.4.6.1 Thriving construction industry to provide lucrative opportunities for market growth
                                      TABLE 186 ITALY: CROSS-LINKED POLYETHYLENE (PEX) MARKET SIZE, BY TYPE,  2019–2021 (USD MILLION)
                                      TABLE 187 ITALY: CROSS-LINKED POLYETHYLENE (PEX) MARKET SIZE, BY TYPE,  2022–2028 (USD MILLION)
                                      TABLE 188 ITALY: CROSS-LINKED POLYETHYLENE (PEX) MARKET SIZE, BY TYPE,  2019–2021 (KILOTON)
                                      TABLE 189 ITALY: CROSS-LINKED POLYETHYLENE (PEX) MARKET SIZE, BY TYPE,  2022–2028 (KILOTON)
                                      TABLE 190 ITALY: CROSS-LINKED POLYETHYLENE (PEX) MARKET SIZE, BY END-USE INDUSTRY,  2019–2021 (USD MILLION)
                                      TABLE 191 ITALY: CROSS-LINKED POLYETHYLENE (PEX) MARKET SIZE, BY END-USE INDUSTRY,  2022–2028 (USD MILLION)
                                      TABLE 192 ITALY: CROSS-LINKED POLYETHYLENE (PEX) MARKET SIZE, BY END-USE INDUSTRY,  2019–2021 (KILOTON)
                                      TABLE 193 ITALY: CROSS-LINKED POLYETHYLENE (PEX) MARKET SIZE, BY END-USE INDUSTRY,  2022–2028 (KILOTON)
             10.4.7 TURKEY
                        10.4.7.1 Focus of government on infrastructural development to drive market
                                      TABLE 194 TURKEY: CROSS-LINKED POLYETHYLENE (PEX) MARKET SIZE, BY TYPE,  2019–2021 (USD MILLION)
                                      TABLE 195 TURKEY: CROSS-LINKED POLYETHYLENE (PEX) MARKET SIZE, BY TYPE,  2022–2028 (USD MILLION)
                                      TABLE 196 TURKEY: CROSS-LINKED POLYETHYLENE (PEX) MARKET SIZE, BY TYPE,  2019–2021 (KILOTON)
                                      TABLE 197 TURKEY: CROSS-LINKED POLYETHYLENE (PEX) MARKET SIZE, BY TYPE,  2022–2028 (KILOTON)
                                      TABLE 198 TURKEY: CROSS-LINKED POLYETHYLENE (PEX) MARKET SIZE, BY END-USE INDUSTRY, 2019–2021 (USD MILLION)
                                      TABLE 199 TURKEY: CROSS-LINKED POLYETHYLENE (PEX) MARKET SIZE, BY END-USE INDUSTRY, 2022–2028 (USD MILLION)
                                      TABLE 200 TURKEY: CROSS-LINKED POLYETHYLENE (PEX) MARKET SIZE, BY END-USE INDUSTRY, 2019–2021 (KILOTON)
                                      TABLE 201 TURKEY: CROSS-LINKED POLYETHYLENE (PEX) MARKET SIZE, BY END-USE INDUSTRY, 2022–2028 (KILOTON)
             10.4.8 REST OF EUROPE
                        TABLE 202 REST OF EUROPE: CROSS-LINKED POLYETHYLENE (PEX) MARKET SIZE, BY TYPE,  2019–2021 (USD MILLION)
                        TABLE 203 REST OF EUROPE: CROSS-LINKED POLYETHYLENE (PEX) MARKET SIZE, BY TYPE,  2022–2028 (USD MILLION)
                        TABLE 204 REST OF EUROPE: CROSS-LINKED POLYETHYLENE (PEX) MARKET SIZE, BY TYPE,  2019–2021 (KILOTON)
                        TABLE 205 REST OF EUROPE: CROSS-LINKED POLYETHYLENE (PEX) MARKET SIZE, BY TYPE,  2022–2028 (KILOTON)
                        TABLE 206 REST OF EUROPE: CROSS-LINKED POLYETHYLENE (PEX) MARKET SIZE,  BY END-USE INDUSTRY, 2019–2021 (USD MILLION)
                        TABLE 207 REST OF EUROPE: CROSS-LINKED POLYETHYLENE (PEX) MARKET SIZE, BY END-USE INDUSTRY, 2022–2028 (USD MILLION)
                        TABLE 208 REST OF EUROPE: CROSS-LINKED POLYETHYLENE (PEX) MARKET SIZE, BY END-USE INDUSTRY, 2019–2021 (KILOTON)
                        TABLE 209 REST OF EUROPE: CROSS-LINKED POLYETHYLENE (PEX) MARKET SIZE, BY END-USE INDUSTRY, 2022–2028 (KILOTON)
     10.5 SOUTH AMERICA 
             10.5.1 SOUTH AMERICA: RECESSION IMPACT
                        TABLE 210 SOUTH AMERICA: CROSS-LINKED POLYETHYLENE (PEX) MARKET SIZE, BY COUNTRY, 2019–2021 (USD MILLION)
                        TABLE 211 SOUTH AMERICA: CROSS-LINKED POLYETHYLENE (PEX) MARKET SIZE, BY COUNTRY, 2022–2028 (USD MILLION)
                        TABLE 212 SOUTH AMERICA: CROSS-LINKED POLYETHYLENE (PEX) MARKET SIZE, BY COUNTRY, 2019–2021 (KILOTON)
                        TABLE 213 SOUTH AMERICA: CROSS-LINKED POLYETHYLENE (PEX) MARKET SIZE, BY COUNTRY, 2022–2028 (KILOTON)
                        TABLE 214 SOUTH AMERICA: CROSS-LINKED POLYETHYLENE (PEX) MARKET SIZE, BY TYPE,  2019–2021 (USD MILLION)
                        TABLE 215 SOUTH AMERICA: CROSS-LINKED POLYETHYLENE (PEX) MARKET SIZE, BY TYPE,  2022–2028 (USD MILLION)
                        TABLE 216 SOUTH AMERICA: CROSS-LINKED POLYETHYLENE (PEX) MARKET SIZE, BY TYPE,  2019–2021 (KILOTON)
                        TABLE 217 SOUTH AMERICA: CROSS-LINKED POLYETHYLENE (PEX) MARKET SIZE, BY TYPE,  2022–2028 (KILOTON)
                        TABLE 218 SOUTH AMERICA: CROSS-LINKED POLYETHYLENE (PEX) MARKET SIZE, BY TECHNOLOGY, 2019–2021 (USD MILLION)
                        TABLE 219 SOUTH AMERICA: CROSS-LINKED POLYETHYLENE (PEX) MARKET SIZE, BY TECHNOLOGY, 2022–2028 (USD MILLION)
                        TABLE 220 SOUTH AMERICA: CROSS-LINKED POLYETHYLENE (PEX) MARKET SIZE, BY TECHNOLOGY, 2019–2021 (KILOTON)
                        TABLE 221 SOUTH AMERICA: CROSS-LINKED POLYETHYLENE (PEX) MARKET SIZE, BY TECHNOLOGY, 2022–2028 (KILOTON)
                        TABLE 222 SOUTH AMERICA: CROSS-LINKED POLYETHYLENE (PEX) MARKET SIZE, BY END-USE INDUSTRY, 2019–2021 (USD MILLION)
                        TABLE 223 SOUTH AMERICA: CROSS-LINKED POLYETHYLENE (PEX) MARKET SIZE, BY END-USE INDUSTRY, 2022–2028 (USD MILLION)
                        TABLE 224 SOUTH AMERICA: CROSS-LINKED POLYETHYLENE (PEX) MARKET SIZE, BY END-USE INDUSTRY, 2019–2021 (KILOTON)
                        TABLE 225 SOUTH AMERICA: CROSS-LINKED POLYETHYLENE (PEX) MARKET SIZE, BY END-USE INDUSTRY, 2022–2028 (KILOTON)
             10.5.2 BRAZIL
                        10.5.2.1 Economic growth leading to developments in construction sector to propel market
                                      TABLE 226 BRAZIL: CROSS-LINKED POLYETHYLENE (PEX) MARKET SIZE, BY TYPE,  2019–2021 (USD MILLION)
                                      TABLE 227 BRAZIL: CROSS-LINKED POLYETHYLENE (PEX) MARKET SIZE, BY TYPE,  2022–2028 (USD MILLION)
                                      TABLE 228 BRAZIL: CROSS-LINKED POLYETHYLENE (PEX) MARKET SIZE, BY TYPE,  2019–2021 (KILOTON)
                                      TABLE 229 BRAZIL: CROSS-LINKED POLYETHYLENE (PEX) MARKET SIZE, BY TYPE,  2022–2028 (KILOTON)
                                      TABLE 230 BRAZIL: CROSS-LINKED POLYETHYLENE (PEX) MARKET SIZE, BY END-USE INDUSTRY, 2019–2021 (USD MILLION)
                                      TABLE 231 BRAZIL: CROSS-LINKED POLYETHYLENE (PEX) MARKET SIZE, BY END-USE INDUSTRY, 2022–2028 (USD MILLION)
                                      TABLE 232 BRAZIL: CROSS-LINKED POLYETHYLENE (PEX) MARKET SIZE, BY END-USE INDUSTRY, 2019–2021 (KILOTON)
                                      TABLE 233 BRAZIL: CROSS-LINKED POLYETHYLENE (PEX) MARKET SIZE, BY END-USE INDUSTRY, 2022–2028 (KILOTON)
             10.5.3 ARGENTINA
                        10.5.3.1 Increased use in automotive industry to boost market
                                      TABLE 234 ARGENTINA: CROSS-LINKED POLYETHYLENE (PEX) MARKET SIZE, BY TYPE,  2019–2021 (USD MILLION)
                                      TABLE 235 ARGENTINA: CROSS-LINKED POLYETHYLENE (PEX) MARKET SIZE, BY TYPE,  2022–2028 (USD MILLION)
                                      TABLE 236 ARGENTINA: CROSS-LINKED POLYETHYLENE (PEX) MARKET SIZE, BY TYPE,  2019–2021 (KILOTON)
                                      TABLE 237 ARGENTINA: CROSS-LINKED POLYETHYLENE (PEX) MARKET SIZE, BY TYPE,  2022–2028 (KILOTON)
                                      TABLE 238 ARGENTINA: CROSS-LINKED POLYETHYLENE (PEX) MARKET SIZE, BY END-USE INDUSTRY, 2019–2021 (USD MILLION)
                                      TABLE 239 ARGENTINA: CROSS-LINKED POLYETHYLENE (PEX) MARKET SIZE, BY END-USE INDUSTRY, 2022–2028 (USD MILLION)
                                      TABLE 240 ARGENTINA: CROSS-LINKED POLYETHYLENE (PEX) MARKET SIZE, BY END-USE INDUSTRY, 2019–2021 (KILOTON)
                                      TABLE 241 ARGENTINA: CROSS-LINKED POLYETHYLENE (PEX) MARKET SIZE, BY END-USE INDUSTRY, 2022–2028 (KILOTON)
             10.5.4 REST OF SOUTH AMERICA
                        TABLE 242 REST OF SOUTH AMERICA: CROSS-LINKED POLYETHYLENE (PEX) MARKET SIZE, BY TYPE, 2019–2021 (USD MILLION)
                        TABLE 243 REST OF SOUTH AMERICA: CROSS-LINKED POLYETHYLENE (PEX) MARKET SIZE, BY TYPE, 2022–2028 (USD MILLION)
                        TABLE 244 REST OF SOUTH AMERICA: CROSS-LINKED POLYETHYLENE (PEX) MARKET SIZE, BY TYPE, 2019–2021 (KILOTON)
                        TABLE 245 REST OF SOUTH AMERICA: CROSS-LINKED POLYETHYLENE (PEX) MARKET SIZE, BY TYPE, 2022–2028 (KILOTON)
                        TABLE 246 REST OF SOUTH AMERICA: CROSS-LINKED POLYETHYLENE (PEX) MARKET SIZE, BY END-USE INDUSTRY, 2019–2021 (USD MILLION)
                        TABLE 247 REST OF SOUTH AMERICA: CROSS-LINKED POLYETHYLENE (PEX) MARKET SIZE, BY END-USE INDUSTRY, 2022–2028 (USD MILLION)
                        TABLE 248 REST OF SOUTH AMERICA: CROSS-LINKED POLYETHYLENE (PEX) MARKET SIZE, BY END-USE INDUSTRY, 2019–2021 (KILOTON)
                        TABLE 249 REST OF SOUTH AMERICA: CROSS-LINKED POLYETHYLENE (PEX) MARKET SIZE, BY END-USE INDUSTRY, 2022–2028 (KILOTON)
     10.6 MIDDLE EAST & AFRICA 
             10.6.1 MIDDLE EAST AND AFRICA: RECESSION IMPACT
                        TABLE 250 MIDDLE EAST & AFRICA: CROSS-LINKED POLYETHYLENE (PEX) MARKET SIZE,  BY COUNTRY, 2019–2021 (USD MILLION)
                        TABLE 251 MIDDLE EAST & AFRICA: CROSS-LINKED POLYETHYLENE (PEX) MARKET SIZE,  BY COUNTRY, 2022–2028 (USD MILLION)
                        TABLE 252 MIDDLE EAST & AFRICA: CROSS-LINKED POLYETHYLENE (PEX) MARKET SIZE,  BY COUNTRY, 2019–2021 (KILOTON)
                        TABLE 253 MIDDLE EAST & AFRICA: CROSS-LINKED POLYETHYLENE (PEX) MARKET SIZE,  BY COUNTRY, 2022–2028 (KILOTON)
                        TABLE 254 MIDDLE EAST & AFRICA: CROSS-LINKED POLYETHYLENE (PEX) MARKET SIZE, BY TYPE, 2019–2021 (USD MILLION)
                        TABLE 255 MIDDLE EAST & AFRICA: CROSS-LINKED POLYETHYLENE (PEX) MARKET SIZE, BY TYPE, 2022–2028 (USD MILLION)
                        TABLE 256 MIDDLE EAST & AFRICA: CROSS-LINKED POLYETHYLENE (PEX) MARKET SIZE, BY TYPE, 2019–2021 (KILOTON)
                        TABLE 257 MIDDLE EAST & AFRICA: CROSS-LINKED POLYETHYLENE (PEX) MARKET SIZE, BY TYPE, 2022–2028 (KILOTON)
                        TABLE 258 MIDDLE EAST & AFRICA: CROSS-LINKED POLYETHYLENE (PEX) MARKET SIZE,  BY TECHNOLOGY, 2019–2021 (USD MILLION)
                        TABLE 259 MIDDLE EAST & AFRICA: CROSS-LINKED POLYETHYLENE (PEX) MARKET SIZE,  BY TECHNOLOGY, 2022–2028 (USD MILLION)
                        TABLE 260 MIDDLE EAST & AFRICA: CROSS-LINKED POLYETHYLENE (PEX) MARKET SIZE,  BY TECHNOLOGY, 2019–2021 (KILOTON)
                        TABLE 261 MIDDLE EAST & AFRICA: CROSS-LINKED POLYETHYLENE (PEX) MARKET SIZE,  BY TECHNOLOGY, 2022–2028 (KILOTON)
                        TABLE 262 MIDDLE EAST & AFRICA: CROSS-LINKED POLYETHYLENE (PEX) MARKET SIZE, BY END-USE INDUSTRY, 2019–2021 (USD MILLION)
                        TABLE 263 MIDDLE EAST & AFRICA: CROSS-LINKED POLYETHYLENE (PEX) MARKET SIZE, BY END-USE INDUSTRY, 2022–2028 (USD MILLION)
                        TABLE 264 MIDDLE EAST & AFRICA: CROSS-LINKED POLYETHYLENE (PEX) MARKET SIZE,  BY END-USE INDUSTRY, 2019–2021 (KILOTON)
                        TABLE 265 MIDDLE EAST & AFRICA: CROSS-LINKED POLYETHYLENE (PEX) MARKET SIZE, BY END-USE INDUSTRY, 2022–2028 (KILOTON)
             10.6.2 SAUDI ARABIA
                        10.6.2.1 Rapid infrastructural development and easy availability of raw materials to boost market
                                      TABLE 266 SAUDI ARABIA: CROSS-LINKED POLYETHYLENE (PEX) MARKET SIZE, BY TYPE,  2019–2021 (USD MILLION)
                                      TABLE 267 SAUDI ARABIA: CROSS-LINKED POLYETHYLENE (PEX) MARKET SIZE, BY TYPE,  2022–2028 (USD MILLION)
                                      TABLE 268 SAUDI ARABIA: CROSS-LINKED POLYETHYLENE (PEX) MARKET SIZE, BY TYPE,  2019–2021 (KILOTON)
                                      TABLE 269 SAUDI ARABIA: CROSS-LINKED POLYETHYLENE (PEX) MARKET SIZE, BY TYPE,  2022–2028 (KILOTON)
                                      TABLE 270 SAUDI ARABIA: CROSS-LINKED POLYETHYLENE (PEX) MARKET SIZE, BY END-USE INDUSTRY, 2019–2021 (USD MILLION)
                                      TABLE 271 SAUDI ARABIA: CROSS-LINKED POLYETHYLENE (PEX) MARKET SIZE, BY END-USE INDUSTRY, 2022–2028 (USD MILLION)
                                      TABLE 272 SAUDI ARABIA: CROSS-LINKED POLYETHYLENE (PEX) MARKET SIZE, BY END-USE INDUSTRY, 2019–2021 (KILOTON)
                                      TABLE 273 SAUDI ARABIA: CROSS-LINKED POLYETHYLENE (PEX) MARKET SIZE, BY END-USE INDUSTRY, 2022–2028 (KILOTON)
             10.6.3 UAE
                        10.6.3.1 Growing construction and power industries to drive market
                                      TABLE 274 UAE: CROSS-LINKED POLYETHYLENE (PEX) MARKET SIZE, BY TYPE,  2019–2021 (USD MILLION)
                                      TABLE 275 UAE: CROSS-LINKED POLYETHYLENE (PEX) MARKET SIZE, BY TYPE,  2022–2028 (USD MILLION)
                                      TABLE 276 UAE: CROSS-LINKED POLYETHYLENE (PEX) MARKET SIZE, BY TYPE, 2019–2021 (KILOTON)
                                      TABLE 277 UAE: CROSS-LINKED POLYETHYLENE (PEX) MARKET SIZE, BY TYPE, 2022–2028 (KILOTON)
                                      TABLE 278 UAE: CROSS-LINKED POLYETHYLENE (PEX) MARKET SIZE, BY END-USE INDUSTRY,  2019–2021 (USD MILLION)
                                      TABLE 279 UAE: CROSS-LINKED POLYETHYLENE (PEX) MARKET SIZE, BY END-USE INDUSTRY,  2022–2028 (USD MILLION)
                                      TABLE 280 UAE: CROSS-LINKED POLYETHYLENE (PEX) MARKET SIZE, BY END-USE INDUSTRY,  2019–2021 (KILOTON)
                                      TABLE 281 UAE: CROSS-LINKED POLYETHYLENE (PEX) MARKET SIZE, BY END-USE INDUSTRY,  2022–2028 (KILOTON)
             10.6.4 REST OF THE MIDDLE EAST & AFRICA
                        TABLE 282 REST OF MIDDLE EAST & AFRICA: CROSS-LINKED POLYETHYLENE (PEX) MARKET SIZE,  BY TYPE, 2019–2021 (USD MILLION)
                        TABLE 283 REST OF MIDDLE EAST & AFRICA: CROSS-LINKED POLYETHYLENE (PEX) MARKET SIZE,  BY TYPE, 2022–2028 (USD MILLION)
                        TABLE 284 REST OF MIDDLE EAST & AFRICA: CROSS-LINKED POLYETHYLENE (PEX) MARKET SIZE,  BY TYPE, 2019–2021 (KILOTON)
                        TABLE 285 REST OF MIDDLE EAST & AFRICA: CROSS-LINKED POLYETHYLENE (PEX) MARKET SIZE,  BY TYPE, 2022–2028 (KILOTON)
                        TABLE 286 REST OF MIDDLE EAST & AFRICA: CROSS-LINKED POLYETHYLENE (PEX) MARKET SIZE,  BY END-USE INDUSTRY, 2019–2021 (USD MILLION)
                        TABLE 287 REST OF MIDDLE EAST & AFRICA: CROSS-LINKED POLYETHYLENE (PEX) MARKET SIZE,  BY END-USE INDUSTRY, 2022–2028 (USD MILLION)
                        TABLE 288 REST OF MIDDLE EAST & AFRICA: CROSS-LINKED POLYETHYLENE (PEX) MARKET SIZE,  BY END-USE INDUSTRY, 2019–2021 (KILOTON)
                        TABLE 289 REST OF MIDDLE EAST & AFRICA: CROSS-LINKED POLYETHYLENE (PEX) MARKET SIZE,  BY END-USE INDUSTRY, 2022–2028 (KILOTON)
 
11 COMPETITIVE LANDSCAPE (Page No. - 228)
     11.1 OVERVIEW 
             TABLE 290 STRATEGIES ADOPTED BY KEY PLAYERS BETWEEN 2018 AND 2023
     11.2 KEY PLAYER STRATEGIES/RIGHT TO WIN 
             TABLE 291 STRATEGIC POSITIONING OF KEY PLAYERS
     11.3 RANKING OF KEY PLAYERS 
             FIGURE 36 CROSS-LINKED POLYETHYLENE (PEX) MARKET: RANKING OF KEY PLAYERS
     11.4 REVENUE ANALYSIS OF KEY PLAYERS 
             FIGURE 37 REVENUE ANALYSIS OF KEY COMPANIES IN CROSS-LINKED POLYETHYLENE (PEX) MARKET
     11.5 COMPANY EVALUATION MATRIX, 2022 
             11.5.1 STARS
             11.5.2 EMERGING LEADERS
             11.5.3 PERVASIVE PLAYERS
             11.5.4 PARTICIPANTS
                        FIGURE 38 COMPETITIVE LEADERSHIP MAPPING: CROSS-LINKED POLYETHYLENE (PEX)  MARKET, 2022
     11.6 STARTUP/SME EVALUATION QUADRANT 
             11.6.1 PROGRESSIVE COMPANIES
             11.6.2 RESPONSIVE COMPANIES
             11.6.3 DYNAMIC COMPANIES
             11.6.4 STARTING BLOCKS
                        FIGURE 39 SME EVALUATION MATRIX: CROSS-LINKED POLYETHYLENE (PEX) MARKET, 2022
     11.7 COMPETITIVE BENCHMARKING 
             TABLE 292 CROSS-LINKED POLYETHYLENE (PEX) MARKET: KEY PLAYERS
             TABLE 293 CROSS-LINKED POLYETHYLENE (PEX) MARKET: COMPANY FOOTPRINT OF KEY PLAYERS, BY APPLICATIONS
             TABLE 294 CROSS-LINKED POLYETHYLENE (PEX) MARKET: COMPANY FOOTPRINT OF  KEY PLAYERS, BY REGION
     11.8 COMPETITIVE SCENARIO 
             11.8.1 DEALS
                        TABLE 295 DEALS, 2018–2023
             11.8.2 PRODUCT LAUNCHES
                        TABLE 296 PRODUCT LAUNCHES, 2018–2023
 
12 COMPANY PROFILES (Page No. - 251)
(Business overview, Products/Solutions/Services offered, Recent Developments, MNM view)*
     12.1 KEY PLAYERS 
             12.1.1 DOW, INC.
                        TABLE 297 DOW, INC.: COMPANY OVERVIEW
                        FIGURE 40 DOW, INC.: COMPANY SNAPSHOT
                        TABLE 298 DOW, INC.: DEALS
                        TABLE 299 DOW, INC.: PRODUCT/SERVICE LAUNCHES
                        TABLE 300 DOW, INC.: OTHERS
             12.1.2 BOREALIS AG
                        TABLE 301 BOREALIS AG: COMPANY OVERVIEW
                        FIGURE 41 BOREALIS AG: COMPANY SNAPSHOT
                        TABLE 302 BOREALIS AG: DEALS
                        TABLE 303 BOREALIS AG: PRODUCT/SERVICE LAUNCHES
                        TABLE 304 BOREALIS AG: OTHERS
             12.1.3 LYONDELLBASELL INDUSTRIES HOLDINGS B.V.
                        TABLE 305 LYONDELLBASELL INDUSTRIES HOLDINGS B.V.: BUSINESS OVERVIEW
                        FIGURE 42 LYONDELLBASELL INDUSTRIES HOLDINGS B.V.: COMPANY SNAPSHOT
                        TABLE 306 LYONDELLBASELL INDUSTRIES HOLDINGS B.V.: DEALS
                        TABLE 307 LYONDELLBASELL INDUSTRIES HOLDINGS B.V.: OTHERS
             12.1.4 EXXON MOBILE CORPORATION
                        TABLE 308 EXXON MOBILE CORPORATION: COMPANY OVERVIEW
                        FIGURE 43 EXXON MOBILE CORPORATION: COMPANY SNAPSHOT
                        TABLE 309 EXXON MOBILE CORPORATION: DEALS
                        TABLE 310 EXXON MOBILE CORPORATION: OTHERS
             12.1.5 AVIENT CORPORATION
                        TABLE 311 AVIENT CORPORATION: COMPANY OVERVIEW
                        FIGURE 44 AVIENT CORPORATION: COMPANY SNAPSHOT
                        TABLE 312 AVIENT CORPORATION: DEALS
                        TABLE 313 AVIENT CORPORATION: PRODUCT/SERVICE LAUNCHES
                        TABLE 314 AVIENT CORPORATION: OTHERS
             12.1.6 FINPROJECT S.P.A.
                        TABLE 315 FINPROJECT S.P.A..: COMPANY OVERVIEW
                        TABLE 316 FINPROJECT S.P.A.: DEALS
                        TABLE 317 FINPROJECT S.P.A.: PRODUCT/SERVICE LAUNCHES
                        TABLE 318 FINPROJECT S.P.A.: OTHERS
             12.1.7 3H VINACOM CO., LTD.
                        TABLE 319 3H VINACOM CO., LTD.: COMPANY OVERVIEW
             12.1.8 HANWHA SOLUTIONS CHEMICAL DIVISION CORPORATION
                        TABLE 320 HANWHA SOLUTIONS CHEMICAL DIVISION CORPORATION: COMPANY OVERVIEW
                        FIGURE 45 HANWHA SOLUTIONS CHEMICAL DIVISION CORPORATION: COMPANY SNAPSHOT
                        TABLE 321 HANWHA SOLUTIONS CHEMICAL DIVISION CORPORATION: DEALS
             12.1.9 HDC HYUNDAI EP COMPANY
                        TABLE 322 HDC HYUNDAI EP COMPANY: COMPANY OVERVIEW
                        FIGURE 46 HDC HYUNDAI EP COMPANY: COMPANY SNAPSHOT
             12.1.10 SACO AEI POLYMERS
                        TABLE 323 SACO AEI POLYMERS: COMPANY OVERVIEW
     12.2 OTHER PLAYERS 
             12.2.1 PALZIV NA
                        TABLE 324 PALZIV NA: COMPANY OVERVIEW
             12.2.2 KKALPANA INDUSTRIES LIMITED
                        TABLE 325 KKALPANA INDUSTRIES LIMITED: COMPANY OVERVIEW
             12.2.3 POLYLINK POLYMERS (INDIA) LTD.
                        TABLE 326 POLYLINK POLYMERS (INDIA) LTD.: COMPANY OVERVIEW
             12.2.4 ZHEJIANG WANMA MACROMOLECULE MATERIAL CO., LTD.
                        TABLE 327 ZHEJIANG WANMA MACROMOLECULE MATERIAL CO., LTD.: COMPANY OVERVIEW
             12.2.5 SANKHLA POLYMERS PVT. LTD.
                        TABLE 328 SANKHLA POLYMERS PVT. LTD.: COMPANY OVERVIEW
             12.2.6 SILON S.R.O.
                        TABLE 329 SILON S.R.O.: COMPANY OVERVIEW
             12.2.7 REHAU
                        TABLE 330 REHAU: COMPANY OVERVIEW
             12.2.8 ZIMMER BIOMET
                        TABLE 331 ZIMMER BIOMET: COMPANY OVERVIEW
             12.2.9 SHANGHAI SHENGHUA CABLE (GROUP) CO., LTD.
                        TABLE 332 SHANGHAI SHENGHUA CABLE (GROUP) CO., LTD.: COMPANY OVERVIEW
             12.2.10 JIANGSU XINDA TECH LIMITED
                        TABLE 333 JIANGSU XINDA TECH LIMITED: COMPANY OVERVIEW
             12.2.11 NOURYON
                        TABLE 334 NOURYON: COMPANY OVERVIEW
             12.2.12 ARKEMA
                        TABLE 335 ARKEMA: COMPANY OVERVIEW
             12.2.13 POLYROCKS CHEMICAL CO., LTD.
                                                TABLE 336 POLYROCKS CHEMICAL CO., LTD.: COMPANY OVERVIEW
             12.2.14 SABIC
                        TABLE 337 SABIC: COMPANY OVERVIEW
             12.2.15 GREENMER
                        TABLE 338 GREENMER: COMPANY OVERVIEW
 
*Details on Business overview, Products offered, Recent Developments, MNM view might not be captured in case of unlisted companies.
 
13 ADJACENT & RELATED MARKET (Page No. - 308)
     13.1 INTRODUCTION 
     13.2 LIMITATIONS 
     13.3 COATING EQUIPMENT 
             13.3.1 MARKET DEFINITION
             13.3.2 MARKET OVERVIEW
                        TABLE 339 WIRE & CABLE COMPOUNDS MARKET SIZE, BY TYPE, 2017–2020 (USD MILLION)
                        TABLE 340 WIRE & CABLE COMPOUNDS MARKET SIZE, BY TYPE, 2021–2026 (USD MILLION)
                        TABLE 341 WIRE & CABLE COMPOUNDS MARKET SIZE, BY END-USE INDUSTRY,  2017–2020 (USD MILLION)
                        TABLE 342 WIRE & CABLE COMPOUNDS MARKET SIZE, BY END-USE INDUSTRY,  2021–2026 (USD MILLION)
                        TABLE 343 WIRE & CABLE COMPOUNDS MARKET SIZE, BY REGION, 2017–2020 (USD MILLION)
                        TABLE 344 WIRE & CABLE COMPOUNDS MARKET SIZE, BY REGION, 2021–2026 (USD MILLION)
 
14 APPENDIX (Page No. - 313)
     14.1 DISCUSSION GUIDE 
     14.2 KNOWLEDGESTORE: MARKETSANDMARKETS’  SUBSCRIPTION PORTAL 
     14.3 CUSTOMIZATION OPTIONS 
     14.4 RELATED REPORTS 
     14.5 AUTHOR DETAILS 

Extensive secondary sources, directories, and databases such as Hoovers, Bloomberg BusinessWeek, Factiva, and OneSource have been used to identify and collect information for this technical, market-oriented, and commercial study of the cross-linked polyethylene (PEX) market. In-depth interviews were conducted with various primary respondents which included key industry participants, subject matter experts (SMEs), C-level executives of key industry players, and industry consultants, among other experts, to obtain and verify critical qualitative and quantitative information and to assess prospects.

Secondary Research

In the secondary research process, various secondary sources have been referred to for identifying and collecting information for this study. Secondary sources included annual reports, press releases, and investor presentations of companies; white papers; publications from recognized websites; and databases. Secondary research has mainly been used to obtain key information about the supply chain of the industry, the total pool of key players, market classification & segmentation according to the industry trends to the bottom-most level, regional markets, and key developments from both, market- and technology-oriented perspectives.

The market size of cross-linked polyethylene (PEX) has been estimated based on secondary data available through paid and unpaid sources, and by analyzing the product portfolios of key companies. This data has been further validated through various primary sources.

Primary Research

The cross-linked polyethylene (PEX) market comprises various stakeholders in the supply chain and includes suppliers, manufacturers, and end-product manufacturers. Various primary sources from the supply and demand sides of the cross-linked polyethylene (PEX) market have been interviewed to obtain qualitative and quantitative information. Primary participants from the supply side include key opinion leaders, executives, vice presidents, and CEOs of companies in the market. Primary sources from the demand side include experts from end-use industries, associations, and institutions involved in the market, and key opinion leaders.

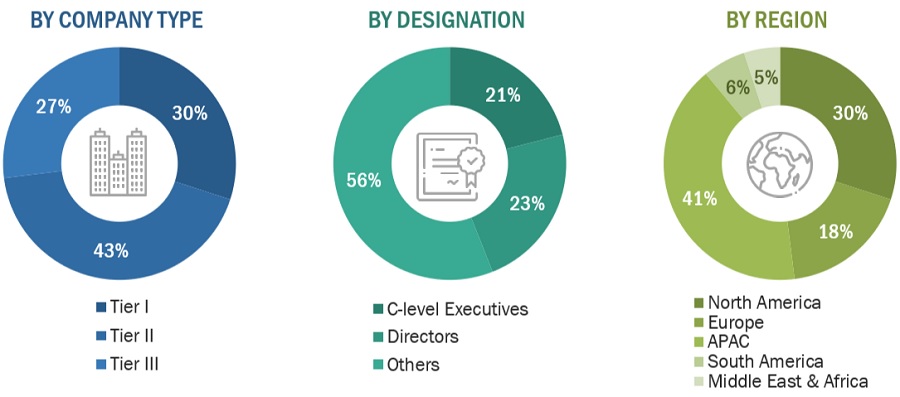
Following is the breakdown of primary respondents
Cross-linked Polyethylene (PEX) Market Size, and Share

To know about the assumptions considered for the study, download the pdf brochure

Notes: *Others include sales, marketing, and product managers.

Tier 1: >USD 5 Billion; Tier 2: USD 1 Billion– USD 5 Billion; and Tier 3: <USD 1 Billion.

Market Size Estimation

The supply-side and demand-side approaches have been extensively used, along with several data triangulation methods, for market size estimation and forecast of the overall market segments listed in this report. Extensive qualitative and quantitative data were analyzed to list key information/insights throughout the report. The research methodology used to estimate the market size includes the following:

  • The key players in the industry were identified through extensive secondary research.
  • The supply chain of the industry and market size, in terms of value, were determined through primary and secondary research.
  • All percentage shares split, and breakdowns were determined using secondary sources and verified through primary sources.
  • All possible parameters that affect the markets covered in this research study were accounted for, viewed in extensive detail, verified through primary research, and analyzed to obtain the final quantitative and qualitative data.
  • The research includes the study of annual reports, reviews, cross-linked polyethylene (PEX) associations, and newsletters of key industry players along with extensive interviews with key officials, such as directors and marketing executives.

Global cross-linked polyethylene (PEX) Market: Top-Down Approach

Cross-linked Polyethylene (PEX) Market Size, and Share

To know about the assumptions considered for the study, Request for Free Sample Report

Global cross-linked polyethylene (PEX) Market: Bottom-Up Approach

Cross-linked Polyethylene (PEX) Market Size, and Share

Data Triangulation

After arriving at the overall market size, the total market was split into several segments and subsegments. To complete the overall market estimation process and arrive at the exact statistics for all the segments and subsegments, data triangulation and market breakdown procedures were employed, wherever applicable. Data was triangulated by studying various factors and trends from both the demand and supply sides.

Market Definition

The Cross-linked Polyethylene (PEX) industry is a dynamic sector within the broader plastics and materials industry that primarily focuses on the production, distribution, and application of cross-linked polyethylene, a versatile and high-performance polymer material. PEX, or cross-linked polyethylene, is a remarkable type of plastic material characterized by the formation of a three-dimensional network of high molecular weight compounds through the bonding of its molecular chains. This cross-linking process greatly enhances several key properties of polyethylene, including its resistance to heat deformation, abrasion, chemicals, and stress-cracking. The transformation brought about by cross-linking turns polyethylene from a thermoplastic material into a thermosetting one, significantly increasing its overall strength and durability. PEX finds widespread use across diverse applications. It is commonly employed in building construction for pipework and tubing systems due to its ability to withstand temperature fluctuations and resist corrosion. In addition, PEX is favored for hydronic radiant heating and cooling systems, where its flexibility and resistance to temperature extremes are particularly advantageous.

Moreover, PEX serves as excellent insulation for high-voltage electrical cables, ensuring their safety and longevity. Its properties also make it an ideal choice for natural gas and offshore oil applications, as well as for transporting various chemicals. Furthermore, it plays a crucial role in the transportation of sewage and slurries, where its robust and corrosion-resistant nature is highly beneficial.

Key stakeholders

  • PEX manufacturers.
  • PEX traders, distributors, and suppliers
  • End-use industry participants of different segments of the PEX market
  • Government and research organizations
  • Associations and industrial bodies
  • Research and consulting firms
  • Research & development (R&D) institutions
  • Environmental support agencies
  • Investment banks and private equity firms

Report Objectives

  • To define, describe, and forecast the size of the cross-linked polyethylene (PEX) market in terms of value.
  • To provide information about the factors (drivers, restraints, opportunities, and industry-specific challenges) influencing the growth of the market
  • To forecast and analyze the market based on type, technology and end-use industry.
  • To analyze and forecast the market size with respect to five main regions, namely, Asia Pacific, North America, Europe, South America, and Middle east and Africa, along with their respective key countries
  • To analyze competitive developments such as mergers & acquisitions, joint ventures, and investments & expansions in the market
  • To analyze opportunities in the market for stakeholders and provide a detailed competitive landscape of the market leaders
  • To strategically profile the key players in the market and comprehensively analyze their core competencies

Available Customizations:

Along with the given market data, MarketsandMarkets offers customizations as per the specific needs of the companies. The following customization options are available for the report:

Product Analysis:

  • Product Matrix which gives a detailed comparison of the product portfolio of each company

Regional Analysis:

  • Further breakdown of the Rest of Asia Pacific cross-linked polyethylene (PEX) Market
  • Further breakdown of Rest of Europe cross-linked polyethylene (PEX) Market
  • Further breakdown of Rest of South America cross-linked polyethylene (PEX) Market
  • Further breakdown of Rest of Middle East & Africa cross-linked polyethylene (PEX) Market

Company Information:

  • Detailed analysis and profiling of additional market players (up to 5)
Custom Market Research Services

We will customize the research for you, in case the report listed above does not meet with your exact requirements. Our custom research will comprehensively cover the business information you require to help you arrive at strategic and profitable business decisions.

Request Customization
Report Code
CH 4904
Published ON
Oct, 2023
Choose License Type
BUY NOW
  • SHARE
X
Request Customization
Speak to Analyst
Speak to Analyst
OR FACE-TO-FACE MEETING
PERSONALIZE THIS RESEARCH
  • Triangulate with your Own Data
  • Get Data as per your Format and Definition
  • Gain a Deeper Dive on a Specific Application, Geography, Customer or Competitor
  • Any level of Personalization
REQUEST A FREE CUSTOMIZATION
LET US HELP YOU!
  • What are the Known and Unknown Adjacencies Impacting the Cross-linked Polyethylene (PEX) Market
  • What will your New Revenue Sources be?
  • Who will be your Top Customer; what will make them switch?
  • Defend your Market Share or Win Competitors
  • Get a Scorecard for Target Partners
CUSTOMIZED WORKSHOP REQUEST
+1-888-600-6441
  • Call Us
  • +1-888-600-6441 (Corporate office hours)
  • +1-888-600-6441 (US/Can toll free)
  • +44-800-368-9399 (UK office hours)
CONNECT WITH US
ABOUT TRUST ONLINE
©2024 MarketsandMarkets Research Private Ltd. All rights reserved
DMCA.com Protection Status Website Feedback