CubeSat Market by Application (Earth Observation & Traffic Monitoring, Communication, Science & Technology and Education), End User (Government & Military, Commercial, Non-profit Organizations), Size, Subsystem, and Region - Global Forecast to 2023


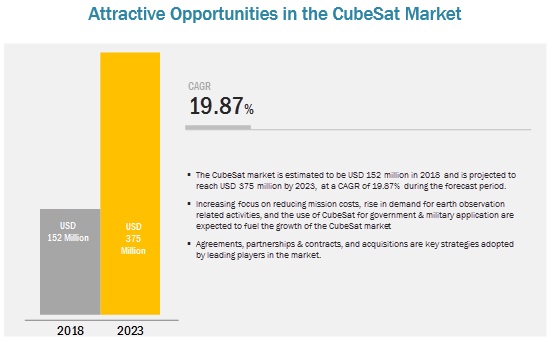
The global CubeSat market is projected to grow from USD 152 million in 2018 to USD 375 million by 2023, at a CAGR of 19.87% from 2018 to 2023. Exhaustive secondary research was undertaken to collect information on the CubeSat market, its peer markets, and its parent market. The next step was to validate these findings, assumptions, and sizing with industry experts across the value chain through primary research. Both, top-down and bottom-up approaches were employed to estimate the complete market size. Thereafter market breakdown and data triangulation were used to estimate the market size of segments and subsegments.
Secondary Research
In the secondary research process, various secondary sources, such as Hoovers, Bloomberg, BusinessWeek, and Space Magazines were referred to identify and collect information for this study. These secondary sources included annual reports, press releases & investor presentations of companies, certified publications, articles by recognized authors, CubeSat databases, and Nanosatellite databases.
Primary Research
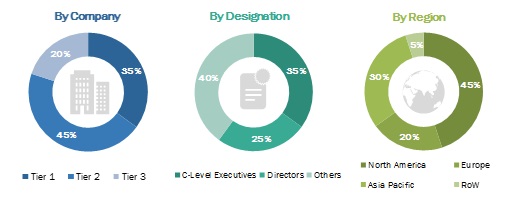
The CubeSat market comprises several stakeholders, such as raw material suppliers, processors, end-product manufacturers, and regulatory organizations in the supply chain. The demand side of this market is characterized by various end users, such as government & military organizations, commercial organizations, and science & technology and education organizations. The supply side is characterized by advancements in CubeSat technology, development of CubeSats, and software development. The following is the breakdown of primary respondents interviewed to obtain qualitative and quantitative information about the CubeSat market.
To know about the assumptions considered for the study, download the pdf brochure
Market Size Estimation
Both, the top-down and bottom-up approaches were used to estimate and validate the total size of the CubeSat market. These methods were also used extensively to estimate the size of the various subsegments in the market. The research methodology used to estimate the market size includes the following:
- Key players in the industry and market were identified through extensive secondary research
- The industry�s supply chain and market size, in terms of value, were determined through primary and secondary research processes
- All percentage shares, splits, and breakdowns were determined using secondary sources and verified through primary sources
Data Triangulation
After arriving at the overall market size using the market size estimation processes explained above the market was split into several segments and subsegments. In order to complete the overall market engineering process and arrive at the exact statistics of each market segment and subsegment, data triangulation and market breakdown procedures were employed, wherever applicable. The data was triangulated by studying various factors and trends from both, the demand and supply sides, in the CubeSat industry.
Report Objectives
- To define, describe, and forecast the size of the CubeSat market based on size, application, end user, subsystem, and region
- To identify and analyze key drivers, restraints, opportunities, and challenges influencing the growth of the CubeSat market
- To forecast the CubeSat market size of segments based on 4 regions, namely, North America, Europe, Asia Pacific, and the Rest of the World, along with major countries in each of these regions
- To strategically analyze micromarkets1 with respect to individual technological trends, prospects, and their contribution to the overall market
- To strategically profile key market players and comprehensively analyze their market share and core competencies2
- To provide a detailed competitive landscape of the CubeSat market, along with an analysis of business and corporate strategies such as joint ventures, mergers, and new product developments
- To identify detailed financial positions, key products, unique selling points, and key developments of leading companies in the CubeSat market
Note:
1. Micro markets are defined as further segments and subsegments of the CubeSat market included in the report
2. Core competencies of companies have been captured in terms of their key developments, SWOT analysis, and key strategies adopted by key players to sustain their position in the market
Get online access to the report on the World's First Market Intelligence Cloud
- Easy to Download Historical Data & Forecast Numbers
- Company Analysis Dashboard for high growth potential opportunities
- Research Analyst Access for customization & queries
- Competitor Analysis with Interactive dashboard
- Latest News, Updates & Trend analysis
Request Sample Scope of the Report
Get online access to the report on the World's First Market Intelligence Cloud
- Easy to Download Historical Data & Forecast Numbers
- Company Analysis Dashboard for high growth potential opportunities
- Research Analyst Access for customization & queries
- Competitor Analysis with Interactive dashboard
- Latest News, Updates & Trend analysis

|
Report Metric |
Details |
|
Market size available for years |
2016-2023 |
|
Base year considered |
2017 |
|
Forecast period |
2018-2023 |
|
Forecast unit |
Value (USD) |
|
Segments covered |
Size, Application, Subsystem, End User, and Region |
|
Geographies covered |
North America, APAC, Europe, and RoW |
|
Companies covered |
Planet Labs (US), Pumpkin Space Systems (US), GomSpace (Germany), Clyde Space (UK), Surrey Satellite Technologies (US), Sierra Nevada Corporation (US), Capella Space (US), Space Systems Loral (US), EnduroSat (Bulgaria), and CU Aerospace (US), among others |
This research report categorizes the CubeSat market based on size, application, subsystem, end user, and region.
On the basis of Application, the CubeSat market has been segmented as follows:
- Earth Observation & Traffic Monitoring
- Science & Technology, and Education
- Space Observation
- Communication
- Meteorology
On the basis of Subsystem, the CubeSat market has been segmented as follows:
- Payloads
- Solar Panels & Antenna Systems
- Propulsion Systems
- Attitude Determination & Control systems
- Electrical Power Systems (EPS)
- Structure
- Command & Data Handling (C&DH)
- Others (Deployers, Software, Onboard Computers, Ground Support Equipment, among others)
On the basis of size, the CubeSat market has been segmented as follows:
- 0.25U-1U
- 2U
- 3U
- 6U
- 12U
- Above 12U
On the basis of end user, the CubeSat market has been segmented as follows:
- Government & Military
- Commercial
- Non-profit Organizations
On the basis of region, the CubeSat market has been segmented as follows:
- North America
- Europe
- Asia Pacific
- Rest of the World (RoW)
Available Customizations
With the given market data, MarketsandMarkets offers customizations according to the company�s specific needs.
Product Analysis
- Product matrix, which gives a detailed comparison of the product portfolio of each company
Company Information
- Detailed analysis and profiles of additional market players (up to 5)
The global CubeSat market is projected to grow from USD 152 million in 2018 to USD 375 million by 2023, at a CAGR of 19.87% from 2018 to 2023 Some of the factors that are expected to fuel the growth of the CubeSat market are the increasing focus on reducing mission costs as well as the rise in demand for CubeSats in applications related to earth observation, communication, science, and technology. Various countries have been focusing on developing CubeSats, owing to their low cost and short development time made possible with the use of proven standard equipment and off-the-shelf components. Various commercial, as well as private ventures, have made significant investments in companies operating in the CubeSat market to capitalize on the opportunities presented through low-cost CubeSat missions related to communication, Earth observation, and science & technology, among others.
Based on application, the Earth observation & traffic monitoring segment is expected to grow at the highest CAGR during the forecast period
Based on application, the Earth observation & traffic monitoring of the CubeSat market is estimated to grow at the highest CAGR in 2018, as collection of information about the Earth's physical, chemical, and biological systems by means of remote sensing technologies is continuously evolving. Over 100 countries and a similar number of organizations have formed the Group on Earth Observations, whose members are also growing annually. This group is dedicated to constructing a global platform for Earth Observation content distribution. The demand for CubeSats to carry out such Earth observation surveys is increasing, which will result in the growth of the CubeSat market in the coming years.
Based on end user, the commercial segment is expected to lead the CubeSat market from 2018 to 2023
Based on end user, the CubeSat market has been segmented into government & military, commercial, and non-profit organizations. The growth of the commercial segment can be attributed to the increased interest of the US Federal Government towards the use of commercial space services for all aspects of their missions, along with the increasing demand for high-resolution satellite imagery from commercial satellite operators.
Based on size, the 3U segment is expected to grow at the highest CAGR in the CubeSat market from 2018 to 2023
Based on size, the CubeSat market has been segmented into 0.25U to 1U, 2U, 3U, 6U, 12U and Above 12U. 3U CubeSats can be used for high precision and complex space missions, such as Earth observation, meteorology, remote sensing, maritime & transportation management, disaster management, military intelligence, and other academic purposes.
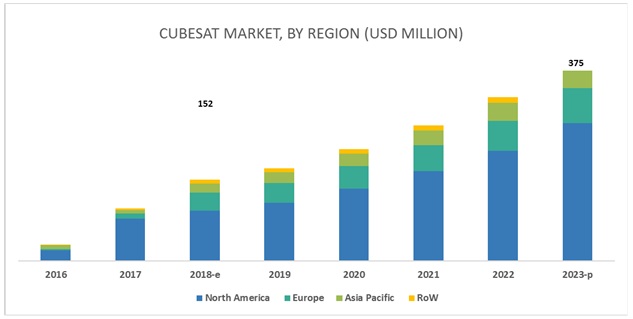
The North America region is expected to lead the CubeSat market from 2018 to 2023
The North America region is expected to exhibit the highest growth rate in the CubeSat market during the forecast period due to the number of CubeSats launched every year and the increasing demand for CubeSats from NASA, the Department of Defense, and the private sector, such as research organizations.
Key Market Players
The major players in the CubeSat market include Planet Labs (US), Pumpkin Space Systems (US), GomSpace (Germany), Clyde Space (UK), Surrey Satellite Technologies (US), Sierra Nevada Corporation (US), Capella Space (US), Space Systems Loral (US), EnduroSat (Bulgaria), and CU Aerospace (US). These players have adopted various growth strategies, such as contracts, acquisitions, expansions, and partnerships/collaborations, to further expand their presence in the global CubeSat market.
Recent Developments
- In August 2018, GomSpace A/S, a subsidiary of GomSpace AD, received a contract from Innovation Fund Denmark (Denmark) to develop network management technologies for the smooth operation and management of large satellite constellations.
- In October 2018, AAC Clyde, the parent company of Clyde Space, received a follow-up contract from Kepler Communications (Canada) to use 6U machines to offer satellite communication services for the Internet of Things (IoT) applications and data backhaul applications.
- In August 2018, Space Systems Loral partnered with Thales Alenia Space (France) to form a consortium, which received a systems design and risk management contract for the LEO communications satellite of Telesat (Canada).
Key Questions Addressed by the Report
- What are your views on the growth perspective of the CubeSat market? What are key dynamics and trends that govern the market, such as drivers and opportunities??
- What are the key sustainability strategies adopted by leading players operating in the CubeSat market?
- What are the new emerging technologies and use cases disrupting the Space Industry?
- Which applications do CubeSats play a significant role in?
- What are the key trends and opportunities in the CubeSat market across different regions and their respective countries?
- Who are the key players and innovators in the partnership ecosystem?
- How is the competitive landscape changing in the client ecosystem and impacting their revenue shares?
To speak to our analyst for a discussion on the above findings, click Speak to Analyst
Table of Contents
1 Introduction (Page No. - 18)
1.1 Objectives of the Study
1.2 Market Definition
1.2.1 Markets Covered
1.2.2 Years Considered for the Study
1.3 Currency & Pricing
1.4 Limitations
1.5 Market Stakeholders
2 Research Methodology (Page No. - 22)
2.1 Research Data
2.1.1 Secondary Data
2.1.1.1 Key Data From Secondary Sources
2.1.2 Primary Data
2.1.2.1 Key Data From Primary Sources
2.1.3 Market Definition & Scope
2.1.4 Segments and Subsegments
2.1.5 Segment Definitions
2.1.5.1 CubeSat Market, By Size
2.1.5.2 CubeSat Market, By Application
2.1.5.3 CubeSat Market, By Subsystem
2.1.5.4 CubeSat Market, By End User
2.1.6 Exclusions
2.2 Research Approach & Methodology
2.2.1 Bottom-Up Approach
2.2.1.1 Regional CubeSat Market
2.2.1.2 CubeSat Market for Size Segment
2.2.1.3 CubeSat Market for Application Segment
2.2.1.4 CubeSat Market for End-User Segment
2.2.1.5 CubeSat Market for Subsystem Segment
2.2.2 Top-Down Approach
2.2.3 Pricing Analysis
2.3 Triangulation & Validation
2.3.1 Triangulation Through Secondary
2.3.2 Triangulation Through Primaries
2.4 Research Assumptions
2.4.1 Market Sizing
2.4.2 Market Forecasting
2.5 Risks
2.6 Others
2.6.1 Limitations/Grey Areas
2.6.1.1 Pricing
2.6.1.2 Volume
2.6.1.3 Market Size & CAGR
3 Executive Summary (Page No. - 35)
4 Premium Insights (Page No. - 39)
4.1 Attractive Growth Opportunities in the CubeSat Market
4.2 CubeSat Market, By Size
4.3 CubeSat Market, By Application
4.4 CubeSat Market for Commercial End Users, By Type
4.5 CubeSat Market, By Region
5 Market Overview (Page No. - 42)
5.1 Introduction
5.2 Volume Analysis
5.3 Market Dynamics
5.3.1 Drivers
5.3.1.1 New Application Areas for CubeSats
5.3.1.2 Economical Compared to Conventional Satellites
5.3.2 Restraints
5.3.2.1 Lack of Launch Vehicles
5.3.3 Opportunities
5.3.3.1 Development of Advanced Technologies
5.3.3.2 Technological Advancements in CubeSat Batteries
5.3.3.3 Testing of New Technologies
5.3.4 Challenges
5.3.4.1 Communication Issues
5.3.4.2 Addition to Space Debris
5.3.4.3 Rigid Design Structure
6 Industry Trends (Page No. - 47)
6.1 Introduction
6.2 CubeSat Electric Power System (EPS) Design
6.3 Space Industry Supply Chain
6.3.1 Overview of Satellite Supply Chain Elements From Contractors to Material Suppliers
6.3.2 Risk Areas in CubeSat Supply Chain
6.4 Technology Trends
6.4.1 State-Of-The-Art CubeSat Technologies
6.4.2 Distributed Electric Power System (EPS) in CubeSat Applications
6.4.3 Hyper-Spectral and Multi-Spectral Imaging
6.4.4 Energy Storage (Primary & Secondary Batteries)
6.4.5 Development of CubeSat Constellations to Enhance Communication
6.4.6 Development of CubeSats Using Additive Manufacturing
6.5 Emerging Trends
6.5.1 Technical Evolution in CubeSats
6.5.2 Technological Advancements in Earth Observation Services
6.6 Nanosatellite Crowdfunding Campaigns
6.6.1 Innovations & Patent Registrations
7 CubeSat Market, By Size (Page No. - 57)
7.1 Introduction
7.2 0.25u � 1U (Up to 2.0 Kg)
7.2.1 Key Focus on Developing 0.25u � 1U CubeSats for Communication
7.3 2U (2.0 Kg to 4.0 Kg)
7.3.1 2U CubeSats are Used for Testing Emerging Technologies
7.4 3U (4.0 Kg to 6.0 Kg)
7.4.1 Key Focus on Developing 3U CubeSats for Earth Observation and Traffic Monitoring
7.5 6U (6.0 Kg to 12.0 Kg)
7.5.1 Increasing Demand for 6U CubeSats Used in Space Science Missions
7.6 12U (Above 12.0 Kg)
7.6.1 Increasing Demand for 12U CubeSats Used in Deep Space Missions
7.7 Above 12U
7.7.1 Above 12U CubeSats are Mainly Used in Earth Observation, Communication, and Science and Technology Applications
8 CubeSat Market, By Application (Page No. - 63)
8.1 Introduction
8.2 Earth Observation & Traffic Monitoring
8.2.1 Increasing Demand for Real-Time Data and Earth Imaging
8.3 Meteorology
8.3.1 Demand for Weather Forecasting Services are Driving the Growth of CubeSats Used for Meteorology
8.4 Space Observation
8.4.1 Rising Demand for Lower Earth Orbit (LEO)-Based Services
8.5 Communication
8.5.1 Increasing Use of CubeSats for Communication
8.6 Science & Technology and Education
8.6.1 Demand for CubeSats has Increased Due to Its Application in Testing New Technologies
9 CubeSat Market, By Subsystem (Page No. - 71)
9.1 Introduction
9.2 Structures
9.2.1 Standardized Structure Allows New Entrants Into the Market
9.3 Payloads
9.3.1 Miniaturization of Payloads Broadens Scope for CubeSat Applications
9.3.2 Solar Panels& Antenna Systems
9.3.2.1 Development of New Solar Panels With Inbuilt Antenna Enhances the Capabilities of CubeSats
9.4 Electrical Power Systems (EPS)
9.4.1 Advancement in Battery Technologies
9.5 Command & Data Handling (C&DH)
9.5.1 Advantage of Open Source Software and Hardware Provides an Easy Entry for Newspace Companies
9.6 Attitude Determination & Control Systems
9.6.1 Launch of CubeSats Into Deep Space Requires Advanced Attitude Determination & Control Systems
9.7 Propulsion Systems
9.7.1 High Efficiency and Technological Advancements in Propulsion Systems
9.8 Others
10 CubeSat Market, By End User (Page No. - 79)
10.1 Introduction
10.2 Government & Military
10.2.1 CubeSats are Used for Border Patrolling By Providing Real-Time Data to Military Intelligence Units
10.2.2 Defense Organizations
10.2.2.1 Increasing Demand for Real-Time Data and Imaging
10.2.3 Space Agencies
10.2.3.1 Use of CubeSats for Preliminary Phases of Space Missions
10.3 Commercial
10.3.1 Increasing Involvement of Private Players in the Global Space Industry
10.3.2 Energy & Power
10.3.2.1 Demand for Monitoring Structural Integrity of Nuclear Power Stations
10.3.3 Agriculture
10.3.3.1 Increasing Demand for Nvdi Grids and Maps
10.3.4 Environmental Protection
10.3.4.1 CubeSats are Used to Improve Disaster Relief and Monitor Crop Yield
10.3.5 Maritime
10.3.5.1 CubeSats are Used in Logistics Tracking, Fleet Management, and Route Planning
10.3.6 Others
10.4 Non-Profit Organizations
10.4.1 Provide Practical Experience to Students
11 Regional Analysis (Page No. - 85)
11.1 Introduction
11.2 North America
11.2.1 US
11.2.1.1 The US Uses Most CubeSats for Earth Observation and Traffic Monitoring Applications
11.2.2 Canada
11.2.2.1 The Canadian Space Agency (CSA) has Selected 15 University Teams to Participate in the Canadian CubeSat Project
11.3 Europe
11.3.1 Russia
11.3.1.1 Russia is Developing CubeSats for Advanced Space Technology Demonstration Missions
11.3.2 UK
11.3.2.1 Earth Observation has Been One of the Major Application Areas for CubeSats in the UK
11.3.3 France
11.3.3.1 France�s National Investment Program in the Space Sector has Enabled Private Players to Develop Reliable Communication Solutions for CubeSats
11.3.4 Germany
11.3.4.1 German Orbital Systems is Developing CubeSats for Communication Applications
11.3.5 Italy
11.3.5.1 Italy�s Earth Observation & Traffic Monitoring Segment is Projected to Have the Highest CAGR
11.3.6 Rest of Europe (RoE)
11.3.6.1 Increasing Demand for CubeSats for Earth Observation & Traffic Monitoring
11.4 Asia Pacific
11.4.1 China
11.4.1.1 China is A Leading Manufacturer of Military and Commercial Satellites
11.4.2 Japan
11.4.2.1 Japan is Working Actively on Developing Nanosatellites
11.4.3 India
11.4.3.1 Isro is Focusing on Developing Nanosatellites, Which Will Drive the CubeSat Market in India
11.4.4 South Korea
11.4.4.1 South Korea is Making Efficient Use of CubeSats in Its Rapidly Growing Defense Sector
11.4.5 Rest of Asia Pacific
11.4.5.1 The Science & Technology and Education Segment is Expected to Grow at the Highest CAGR During the Forecast Period
11.5 Rest of the World (RoW)
11.5.1 Middle East
11.5.1.1 The Middle East is Using Earth Observation and Communication Satellites to Expand Its Network Coverage
11.5.2 Latin America
11.5.2.1 Lower Cost of CubeSats has Allowed Latin American Countries to Incorporate Them in Various Industries
11.5.3 South Africa
11.5.3.1 South Africa is Developing Extremely High-Resolution Hyper-Spectral Cameras for CubeSats
12 Competitive Landscape (Page No. - 119)
12.1 Introduction
12.2 Competitive Analysis
12.3 Market Ranking Analysis
12.4 Competitive Scenario
12.4.1 Contracts
12.4.2 Partnerships/Collaborations
12.4.3 Acquisitions
12.4.4 Expansions
13 Company Profiles (Page No. - 126)
13.1 Gomspace
13.1.1 Business Overview
13.1.2 Solutions Offered
13.1.3 Recent Developments
13.1.4 SWOT Analysis
13.1.5 MnM View
13.2 Nanoavionics
13.2.1 Business Overview
13.2.2 Products Offered
13.2.3 Recent Developments
13.3 Sierra Nevada Corporation
13.3.1 Business Overview
13.3.2 Products, Services, and Solutions Offered
13.4 Clyde Space
13.4.1 Business Overview
13.4.2 Products Offered
13.4.3 Recent Developments
13.5 Surrey Satellite Technology
13.5.1 Business Overview
13.5.2 Products, Services, and Solutions Offered
13.5.3 Recent Developments
13.6 Adcole Maryland Aerospace
13.6.1 Business Overview
13.6.2 Products Offered
13.7 Tyvak Nano-Satellite Systems
13.7.1 Business Overview
13.7.2 Products Offered
13.7.3 Recent Developments
13.8 CU Aerospace
13.8.1 Business Overview
13.8.2 Products Offered
13.8.3 Recent Developments
13.9 Busek Co.
13.9.1 Business Overview
13.9.2 Products Offered
13.9.3 Recent Developments
13.10 Space Systems Loral (SSL)
13.10.1 Business Overview
13.10.2 Products Offered
13.10.3 Recent Developments
13.11 Endurosat
13.11.1 Business Overview
13.11.2 Products Offered
13.11.3 Recent Developments
13.12 Pumpkin Space Systems
13.12.1 Business Overview
13.12.2 Products Offered
13.12.3 Recent Developments
13.13 Planet Labs
13.13.1 Business Overview
13.13.2 Products & Services Offered
13.13.3 Recent Developments
13.14 Harris Corporation
13.14.1 Business Overview
13.14.2 Products Offered
13.14.3 Recent Developments
13.14.4 SWOT Analysis
13.14.5 MnM View
13.15 OHB SE
13.15.1 Business Overview
13.15.2 Products & Services Offered
13.15.3 Recent Developments
13.15.4 SWOT Analysis
13.15.5 MnM View
13.16 Other Companies
13.16.1 Innovative Solutions in Space
13.16.2 Capella Space
13.16.3 The Boeing Company
13.16.4 Lockheed Martin Corporation
13.16.5 Blue Canyon Technologies
13.16.6 Kubos Corporation
13.16.7 Utias Space Flight Laboratory (SFL)
13.16.8 Berlin Space Technologies (BST)
13.16.9 Dhv Technology
13.16.10 G.A.U.S.S.
14 Appendix (Page No. - 158)
14.1 Discussion Guide
14.2 Knowledge Store: Marketsandmarkets� Subscription Portal
14.3 Available Customization
14.4 Related Reports
14.5 Author Details
List of Tables (89 Tables)
Table 1 Crowdfunding Companies in CubeSats (2016-2018)
Table 2 Innovations & Patent Registrations, 2012-2017
Table 3 CubeSat Market Size, By Size, 2016�2023 (USD Million)
Table 4 0.25u � 1U CubeSat Market Size, By Region, 2016�2023 (USD Million)
Table 5 2U CubeSat Market Size, By Region, 2016�2023 (USD Million)
Table 6 3U CubeSat Market Size, By Region, 2016�2023 (USD Million)
Table 7 6U CubeSat Market Size, By Region, 2016�2023 (USD Million)
Table 8 12U CubeSat Market Size, By Region, 2016�2023 (USD Million)
Table 9 12U Above CubeSat Market Size, By Region, 2016�2023 (USD Million)
Table 10 Market Size, By Application, 2016�2023 (USD Million)
Table 11 Market Size in Earth Observation & Traffic Monitoring, By Region, 2016�2023 (USD Million)
Table 12 Market Size in Earth Observation & Traffic Monitoring, By Size, 2016�2023 (USD Million)
Table 13 Market Size in Meteorology, By Region, 2016�2023 (USD Million)
Table 14 CubeSat Market Size in Meteorology, By Size, 2016�2023 (USD Million)
Table 15 CubeSat Market Size in Space Observation, By Region, 2016�2023 (USD Million)
Table 16 CubeSat Market Size in Space Observation, By Size, 2016�2023 (USD Million)
Table 17 CubeSat Market Size in Communication, By Region, 2016�2023 (USD Million)
Table 18 Market Size in Communication, By Size, 2016�2023 (USD Million)
Table 19 Market Size in Science & Technology and Education, By Region, 2016�2023 (USD Million)
Table 20 Market Size in Science & Technology and Education, By Size, 2016�2023 (USD Million)
Table 21 Market Size, By Subsystem, 2016�2023 (USD Million)
Table 22 CubeSat Structures Market Size, By Region, 2016�2023 (USD Million)
Table 23 CubeSat Payloads Market Size, By Region, 2016�2023 (USD Million)
Table 24 CubeSat Solar Panels & Antenna Systems Market Size, By Region, 2016�2023 (USD Million)
Table 25 CubeSat Electrical Power Systems Market Size, By Region, 2016�2023 (USD Million)
Table 26 CubeSat Command & Data Handling (C&DH) Market Size, By Region, 2016�2023 (USD Million)
Table 27 CubeSat Attitude Determination & Control Systems Market Size, By Region, 2016�2023 (USD Million)
Table 28 CubeSat Propulsion Systems Market Size, By Region, 2016�2023 (USD Million)
Table 29 Other Subsystems Market Size, By Region, 2016�2023 (USD Million)
Table 30 CubeSat Market Size, By End User, 2016�2023 (USD Million)
Table 31 CubeSat Market Size for Government & Military, By Region, 2016�2023 (USD Million)
Table 32 Market Size for Government & Military, By Type, 2016�2023 (USD Million)
Table 33 Market Size for Commercial, By Region, 2016�2023 (USD Million)
Table 34 CubeSat Market Size for Commercial, By Type, 2016�2023 (USD Million)
Table 35 Market Size for Non-Profit Organizations, By Region, 2016�2023 (USD Million)
Table 36 CubeSat Market Size, By Region, 2016-2023 (USD Million)
Table 37 North America Market Size, By Size, 2016�2023 (USD Million)
Table 38 North America CubeSat Market Size, By Application, 2016�2023 (USD Million)
Table 39 North America Market Size, By End User, 2016�2023 (USD Million)
Table 40 North America CubeSat Market Size, By Subsystem, 2016�2023 (USD Million)
Table 41 North America Market Size, By Country, 2016�2023 (USD Million)
Table 42 US Market Size, By Application, 2016�2023 (USD Million)
Table 43 US Market Size, By End User, 2016�2023 (USD Million)
Table 44 Canada Market Size, By Application, 2016�2023 (USD Million)
Table 45 Canada Market Size, By End User, 2016�2023 (USD Million)
Table 46 Europe Market Size, By Size, 2016�2023 (USD Million)
Table 47 Europe Market Size, By Application, 2016�2023 (USD Million)
Table 48 Europe Market Size, By End User, 2016�2023 (USD Million)
Table 49 Europe Market Size, By Subsystem, 2016�2023 (USD Million)
Table 50 Europe Market Size, By Country, 2016�2023 (USD Million)
Table 51 Russia Market Size, By Application, 2016�2023 (USD Million)
Table 52 Russia Market Size, By End User, 2016�2023 (USD Million)
Table 53 UK Market Size, By Application, 2016�2023 (USD Million)
Table 54 UK Market Size, By End User, 2016�2023 (USD Million)
Table 55 France Market Size, By Application, 2016�2023 (USD Million)
Table 56 France Market Size, By End User, 2016�2023 (USD Million)
Table 57 Germany Market Size, By Application, 2016�2023 (USD Million)
Table 58 Germany Market Size, By End User, 2016�2023 (USD Million)
Table 59 Italy Market Size, By Application, 2016�2023 (USD Million)
Table 60 Italy Market Size, By End User, 2016�2023 (USD Million)
Table 61 RoE Market Size, By Application, 2016�2023 (USD Million)
Table 62 RoE Market Size, By End User, 2016�2023 (USD Million)
Table 63 Asia Pacific Market Size, By Size, 2016�2023 (USD Million)
Table 64 Asia Pacific Market Size, By Application, 2016�2023 (USD Million)
Table 65 Asia Pacific Market Size, By End User, 2016�2023 (USD Million)
Table 66 Asia Pacific Market Size, By Subsystem, 2016�2023 (USD Million)
Table 67 Asia Pacific Market Size, By Country, 2016�2023 (USD Million)
Table 68 China Market Size, By Application, 2016�2023 (USD Million)
Table 69 China Market Size, By End User, 2016�2023 (USD Million)
Table 70 Japan Market Size, By Application, 2016�2023 (USD Million)
Table 71 Japan Market Size, By End User, 2016�2023 (USD Million)
Table 72 India Market Size, By Application, 2016�2023 (USD Million)
Table 73 India Market Size, By End User, 2016�2023 (USD Million)
Table 74 South Korea Market Size, By Application, 2016�2023 (USD Million)
Table 75 South Korea Market Size, By End User, 2016�2023 (USD Million)
Table 76 Rest of Asia Pacific Market Size, By Application, 2016�2023 (USD Million)
Table 77 Rest of Asia Pacific Market Size, By End User, 2016�2023 (USD Million)
Table 78 RoW Market Size, By Size, 2016�2023 (USD Million)
Table 79 RoW Market Size, By Application, 2016�2023 (USD Million)
Table 80 RoW Market Size, By End User, 2016�2023 (USD Million)
Table 81 RoW Market Size, By Subsystem, 2016�2023 (USD Million)
Table 82 RoW Market Size, By Region, 2016�2023 (USD Million)
Table 83 Middle East Market Size, By Application, 2016�2023 (USD Million)
Table 84 Middle East Market Size, By End User, 2016�2023 (USD Million)
Table 85 Latin America Market Size, By Application, 2016�2023 (USD Million)
Table 86 Latin America Market Size, By End User, 2016�2023 (USD Million)
Table 87 South Africa Market Size, By Application, 2016�2023 (USD Million)
Table 88 South Africa Market Size, By End User, 2016�2023 (USD Million)
Table 89 Ranking of Key Players in Market, 2017
List of Figures (36 Figures)
Figure 1 CubeSat Market Segmentation
Figure 2 Research Process Flow
Figure 3 CubeSat Market: Research Design
Figure 4 Market Size Estimation Methodology: Bottom-Up Approach
Figure 5 Market Size Estimation Methodology: Top-Down Approach
Figure 6 Data Triangulation
Figure 7 Assumptions of the Research Study
Figure 8 3U Subsegment of the CubeSat Market is Projected to Grow at the Highest CAGR During the Forecast Period
Figure 9 Commercial End-User Segment is Projected to Grow at the Highest CAGR During the Forecast Period
Figure 10 Earth Observation & Traffic Monitoring Application Segment Projected to Lead the CubeSat Market in 2018
Figure 11 North America Estimated to Lead the CubeSat Market in 2018
Figure 12 Demand for Nanosatellites and Increase in Earth Observation & Space Exploration Activities are Driving the Growth of the CubeSat Market
Figure 13 3U Segment Expected to Lead the CubeSat Market During the Forecast Period
Figure 14 Earth Observation & Traffic Monitoring Segment Expected to Lead CubeSat Market From 2018 to 2023
Figure 15 Environmental Protection Segment Expected to Lead the CubeSat Market for Commercial End Users From 2018 to 2023
Figure 16 North America Expected to Lead the CubeSat Market From 2018 to 2023
Figure 17 The Forecast Period Volume Analysis, By Region (2016-2023)
Figure 18 CubeSat Market: Drivers, Restraints, Opportunities & Challenges
Figure 19 CubeSats Launched From 2014 to 2018
Figure 20 Breakdown of Space Debris in 2017
Figure 21 CubeSat EPS Block Diagram
Figure 22 Space Industry Supply Chain
Figure 23 Power Distribution Reliability, 2017
Figure 24 3U CubeSat Segment Expected to Grow at the Highest CAGR During the Forecast Period
Figure 25 Earth Observation & Traffic Monitoring Segment Expected to Lead CubeSat Market During the Forecast Period
Figure 26 Payloads Segment Expected to Lead CubeSat Market During Forecast Period
Figure 27 Commercial Organizations Segment Expected to Lead CubeSat Market in 2023
Figure 28 CubeSat Market Snapshot
Figure 29 North America CubeSat Market Snapshot
Figure 30 Europe CubeSat Market Snapshot
Figure 31 Asia Pacific CubeSat Market Snapshot
Figure 32 Companies Adopted Contracts as Key Growth Strategy Between January 2016 and November 2018
Figure 33 Leading Companies in Market, By Region, 2017
Figure 34 Gomspace: Company Snapshot
Figure 35 Harris Corporation: Company Snapshot
Figure 36 OHB SE: Company Snapshot


Growth opportunities and latent adjacency in CubeSat Market
I am evaluating the microsatellite business in general and the sectors it is impacting from a science application perspective. As microsats become more capable, they open up sectors traditionally the domain of major satellite deployment and companies if not governments. Would also like to evaluate this report as a sample of all wide ranging services offered by your company.