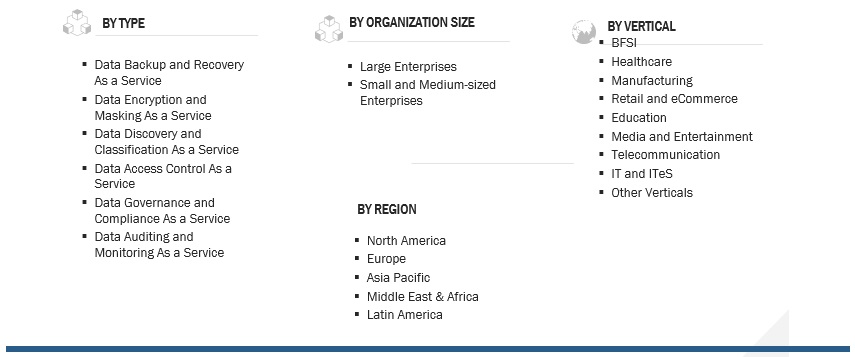
Data Security as a Service Market

Data Security as a Service Market by Type (Data Encryption and Masking as a Service, Data Governance and Compliance as a Service), Organization Size, Vertical (BFSI, IT and ITeS, Healthcare, Manufacturing, Education) and Region - Global Forecast to 2027

Report Code: TC 8552 Jan, 2023, by marketsandmarkets.com

Data Security as a Service Market Size

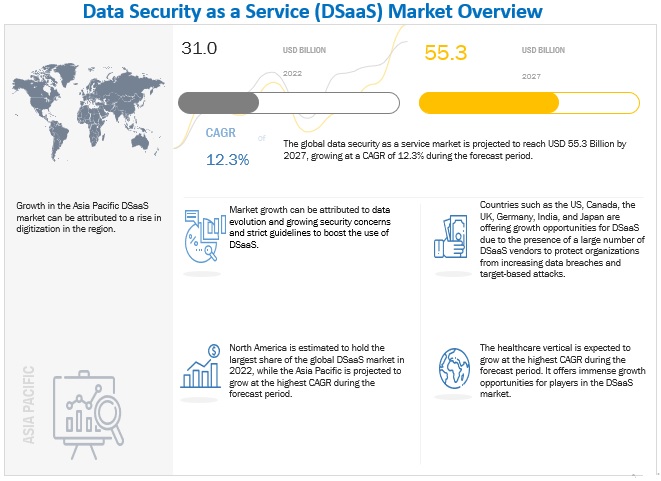
The data security as a service (DSaaS) market size is projected to grow at a CAGR of 12.3% during the forecast period to reach USD 55.3 billion by 2027 from an estimated USD 31.0 billion in 2022.

Data Security as a Service Market Growth

Factors driving market growth include the growing adoption of data security as a service (DSaaS) due to the rising amount of generated data and its associated security issues; and the prime focus on the significant data loss caused by the increasing number of data breaches and thefts. However, integration with existing infrastructure, low-security budget, and spending is expected to hinder market growth.
 

Data Security as a Service Market

To know about the assumptions considered for the study, Request for Free Sample Report

Data Security as a Service Market Dynamics

Driver:  Data evolution and growing security problems

Enterprises are becoming more concerned about enhanced data security and privacy protections because of the growing data evolution. At the same time, they do not want to expose the data to internal monitoring and breaches. In today's digitally transformed world, every endpoint gateway, sensor, and smartphone has become a potential target for hackers. Enterprises require data security services since the data needs to be safeguarded and backed up at every instance. Some businesses have constrained memory, computing power, and battery life. It indicates that traditional IT security systems sometimes cannot handle security situations due to cyberattacks. Addressing the issue would accelerate the adoption of data security services drastically.

Restraint: Low data security spending and expensive installation

High installation costs and complicated integration requirements hamper the initial adoption of data security solutions. Due to the integration of high-quality hardware, data security systems have a significant initial investment and ongoing maintenance costs. The budgets set aside to address cybersecurity issues are not keeping up with the growth of the necessary resources. Most small businesses lack the necessary resources and IT security skills to embrace improved cybersecurity solutions and services and protect their networks and IT infrastructure from various cyberattacks. For certain SMEs, a lack of capital resources can be a significant barrier to adopting a data security architecture.

Due to their limited financial resources, many businesses lack an adequate IT security infrastructure, which slows the adoption of new technologies and corporate security solutions and services. Appropriately administrating projected budget money for various operational issues and business continuity planning burdens small businesses. Organizations must recognize which program elements and information assets are more crucial to growing security threats since data security budgets will not be sufficient to meet data security needs. Due to the availability of cloud-based solutions and ongoing market advancements in data security as a service, this factor's impact will diminish during the projected period.

Opportunity: Increased adoption of cloud technology in enterprises

Multiple enterprises are willingly choosing the technologies that best correspond with their various platforms, making multi-cloud strategies the standard rather than the exception. Building robust architectures that can coexist and work with several cloud service providers is crucial.

Cloud-based data security solutions and service providers are anticipated to see increased growth prospects as SMEs focus on cloud solutions to protect their data from security breaches and vulnerabilities. Infrastructure as a service (laaS), platform as a service (PaaS), and software as service (SaaS) models are all offered by cloud service providers. These approaches are vulnerable to application vulnerabilities, malware, viruses, advanced persistent threats (APTs), distributed denial-of-service (DDoS) assaults, and access management and data security breaches. Data security measures like encryption, tokenization, DLP, and masking are effectively provided by cloud access security brokers (CASBS), who effectively protect data residing in cloud and on-premises environments.

With growing concerns about cloud data security, the demand for integrated, cloud-based data security solutions has increased, propelling the data security as a service market forward.

Challenge: Synchronizing management of unstructured to structured data

Enterprises struggle with managing unstructured information significantly, and solution suppliers work to ensure data security. The data retrieved through emails, social media posts, and client conversations is known as unstructured data. Although managing unstructured data can be challenging, it can also be a prosperous source of information for businesses. Unstructured data presents issues in quantity, quality, usability, and relevancy. Since unstructured data does not integrate well with conventional backup solutions, managing it becomes exceedingly challenging. As the data created is in terabytes, the file size is one of the most significant issues in the backup procedure. The issue is getting worse every day because of the massive growth in data. Another big problem for providers is the variety of data because it is challenging to optimize. These are some of the main obstacles preventing the market for data security as a service from expanding.

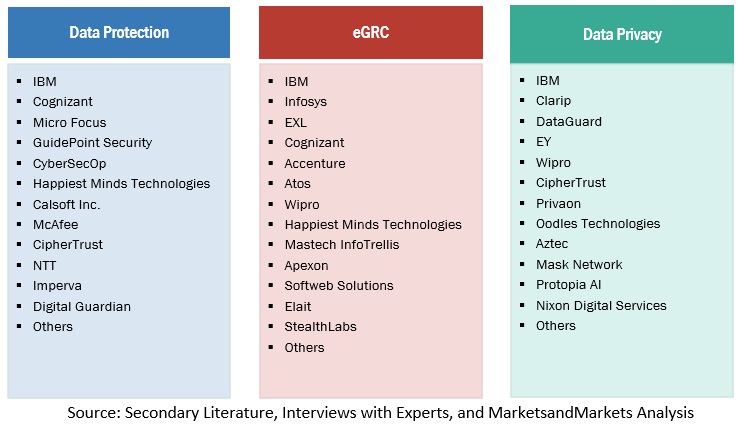
Data Security as a Service (DSaaS) Market Ecosystem
Data Security as a Service Market

To know about the assumptions considered for the study, download the pdf brochure

By type, Data Governance & Compliance as a Service segment to grow at the highest CAGR during the forecast period

Data governance is a process that helps organizations manage and secure both structured and unstructured data in their enterprise workstations and cloud environments. As unstructured data accounts for a large portion of enterprise data and is expected to grow rapidly, managing it can be difficult. Data governance solutions provide an automated, scalable, and interoperable platform to address these challenges, making it easier to govern access to this large amount of data. With a data governance solution, organizations can identify where data resides and determine who is responsible for it and who has access to it, making it a critical tool for managing and securing data.

By vertical, the Healthcare segment is to grow at the highest CAGR during the forecast period

The healthcare segment includes various entities such as hospitals, clinics, pharmaceuticals, and life sciences. Data security is critical in this vertical as it deals with sensitive personal health information and critical patient data. There is a growing need to protect internal healthcare data within organizations, as many organizations prioritize protecting customer data but neglect internal data protection.

Data security as a service (DSaaS) solutions ensure that the organization's data is available in different silos and remain integrated, confidential, and available. Some of the significant data measures adopted by the healthcare vertical are encryption, tokenization, and masking. Encryption solutions help healthcare professionals secure personal health information on their mobile devices, such as laptops and smartphones. Further, the encryption of data, files, and folders helps healthcare professionals ensure the security and privacy of confidential data, financial transactions, and medical records related to the patient.

Implementing regulatory compliances, such as HIPAA, helps secure sensitive data, protect identities by providing a digital signature, and protect network gateways and databases. With the increasing instances of medical record thefts and awareness of regulatory compliances, the adoption rate of DSaaS solutions is expected to rise in the coming years.

By region, North America to hold largest highest market size during the forecast period
Data Security as a Service Market Size, and Share

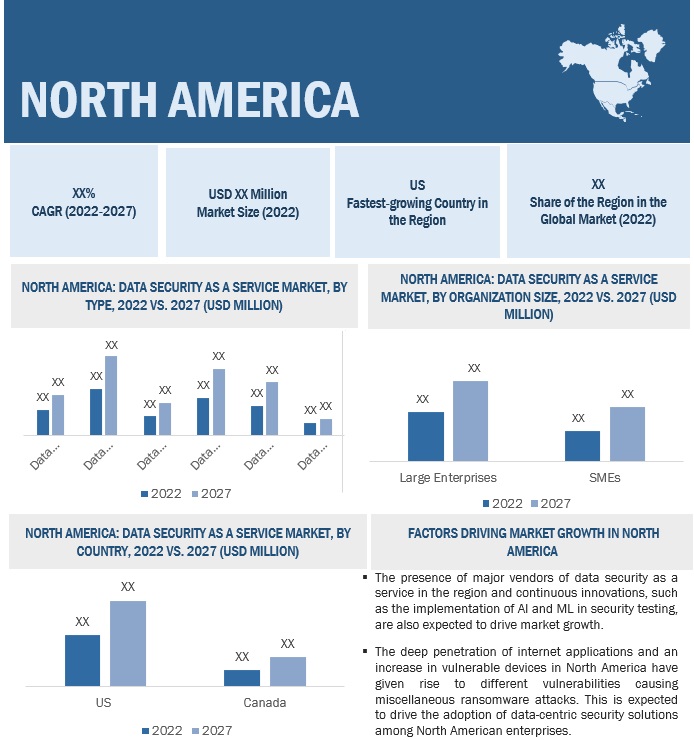
North America is the most affected region regarding data security breaches and, as a result, has the most significant number of DSaaS providers. Hence, the global data security as a service (DSaaS) market is expected to be dominated by North America. It is the most advanced region adopting data protection solutions with relevant infrastructure. Data security is recognized as the most serious economic and national security challenge by regional organizations and governments. The growing concern about the security of critical infrastructure and sensitive data has increased the government's intervention in data security in recent years. Specific budget allocations, support from the government, and mandated data protection policies are expected to make North America the most profitable region for the growth of data protection providers.

Key Market Players

Key players in the global data security as a service (DSaaS) market include Cisco (US), AWS (US), Thales (France), IBM (US), Cognizant (US), Micro Focus (UK), Microsoft (US), Varonis Systems (US), Imperva (US), Commvault (US), HPE (US), Acronis (Switzerland), Veritas Technologies (US), Asigra (Canada), NetApp (US), GuidePoint Security (US), Informatica (US), Carbonite (US), TrustArc(US), Cloudian(US), NetWrix (US), Alation (US), Infrascale (US), Securiti (US), DataGuard (Germany), Cobalt Iron (US), Storagepipe (Canada), Polar Security (Israel), Clarip (US) and SEQRITE (India).

Get online access to the report on the World's First Market Intelligence Cloud

  • Easy to Download Historical Data & Forecast Numbers
  • Company Analysis Dashboard for high growth potential opportunities
  • Research Analyst Access for customization & queries
  • Competitor Analysis with Interactive dashboard
  • Latest News, Updates & Trend analysis
Request Sample

Scope of the Report

Report Metrics

Details

Market value in 2027

USD 55.3 Billion

Market value in 2022

USD 31.0 Billion

Market Growth Rate

12.3% CAGR

Largest Market

North America

Market size available for years

2019–2027

Base year considered

2021

Forecast period

2022–2027

Segments Covered

  • Type, Organization Size, Vertical, and Region

Geographies covered

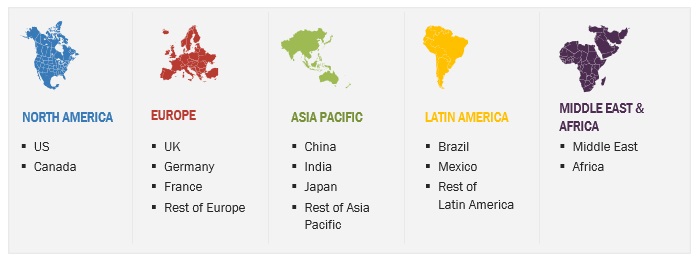
North America, Europe, Asia Pacific, Middle East & Africa, and Latin America

Major companies covered

Cisco (US), AWS (US), Thales (France), IBM (US), Cognizant (US), Micro Focus (UK), Microsoft (US), Varonis Systems (US), Imperva (US), Commvault (US), HPE (US), Acronis (Switzerland), Veritas Technologies (US), Asigra (Canada), and NetApp (US).

Market Segmentation

Data Security as a Service Market Size, and Share

Data Security as a Service Market Size, and Share

Recent Developments

  • In October 2022, Imperva collaborated with Oracle. Oracle Cloud Infrastructure (OCI) is now supported by Imperva's award-winning hybrid data security technology, making migration easier for users and providing automated compliance monitoring of cloud data instances.
  • In July 2022, Oracle and Commvault partnered to provide metallic data management. Critical data assets will be safeguarded in the cloud or on-premises by preserving flexibility between customer-controlled storage or a SaaS-delivered data protection service, including managed cloud storage, using Oracle cloud infrastructure storage for air-gapped ransomware protection.
  • In November 2021, NetApp announced the acquisition of CloudCheckr. It is a cloud optimization platform that provides visibility and insights to lower costs, maintain security and Compliance, and optimize cloud resources.

Frequently Asked Questions (FAQ):

To speak to our analyst for a discussion on the above findings, click Speak to Analyst

TABLE OF CONTENTS
 
1 INTRODUCTION (Page No. - 28)
    1.1 STUDY OBJECTIVES 
    1.2 MARKET DEFINITION 
           1.2.1 INCLUSIONS AND EXCLUSIONS
    1.3 MARKET SCOPE 
           1.3.1 MARKET SEGMENTATION
           1.3.2 REGIONS COVERED
    1.4 YEARS CONSIDERED 
    1.5 CURRENCY CONSIDERED 
           TABLE 1 USD EXCHANGE RATES, 2018–2022
    1.6 STAKEHOLDERS 
 
2 RESEARCH METHODOLOGY (Page No. - 33)
    2.1 RESEARCH DATA 
           FIGURE 1 DATA SECURITY AS A SERVICE MARKET: RESEARCH DESIGN
           2.1.1 SECONDARY DATA
           2.1.2 PRIMARY DATA
                    2.1.2.1 Breakup of primary profiles
                    2.1.2.2 Key industry insights
    2.2 DATA TRIANGULATION 
           FIGURE 2 MARKET: RESEARCH FLOW
    2.3 MARKET SIZE ESTIMATION 
           2.3.1 REVENUE ESTIMATES
                    FIGURE 3 MARKET SIZE ESTIMATION METHODOLOGY—APPROACH 1, SUPPLY-SIDE ANALYSIS: REVENUE OF SOLUTIONS AS A SERVICE IN DATA SECURITY AS A SERVICE MARKET
                    FIGURE 4 MARKET SIZE ESTIMATION METHODOLOGY—APPROACH 1, SUPPLY-SIDE ANALYSIS
                    FIGURE 5 MARKET SIZE ESTIMATION METHODOLOGY—APPROACH 2, BOTTOM-UP (SUPPLY SIDE): COLLECTIVE REVENUE FROM ALL SOLUTIONS AS A SERVICE IN MARKET
           2.3.2 DEMAND-SIDE ANALYSIS
                    FIGURE 6 MARKET SIZE ESTIMATION METHODOLOGY—APPROACH 3, BOTTOM-UP (DEMAND SIDE)
    2.4 COMPANY EVALUATION QUADRANT METHODOLOGY 
           FIGURE 7 COMPANY EVALUATION QUADRANT: CRITERIA WEIGHTAGE
    2.5 STARTUP EVALUATION QUADRANT METHODOLOGY 
           FIGURE 8 STARTUP EVALUATION QUADRANT: CRITERIA WEIGHTAGE
    2.6 MARKET FORECAST 
           TABLE 2 FACTOR ANALYSIS
    2.7 STUDY ASSUMPTIONS 
    2.8 STUDY LIMITATIONS 
 
3 EXECUTIVE SUMMARY (Page No. - 47)
    TABLE 3 DATA SECURITY AS A SERVICE MARKET SIZE AND GROWTH RATE, 2022–2027 
    FIGURE 9 GLOBAL MARKET SIZE AND Y-O-Y GROWTH RATE, 2016–2027 
    FIGURE 10 NORTH AMERICA TO ACCOUNT FOR LARGEST MARKET SHARE IN 2022 
 
4 PREMIUM INSIGHTS (Page No. - 50)
    4.1 ATTRACTIVE OPPORTUNITIES IN DATA SECURITY AS A SERVICE MARKET 
           FIGURE 11 DATA EVOLUTION AND GROWING SECURITY CONCERNS TO DRIVE MARKET
    4.2 MARKET, BY TYPE, 2022 VS. 2027 (USD MILLION) 
           FIGURE 12 DATA ENCRYPTION AND MASKING AS A SERVICE SEGMENT TO DOMINATE MARKET IN 2022
    4.3 MARKET, BY VERTICAL, 2022 VS. 2027 (USD MILLION) 
           FIGURE 13 BFSI SEGMENT TO DOMINATE MARKET IN 2027
    4.4 MARKET, BY REGION, 2022 VS. 2027 (USD MILLION) 
           FIGURE 14 NORTH AMERICA TO DOMINATE MARKET IN FORECAST PERIOD
    4.5 MARKET INVESTMENT SCENARIO 
           FIGURE 15 ASIA PACIFIC TO EMERGE AS BEST MARKET FOR INVESTMENT IN NEXT FIVE YEARS
 
5 MARKET OVERVIEW AND INDUSTRY TRENDS (Page No. - 54)
    5.1 INTRODUCTION 
    5.2 MARKET DYNAMICS 
           FIGURE 16 DATA SECURITY AS A SERVICE MARKET: DRIVERS, RESTRAINTS, OPPORTUNITIES, AND CHALLENGES
           5.2.1 DRIVERS
                    5.2.1.1 Data evolution and growing security problems
                    5.2.1.2 Strict guidelines to boost use of data security as a service
                    5.2.1.3 Increased issues concerning significant data loss in on-premises environment
           5.2.2 RESTRAINTS
                    5.2.2.1 Traditional and on-premises applications’ compatibility limitations in cloud environment
                    5.2.2.2 Low data security spending and expensive installation
           5.2.3 OPPORTUNITIES
                    5.2.3.1 Increased adoption of cloud technology in enterprises
                    5.2.3.2 Widespread use of data security as a service in highly regulated industry sectors
                    5.2.3.3 Future of data backup and recovery with blockchain technology
           5.2.4 CHALLENGES
                    5.2.4.1 Synchronizing management of unstructured to structured data
                    5.2.4.2 Lack of technical and operational knowledge among workers
    5.3 ECOSYSTEM ANALYSIS 
           FIGURE 17 DATA SECURITY AS A SERVICE MARKET: ECOSYSTEM ANALYSIS
           TABLE 4 MARKET: ROLE IN ECOSYSTEM
    5.4 TECHNOLOGY ANALYSIS 
           5.4.1 AI/ML
           5.4.2 BIG DATA AND ANALYTICS
           5.4.3 IOT
           5.4.4 CLOUD COMPUTING
    5.5 REGULATORY IMPLICATIONS 
           5.5.1 PAYMENT CARD INDUSTRY DATA SECURITY STANDARD (PCI–DSS)
           5.5.2 HEALTH INSURANCE PORTABILITY AND ACCOUNTABILITY ACT (HIPAA)
           5.5.3 FEDERAL INFORMATION SECURITY MANAGEMENT ACT (FISMA)
           5.5.4 GRAMM-LEACH-BLILEY ACT (GLBA)
           5.5.5 SARBANES-OXLEY ACT (SOX)
           5.5.6 INTERNATIONAL ORGANIZATION FOR STANDARDIZATION (ISO) STANDARD 27001
           5.5.7 EUROPEAN UNION GENERAL DATA PROTECTION REGULATION (EU GDPR)
           5.5.8 CALIFORNIA’S PRIVACY RIGHTS ACT (CPRA)
           5.5.9 REGULATORY BODIES, GOVERNMENT AGENCIES, AND OTHER ORGANIZATIONS
                    TABLE 5 REGULATORY BODIES, GOVERNMENT AGENCIES, AND OTHER ORGANIZATIONS
    5.6 PATENT ANALYSIS 
           FIGURE 18 DATA SECURITY AS A SERVICE MARKET: PATENT ANALYSIS
    5.7 VALUE CHAIN ANALYSIS 
           FIGURE 19 MARKET: VALUE CHAIN ANALYSIS
    5.8 PORTER’S FIVE FORCES ANALYSIS 
           FIGURE 20 MARKET: PORTER’S FIVE FORCE ANALYSIS
                    TABLE 6 DATA SECURITY AS A SERVICES MARKET: PORTER’S FIVE FORCES ANALYSIS
           5.8.1 THREAT OF NEW ENTRANTS
           5.8.2 THREAT OF SUBSTITUTES
           5.8.3 BARGAINING POWER OF SUPPLIERS
           5.8.4 BARGAINING POWER OF BUYERS
           5.8.5 INTENSITY OF COMPETITIVE RIVALRY
    5.9 USE CASES 
           5.9.1 USE CASE 1: MICRO FOCUS HELPED SWISSCOM AG TO PROTECT SENSITIVE CUSTOMER DATA IN COMPLEX ENVIRONMENT
           5.9.2 USE CASE 2: IMPERVA HELPED DISCOVERY INC. TO TACKLE DATA COMPLIANCE IN PUBLIC CLOUD
           5.9.3 USE CASE 3: VERITAS HELPED QCON WITH DATA SECURITY FEATURES TO ENSURE DATA SECURITY OF APPLICATIONS
           5.9.4 USE CASE 4: COHESITY HELPED TXT E-SOLUTIONS TO MINIMIZE DOWNTIME ISSUES RESULTING FROM SEVERAL MERGERS AND ACQUISITIONS
    5.10 PRICING ANALYSIS 
    5.11 TRENDS AND DISRUPTIONS IMPACTING CUSTOMERS 
                    FIGURE 21 MARKET: TRENDS AND DISRUPTIONS IMPACTING CUSTOMERS
    5.12 KEY STAKEHOLDERS AND BUYING CRITERIA 
           5.12.1 KEY STAKEHOLDERS IN BUYING PROCESS
                    FIGURE 22 INFLUENCE OF STAKEHOLDERS ON BUYING PROCESS (%)
                    TABLE 7 INFLUENCE OF STAKEHOLDERS ON BUYING PROCESS (%)
    5.13 KEY CONFERENCES AND EVENTS IN 2022–2023 
                    TABLE 8 MARKET: LIST OF CONFERENCES AND EVENTS
 
6 DATA SECURITY AS A SERVICE MARKET, BY TYPE (Page No. - 73)
    6.1 INTRODUCTION 
           6.1.1 TYPE: MARKET DRIVERS
                    FIGURE 23 DATA GOVERNANCE AND COMPLIANCE AS A SERVICE SEGMENT TO REGISTER HIGHEST GROWTH IN FORECAST PERIOD
                    TABLE 9 MARKET, BY TYPE, 2016–2021 (USD MILLION)
                    TABLE 10 MARKET, BY TYPE, 2022–2027 (USD MILLION)
    6.2 DATA BACKUP AND RECOVERY AS A SERVICE 
           6.2.1 MITIGATES RISK OF CYBER DISASTERS
                    TABLE 11 DATA BACKUP AND RECOVERY AS A SERVICE: MARKET, BY REGION, 2016–2021 (USD MILLION)
                    TABLE 12 DATA BACKUP AND RECOVERY AS A SERVICE: MARKET, BY REGION, 2022–2027 (USD MILLION)
    6.3 DATA ENCRYPTION AND MASKING AS A SERVICE 
           6.3.1 SAFEGUARDS ENCRYPTION OF CRITICAL DATA
                    TABLE 13 DATA ENCRYPTION AND MASKING AS A SERVICE: MARKET, BY REGION, 2016–2021 (USD MILLION)
                    TABLE 14 DATA ENCRYPTION AND MASKING AS A SERVICE: MARKET, BY REGION, 2022–2027 (USD MILLION)
    6.4 DATA ACCESS CONTROL AS A SERVICE 
           6.4.1 NEED FOR SECURE DATA ACCESS RESULTED IN WIDESPREAD ADOPTION OF DATA ACCESS CONTROL SERVICES
                    TABLE 15 DATA ACCESS CONTROL AS A SERVICE: DATA SECURITY AS A SERVICE MARKET, BY REGION, 2016–2021 (USD MILLION)
                    TABLE 16 DATA ACCESS CONTROL AS A SERVICE: MARKET, BY REGION, 2022–2027 (USD MILLION)
    6.5 DATA DISCOVERY AND CLASSIFICATION AS A SERVICE 
           6.5.1 RAPID PRODUCTION OF DATA SUPPORTS NEED FOR DSAAS
                    TABLE 17 DATA DISCOVERY AND CLASSIFICATION AS A SERVICE: MARKET, BY REGION, 2016–2021 (USD MILLION)
                    TABLE 18 DATA DISCOVERY AND CLASSIFICATION AS A SERVICE: MARKET, BY REGION, 2022–2027 (USD MILLION)
    6.6 DATA GOVERNANCE AND COMPLIANCE AS A SERVICE 
           6.6.1 NEED FOR STRUCTURED DATA TO PROPEL ADOPTION OF DSAAS
                    TABLE 19 DATA GOVERNANCE AND COMPLIANCE AS A SERVICE: MARKET, BY REGION, 2016–2021 (USD MILLION)
                    TABLE 20 DATA GOVERNANCE AND COMPLIANCE AS A SERVICE: MARKET, BY REGION, 2022–2027 (USD MILLION)
    6.7 DATA AUDITING AND MONITORING AS A SERVICE 
           6.7.1 CROSS-EXAMINATION OF CRITICAL DATA TO DRIVE ADOPTION OF DATA AUDITING AND MONITORING SERVICE
                    TABLE 21 DATA AUDITING AND MONITORING AS A SERVICE: MARKET, BY REGION, 2016–2021 (USD MILLION)
                    TABLE 22 DATA AUDITING AND MONITORING AS A SERVICE: MARKET, BY REGION, 2022–2027 (USD MILLION)
 
7 DATA SECURITY AS A SERVICE MARKET, BY ORGANIZATION SIZE (Page No. - 83)
    7.1 INTRODUCTION 
           7.1.1 ORGANIZATION SIZE: MARKET DRIVERS
                    FIGURE 24 LARGE ENTERPRISES SEGMENT TO DOMINATE MARKET DURING FORECAST PERIOD
                    TABLE 23 MARKET, BY ORGANIZATION SIZE, 2016–2021 (USD MILLION)
                    TABLE 24 MARKET, BY ORGANIZATION SIZE, 2022–2027 (USD MILLION)
    7.2 LARGE ENTERPRISES 
           7.2.1 RISE IN USAGE OF PERSONAL DEVICES TO BOOST ADOPTION OF DATA SECURITY AS A SERVICE
                    TABLE 25 LARGE ENTERPRISES: MARKET, BY REGION, 2016–2021 (USD MILLION)
                    TABLE 26 LARGE ENTERPRISES: MARKET, BY REGION, 2022–2027 (USD MILLION)
    7.3 SMALL AND MEDIUM-SIZED ENTERPRISES 
           7.3.1 INCREASE IN CYBERATTACKS TO DRIVE ADOPTION OF DATA SECURITY AS A SERVICE AMONG SMES
                    TABLE 27 SMALL AND MEDIUM-SIZED ENTERPRISES: MARKET, BY REGION, 2016–2021 (USD MILLION)
                    TABLE 28 SMALL AND MEDIUM-SIZED ENTERPRISES: MARKET, BY REGION, 2022–2027 (USD MILLION)
 
8 DATA SECURITY AS A SERVICE MARKET, BY VERTICAL (Page No. - 88)
    8.1 INTRODUCTION 
           8.1.1 VERTICAL: DATA SECURITY AS A SERVICE MARKET DRIVERS
                    FIGURE 25 BFSI SEGMENT TO DOMINATE MARKET IN 2022
                    TABLE 29 MARKET, BY VERTICAL, 2016–2021 (USD MILLION)
                    TABLE 30 MARKET, BY VERTICAL, 2022–2027 (USD MILLION)
    8.2 BANKING, FINANCIAL SERVICES, AND INSURANCE 
           8.2.1 TECHNOLOGICAL ADVANCEMENTS TO SUPPORT MARKET GROWTH
                    TABLE 31 BFSI: MARKET, BY REGION, 2016–2021 (USD MILLION)
                    TABLE 32 BFSI: MARKET, BY REGION, 2022–2027 (USD MILLION)
    8.3 HEALTHCARE 
           8.3.1 INCREASING INSTANCES OF MEDICAL RECORD THEFTS TO DRIVE ADOPTION OF DATA SECURITY AS A SERVICE
                    TABLE 33 HEALTHCARE: DATA SECURITY AS A SERVICE MARKET, BY REGION, 2016–2021 (USD MILLION)
                    TABLE 34 HEALTHCARE: MARKET, BY REGION, 2022–2027 (USD MILLION)
    8.4 MANUFACTURING 
           8.4.1 AUTOMATION OF MANUFACTURING PROCESSES TO PROPEL ADOPTION OF DATA SECURITY AS A SERVICE
                    TABLE 35 MANUFACTURING: MARKET, BY REGION, 2016–2021 (USD MILLION)
                    TABLE 36 MANUFACTURING: MARKET, BY REGION, 2022–2027 (USD MILLION)
    8.5 RETAIL AND ECOMMERCE 
           8.5.1 ADVANCEMENTS IN MOBILE TECHNOLOGY TO BOOST ADOPTION OF DATA SECURITY AS A SERVICE
                    TABLE 37 RETAIL AND ECOMMERCE: MARKET, BY REGION, 2016–2021 (USD MILLION)
                    TABLE 38 RETAIL AND ECOMMERCE: MARKET, BY REGION, 2022–2027 (USD MILLION)
    8.6 EDUCATION 
           8.6.1 EDUCATIONAL INSTITUTES VULNERABLE TO EXPLOITATION BY CYBERCRIMINALS
                    TABLE 39 EDUCATION: MARKET, BY REGION, 2016–2021 (USD MILLION)
                    TABLE 40 EDUCATION: MARKET, BY REGION, 2022–2027 (USD MILLION)
    8.7 MEDIA AND ENTERTAINMENT 
           8.7.1 INTRODUCTION OF STORAGE SOLUTIONS TO BOOST ADOPTION OF DATA SECURITY AS A SERVICE
                    TABLE 41 MEDIA AND ENTERTAINMENT: DATA SECURITY AS A SERVICE MARKET, BY REGION, 2016–2021 (USD MILLION)
                    TABLE 42 MEDIA AND ENTERTAINMENT: MARKET, BY REGION, 2022–2027 (USD MILLION)
    8.8 TELECOMMUNICATIONS 
           8.8.1 DEVELOPMENT OF INNOVATIVE TECHNOLOGIES TO DRIVE MARKET
                    TABLE 43 TELECOMMUNICATIONS: MARKET, BY REGION, 2016–2021 (USD MILLION)
                    TABLE 44 TELECOMMUNICATIONS: MARKET, BY REGION, 2022–2027 (USD MILLION)
    8.9 IT AND ITES 
           8.9.1 DATA SECURITY AS A SERVICE TO SAFEGUARD ORGANIZATIONS’ DATABASES, ENSURING NO IMPACT ON REMOTE OPERATIONS
                    TABLE 45 IT AND ITES: MARKET, BY REGION, 2016–2021 (USD MILLION)
                    TABLE 46 IT AND ITES: MARKET, BY REGION, 2022–2027 (USD MILLION)
    8.10 OTHER VERTICALS 
           TABLE 47 OTHER VERTICALS: MARKET, BY REGION, 2016–2021 (USD MILLION)
           TABLE 48 OTHER VERTICALS: MARKET, BY REGION, 2022–2027 (USD MILLION)
 
9 DATA SECURITY AS A SERVICE MARKET, BY REGION (Page No. - 101)
    9.1 INTRODUCTION 
           FIGURE 26 ASIA PACIFIC TO WITNESS HIGHEST GROWTH DURING FORECAST PERIOD
           TABLE 49 MARKET, BY REGION, 2016–2021 (USD MILLION)
           TABLE 50 MARKET, BY REGION, 2022–2027 (USD MILLION)
    9.2 NORTH AMERICA 
           9.2.1 NORTH AMERICA: MARKET DRIVERS
           9.2.2 NORTH AMERICA: REGULATORY LANDSCAPE
                    FIGURE 27 NORTH AMERICA: DATA SECURITY AS A SERVICE MARKET SNAPSHOT
                    TABLE 51 NORTH AMERICA: MARKET, BY TYPE, 2016–2021 (USD MILLION)
                    TABLE 52 NORTH AMERICA: MARKET, BY TYPE, 2022–2027 (USD MILLION)
                    TABLE 53 NORTH AMERICA: MARKET, BY ORGANIZATION SIZE, 2016–2021 (USD MILLION)
                    TABLE 54 NORTH AMERICA: MARKET, BY ORGANIZATION SIZE, 2022–2027 (USD MILLION)
                    TABLE 55 NORTH AMERICA: MARKET, BY VERTICAL, 2016–2021 (USD MILLION)
                    TABLE 56 NORTH AMERICA: MARKET, BY VERTICAL, 2022–2027 (USD MILLION)
                    TABLE 57 NORTH AMERICA: MARKET, BY COUNTRY, 2016–2021 (USD MILLION)
                    TABLE 58 NORTH AMERICA: MARKET, BY COUNTRY, 2022–2027 (USD MILLION)
           9.2.3 UNITED STATES
                    9.2.3.1 Technological and infrastructural advancements to drive adoption of data security as a service
                               TABLE 59 US: DATA SECURITY AS A SERVICE MARKET, BY TYPE, 2016–2021 (USD MILLION)
                               TABLE 60 US: MARKET, BY TYPE, 2022–2027 (USD MILLION)
                               TABLE 61 US: MARKET, BY ORGANIZATION SIZE, 2016–2021 (USD MILLION)
                               TABLE 62 US: MARKET, BY ORGANIZATION SIZE, 2022–2027 (USD MILLION)
                               TABLE 63 US: MARKET, BY VERTICAL, 2016–2021 (USD MILLION)
                               TABLE 64 US: MARKET, BY VERTICAL, 2022–2027 (USD MILLION)
           9.2.4 CANADA
                    9.2.4.1 Technological advancements and government initiatives to support market growth
                               TABLE 65 CANADA: MARKET, BY TYPE, 2016–2021 (USD MILLION)
                               TABLE 66 CANADA: MARKET, BY TYPE, 2022–2027 (USD MILLION)
                               TABLE 67 CANADA: MARKET, BY ORGANIZATION SIZE, 2016–2021 (USD MILLION)
                               TABLE 68 CANADA: MARKET, BY ORGANIZATION SIZE, 2022–2027 (USD MILLION)
                               TABLE 69 CANADA: MARKET, BY VERTICAL, 2016–2021 (USD MILLION)
                               TABLE 70 CANADA: MARKET, BY VERTICAL, 2022–2027 (USD MILLION)
    9.3 EUROPE 
           9.3.1 EUROPE: MARKET DRIVERS
           9.3.2 EUROPE: REGULATORY LANDSCAPE
                    TABLE 71 EUROPE: DATA SECURITY AS A SERVICE MARKET, BY TYPE, 2016–2021 (USD MILLION)
                    TABLE 72 EUROPE: MARKET, BY TYPE, 2022–2027 (USD MILLION)
                    TABLE 73 EUROPE: MARKET, BY ORGANIZATION SIZE, 2016–2021 (USD MILLION)
                    TABLE 74 EUROPE: MARKET, BY ORGANIZATION SIZE, 2022–2027 (USD MILLION)
                    TABLE 75 EUROPE: MARKET, BY VERTICAL, 2016–2021 (USD MILLION)
                    TABLE 76 EUROPE: MARKET, BY VERTICAL, 2022–2027 (USD MILLION)
                    TABLE 77 EUROPE: MARKET, BY COUNTRY, 2016–2021 (USD MILLION)
                    TABLE 78 EUROPE: MARKET, BY COUNTRY, 2022–2027 (USD MILLION)
           9.3.3 UNITED KINGDOM
                    9.3.3.1 Highly targeted country in terms of data and identity breaches
                               TABLE 79 UNITED KINGDOM: DATA SECURITY AS A SERVICE MARKET, BY TYPE, 2016–2021 (USD MILLION)
                               TABLE 80 UNITED KINGDOM: MARKET, BY TYPE, 2022–2027 (USD MILLION)
                               TABLE 81 UNITED KINGDOM: MARKET, BY ORGANIZATION SIZE, 2016–2021 (USD MILLION)
                               TABLE 82 UNITED KINGDOM: MARKET, BY ORGANIZATION SIZE, 2022–2027 (USD MILLION)
                               TABLE 83 UNITED KINGDOM: MARKET, BY VERTICAL, 2016–2021 (USD MILLION)
                               TABLE 84 UNITED KINGDOM: MARKET, BY VERTICAL, 2022–2027 (USD MILLION)
           9.3.4 GERMANY
                    9.3.4.1 Increased investments in data security landscape to propel adoption of services
                               TABLE 85 GERMANY: MARKET, BY TYPE, 2016–2021 (USD MILLION)
                               TABLE 86 GERMANY: MARKET, BY TYPE, 2022–2027 (USD MILLION)
                               TABLE 87 GERMANY: MARKET, BY ORGANIZATION SIZE, 2016–2021 (USD MILLION)
                               TABLE 88 GERMANY: MARKET, BY ORGANIZATION SIZE, 2022–2027 (USD MILLION)
                               TABLE 89 GERMANY: MARKET, BY VERTICAL, 2016–2021 (USD MILLION)
                               TABLE 90 GERMANY: MARKET, BY VERTICAL, 2022–2027 (USD MILLION)
           9.3.5 FRANCE
                    9.3.5.1 Government initiatives to strengthen adoption of data security as a service
                               TABLE 91 FRANCE: DATA SECURITY AS A SERVICE MARKET, BY TYPE, 2016–2021 (USD MILLION)
                               TABLE 92 FRANCE: MARKET, BY TYPE, 2022–2027 (USD MILLION)
                               TABLE 93 FRANCE: MARKET, BY ORGANIZATION SIZE, 2016–2021 (USD MILLION)
                               TABLE 94 FRANCE: MARKET, BY ORGANIZATION SIZE, 2022–2027 (USD MILLION)
                               TABLE 95 FRANCE: MARKET, BY VERTICAL, 2016–2021 (USD MILLION)
                               TABLE 96 FRANCE: MARKET, BY VERTICAL, 2022–2027 (USD MILLION)
           9.3.6 REST OF EUROPE
                    TABLE 97 REST OF EUROPE: MARKET, BY TYPE, 2016–2021 (USD MILLION)
                    TABLE 98 REST OF EUROPE: MARKET, BY TYPE, 2022–2027 (USD MILLION)
                    TABLE 99 REST OF EUROPE: MARKET, BY ORGANIZATION SIZE, 2016–2021 (USD MILLION)
                    TABLE 100 REST OF EUROPE: MARKET, BY ORGANIZATION SIZE, 2022–2027 (USD MILLION)
                    TABLE 101 REST OF EUROPE: MARKET, BY VERTICAL, 2016–2021 (USD MILLION)
                    TABLE 102 REST OF EUROPE: MARKET, BY VERTICAL, 2022–2027 (USD MILLION)
    9.4 ASIA PACIFIC 
           9.4.1 ASIA PACIFIC: MARKET DRIVERS
           9.4.2 ASIA PACIFIC: REGULATORY LANDSCAPE
                    FIGURE 28 ASIA PACIFIC: DATA SECURITY AS A SERVICE MARKET SNAPSHOT
                    TABLE 103 ASIA PACIFIC: MARKET, BY TYPE, 2016–2021 (USD MILLION)
                    TABLE 104 ASIA PACIFIC: MARKET, BY TYPE, 2022–2027 (USD MILLION)
                    TABLE 105 ASIA PACIFIC: MARKET, BY ORGANIZATION SIZE, 2016–2021 (USD MILLION)
                    TABLE 106 ASIA PACIFIC: MARKET, BY ORGANIZATION SIZE, 2022–2027 (USD MILLION)
                    TABLE 107 ASIA PACIFIC: MARKET, BY VERTICAL, 2016–2021 (USD MILLION)
                    TABLE 108 ASIA PACIFIC: MARKET, BY VERTICAL, 2022–2027 (USD MILLION)
                    TABLE 109 ASIA PACIFIC: MARKET, BY COUNTRY, 2016–2021 (USD MILLION)
                    TABLE 110 ASIA PACIFIC: MARKET, BY COUNTRY, 2022–2027 (USD MILLION)
           9.4.3 CHINA
                    9.4.3.1 Intensive usage of Internet strengthens market for data security as a service
                               TABLE 111 CHINA: DATA SECURITY AS A SERVICE MARKET, BY TYPE, 2016–2021 (USD MILLION)
                               TABLE 112 CHINA: MARKET, BY TYPE, 2022–2027 (USD MILLION)
                               TABLE 113 CHINA: MARKET, BY ORGANIZATION SIZE, 2016–2021 (USD MILLION)
                               TABLE 114 CHINA: MARKET, BY ORGANIZATION SIZE, 2022–2027 (USD MILLION)
                               TABLE 115 CHINA: MARKET, BY VERTICAL, 2016–2021 (USD MILLION)
                               TABLE 116 CHINA: MARKET, BY VERTICAL, 2022–2027 (USD MILLION)
           9.4.4 JAPAN
                    9.4.4.1 Rise in adoption of cloud-based data security as a service to propel market
                               TABLE 117 JAPAN: MARKET, BY TYPE, 2016–2021 (USD MILLION)
                               TABLE 118 JAPAN: MARKET, BY TYPE, 2022–2027 (USD MILLION)
                               TABLE 119 JAPAN: MARKET, BY ORGANIZATION SIZE, 2016–2021 (USD MILLION)
                               TABLE 120 JAPAN: MARKET, BY ORGANIZATION SIZE, 2022–2027 (USD MILLION)
                               TABLE 121 JAPAN: MARKET, BY VERTICAL, 2016–2021 (USD MILLION)
                               TABLE 122 JAPAN: MARKET, BY VERTICAL, 2022–2027 (USD MILLION)
           9.4.5 INDIA
                    9.4.5.1 Rising adoption of DSaaS for securing confidential information
                               TABLE 123 INDIA: DATA SECURITY AS A SERVICE MARKET, BY TYPE, 2016–2021 (USD MILLION)
                               TABLE 124 INDIA: MARKET, BY TYPE, 2022–2027 (USD MILLION)
                               TABLE 125 INDIA: MARKET, BY ORGANIZATION SIZE, 2016–2021 (USD MILLION)
                               TABLE 126 INDIA: MARKET, BY ORGANIZATION SIZE, 2022–2027 (USD MILLION)
                               TABLE 127 INDIA: MARKET, BY VERTICAL, 2016–2021 (USD MILLION)
                               TABLE 128 INDIA: MARKET, BY VERTICAL, 2022–2027 (USD MILLION)
           9.4.6 REST OF ASIA PACIFIC
                    TABLE 129 REST OF ASIA PACIFIC: MARKET, BY TYPE, 2016–2021 (USD MILLION)
                    TABLE 130 REST OF ASIA PACIFIC: MARKET, BY TYPE, 2022–2027 (USD MILLION)
                    TABLE 131 REST OF ASIA PACIFIC: MARKET, BY ORGANIZATION SIZE, 2016–2021 (USD MILLION)
                    TABLE 132 REST OF ASIA PACIFIC: MARKET, BY ORGANIZATION SIZE, 2022–2027 (USD MILLION)
                    TABLE 133 REST OF ASIA PACIFIC: MARKET, BY VERTICAL, 2016–2021 (USD MILLION)
                    TABLE 134 REST OF ASIA PACIFIC: MARKET, BY VERTICAL, 2022–2027 (USD MILLION)
    9.5 MIDDLE EAST & AFRICA 
           9.5.1 MIDDLE EAST & AFRICA: MARKET DRIVERS
           9.5.2 MIDDLE EAST & AFRICA: REGULATORY LANDSCAPE
                    TABLE 135 MIDDLE EAST & AFRICA: DATA SECURITY AS A SERVICE MARKET, BY TYPE, 2016–2021 (USD MILLION)
                    TABLE 136 MIDDLE EAST & AFRICA: MARKET, BY TYPE, 2022–2027 (USD MILLION)
                    TABLE 137 MIDDLE EAST & AFRICA: MARKET, BY ORGANIZATION SIZE, 2016–2021 (USD MILLION)
                    TABLE 138 MIDDLE EAST & AFRICA: MARKET, BY ORGANIZATION SIZE, 2022–2027 (USD MILLION)
                    TABLE 139 MIDDLE EAST & AFRICA: MARKET, BY VERTICAL, 2016–2021 (USD MILLION)
                    TABLE 140 MIDDLE EAST & AFRICA: MARKET, BY VERTICAL, 2022–2027 (USD MILLION)
                    TABLE 141 MIDDLE EAST & AFRICA: MARKET, BY REGION, 2016–2021 (USD MILLION)
                    TABLE 142 MIDDLE EAST & AFRICA: MARKET, BY REGION, 2022–2027 (USD MILLION)
           9.5.3 MIDDLE EAST
                    9.5.3.1 Digitalization boosting DSaaS adoption by businesses
                               TABLE 143 MIDDLE EAST: DATA SECURITY AS A SERVICE MARKET, BY TYPE, 2016–2021 (USD MILLION)
                               TABLE 144 MIDDLE EAST: MARKET, BY TYPE, 2022–2027 (USD MILLION)
                               TABLE 145 MIDDLE EAST: MARKET, BY ORGANIZATION SIZE, 2016–2021 (USD MILLION)
                               TABLE 146 MIDDLE EAST: MARKET, BY ORGANIZATION SIZE, 2022–2027 (USD MILLION)
                               TABLE 147 MIDDLE EAST: MARKET, BY VERTICAL, 2016–2021 (USD MILLION)
                               TABLE 148 MIDDLE EAST: MARKET, BY VERTICAL, 2022–2027 (USD MILLION)
           9.5.4 AFRICA
                    9.5.4.1 Internet penetration to boost adoption of DSaaS
                               TABLE 149 AFRICA: MARKET, BY TYPE, 2016–2021 (USD MILLION)
                               TABLE 150 AFRICA: MARKET, BY TYPE, 2022–2027 (USD MILLION)
                               TABLE 151 AFRICA: MARKET, BY ORGANIZATION SIZE, 2016–2021 (USD MILLION)
                               TABLE 152 AFRICA: MARKET, BY ORGANIZATION SIZE, 2022–2027 (USD MILLION)
                               TABLE 153 AFRICA: MARKET, BY VERTICAL, 2016–2021 (USD MILLION)
                               TABLE 154 AFRICA: MARKET, BY VERTICAL, 2022–2027 (USD MILLION)
    9.6 LATIN AMERICA 
           9.6.1 LATIN AMERICA: MARKET DRIVERS
           9.6.2 LATIN AMERICA: REGULATORY LANDSCAPE
                    TABLE 155 LATIN AMERICA: DATA SECURITY AS A SERVICE MARKET, BY TYPE, 2016–2021 (USD MILLION)
                    TABLE 156 LATIN AMERICA: MARKET, BY TYPE, 2022–2027 (USD MILLION)
                    TABLE 157 LATIN AMERICA: MARKET, BY ORGANIZATION SIZE, 2016–2021 (USD MILLION)
                    TABLE 158 LATIN AMERICA: MARKET, BY ORGANIZATION SIZE, 2022–2027 (USD MILLION)
                    TABLE 159 LATIN AMERICA: MARKET, BY VERTICAL, 2016–2021 (USD MILLION)
                    TABLE 160 LATIN AMERICA: MARKET, BY VERTICAL, 2022–2027 (USD MILLION)
                    TABLE 161 LATIN AMERICA: MARKET, BY COUNTRY, 2016–2021 (USD MILLION)
                    TABLE 162 LATIN AMERICA: MARKET, BY COUNTRY, 2022–2027 (USD MILLION)
           9.6.3 BRAZIL
                    9.6.3.1 Adoption of DSaaS to revolutionize fight against cybercrimes
                               TABLE 163 BRAZIL: DATA SECURITY AS A SERVICE MARKET, BY TYPE, 2016–2021 (USD MILLION)
                               TABLE 164 BRAZIL: MARKET, BY TYPE, 2022–2027 (USD MILLION)
                               TABLE 165 BRAZIL: MARKET, BY ORGANIZATION SIZE, 2016–2021 (USD MILLION)
                               TABLE 166 BRAZIL: MARKET, BY ORGANIZATION SIZE, 2022–2027 (USD MILLION)
                               TABLE 167 BRAZIL: MARKET, BY VERTICAL, 2016–2021 (USD MILLION)
                               TABLE 168 BRAZIL: MARKET, BY VERTICAL, 2022–2027 (USD MILLION)
           9.6.4 MEXICO
                    9.6.4.1 Rising incidence of cybercrimes to propel adoption of DSaaS
                               TABLE 169 MEXICO: MARKET, BY TYPE, 2016–2021 (USD MILLION)
                               TABLE 170 MEXICO: MARKET, BY TYPE, 2022–2027 (USD MILLION)
                               TABLE 171 MEXICO: MARKET, BY ORGANIZATION SIZE, 2016–2021 (USD MILLION)
                               TABLE 172 MEXICO: MARKET, BY ORGANIZATION SIZE, 2022–2027 (USD MILLION)
                               TABLE 173 MEXICO: MARKET, BY VERTICAL, 2016–2021 (USD MILLION)
                               TABLE 174 MEXICO: MARKET, BY VERTICAL, 2022–2027 (USD MILLION)
           9.6.5 REST OF LATIN AMERICA
                    TABLE 175 REST OF LATIN AMERICA: DATA SECURITY AS A SERVICE MARKET, BY TYPE, 2016–2021 (USD MILLION)
                    TABLE 176 REST OF LATIN AMERICA: MARKET, BY TYPE, 2022–2027 (USD MILLION)
                    TABLE 177 REST OF LATIN AMERICA: MARKET, BY ORGANIZATION SIZE, 2016–2021 (USD MILLION)
                    TABLE 178 REST OF LATIN AMERICA: MARKET, BY ORGANIZATION SIZE, 2022–2027 (USD MILLION)
                    TABLE 179 REST OF LATIN AMERICA: MARKET, BY VERTICAL, 2016–2021 (USD MILLION)
                    TABLE 180 REST OF LATIN AMERICA: MARKET, BY VERTICAL, 2022–2027 (USD MILLION)
 
10 COMPETITIVE LANDSCAPE (Page No. - 171)
     10.1 OVERVIEW 
     10.2 MARKET EVALUATION FRAMEWORK 
               FIGURE 29 DATA SECURITY AS A SERVICE: MARKET EVALUATION FRAMEWORK
     10.3 REVENUE ANALYSIS OF LEADING PLAYERS 
               FIGURE 30 MARKET: REVENUE ANALYSIS
     10.4 MARKET SHARE ANALYSIS OF TOP MARKET PLAYERS 
               TABLE 181 MARKET: DEGREE OF COMPETITION
     10.5 HISTORICAL REVENUE ANALYSIS 
               FIGURE 31 HISTORICAL THREE-YEAR REVENUE ANALYSIS OF KEY PUBLIC SECTOR DATA SECURITY AS A SERVICE PROVIDERS
     10.6 RANKING OF KEY PLAYERS IN MARKET 
               FIGURE 32 RANKING OF KEY PLAYERS
     10.7 COMPANY EVALUATION QUADRANT OF KEY COMPANIES 
               FIGURE 33 DATA SECURITY AS A SERVICE MARKET: COMPANY EVALUATION QUADRANT OF KEY PLAYERS, 2022
             10.7.1 STARS
             10.7.2 EMERGING LEADERS
             10.7.3 PERVASIVE PLAYERS
             10.7.4 PARTICIPANTS
     10.8 COMPETITIVE BENCHMARKING 
             10.8.1 EVALUATION CRITERIA OF KEY COMPANIES
                       TABLE 182 REGIONAL FOOTPRINT OF KEY COMPANIES
             10.8.2 EVALUATION CRITERIA OF SMES/STARTUP COMPANIES
                       TABLE 183 LIST OF STARTUPS/SMES
                       TABLE 184 REGIONAL FOOTPRINT OF SMES/STARTUP COMPANIES
     10.9 COMPANY EVALUATION QUADRANT OF SMES/STARTUPS 
             10.9.1 PROGRESSIVE COMPANIES
             10.9.2 RESPONSIVE COMPANIES
             10.9.3 DYNAMIC COMPANIES
             10.9.4 STARTING BLOCKS
                       FIGURE 34 MARKET: COMPANY EVALUATION QUADRANT OF SMES/STARTUPS, 2022
     10.10 COMPETITIVE SCENARIO AND TRENDS 
               10.10.1 PRODUCT LAUNCHES AND ENHANCEMENTS
                       TABLE 185 MARKET: PRODUCT LAUNCHES AND ENHANCEMENTS, 2020–2022
               10.10.2 DEALS
                       TABLE 186 DATA SECURITY AS A SERVICE MARKET: DEALS, 2020–2022
 
11 COMPANY PROFILES (Page No. - 185)
(Business overview, Products/Solutions/Services offered, Recent developments & MnM View)*
     11.1 KEY PLAYERS 
             11.1.1 CISCO
                       TABLE 187 CISCO: BUSINESS OVERVIEW
                       TABLE 188 CISCO: PRODUCTS/SOLUTIONS/SERVICES OFFERED
                       FIGURE 35 CISCO: COMPANY SNAPSHOT
                       TABLE 189 CISCO: PRODUCT LAUNCHES
                       TABLE 190 CISCO: DEALS
             11.1.2 AWS
                       TABLE 191 AWS: BUSINESS OVERVIEW
                       FIGURE 36 AWS: COMPANY SNAPSHOT
                       TABLE 192 AWS: PRODUCTS/SOLUTIONS/SERVICES OFFERED
                       TABLE 193 AWS: PRODUCT LAUNCHES
                       TABLE 194 AWS: DEALS
             11.1.3 THALES
                       TABLE 195 THALES: BUSINESS OVERVIEW
                       FIGURE 37 THALES: COMPANY SNAPSHOT
                       TABLE 196 THALES: PRODUCTS/SOLUTIONS/SERVICES OFFERED
                       TABLE 197 THALES: PRODUCT LAUNCHES
                       TABLE 198 THALES: DEALS
             11.1.4 IBM
                       TABLE 199 IBM: BUSINESS OVERVIEW
                       FIGURE 38 IBM: COMPANY SNAPSHOT
                       TABLE 200 IBM: PRODUCTS/SOLUTIONS/SERVICES OFFERED
                       TABLE 201 IBM: PRODUCT LAUNCHES
                       TABLE 202 IBM: DEALS
             11.1.5 COGNIZANT
                       TABLE 203 COGNIZANT: BUSINESS OVERVIEW
                       FIGURE 39 COGNIZANT: COMPANY SNAPSHOT
                       TABLE 204 COGNIZANT: PRODUCTS/SOLUTIONS/SERVICES OFFERED
                       TABLE 205 COGNIZANT: DEALS
             11.1.6 MICRO FOCUS
                       TABLE 206 MICRO FOCUS: BUSINESS OVERVIEW
                       FIGURE 40 MICRO FOCUS: COMPANY SNAPSHOT
                       TABLE 207 MICRO FOCUS: PRODUCTS/SOLUTIONS/SERVICES OFFERED
                       TABLE 208 MICRO FOCUS: DEALS
             11.1.7 MICROSOFT
                       TABLE 209 MICROSOFT: BUSINESS OVERVIEW
                       FIGURE 41 MICROSOFT: COMPANY SNAPSHOT
                       TABLE 210 MICROSOFT: PRODUCTS/SOLUTIONS/SERVICES OFFERED
                       TABLE 211 MICROSOFT: PRODUCT LAUNCHES
                       TABLE 212 MICROSOFT: DEALS
             11.1.8 VARONIS SYSTEMS
                       TABLE 213 VARONIS SYSTEMS: BUSINESS OVERVIEW
                       FIGURE 42 VARONIS SYSTEMS: COMPANY SNAPSHOT
                       TABLE 214 VARONIS SYSTEMS: PRODUCTS/SOLUTIONS/SERVICES OFFERED
                       TABLE 215 VARONIS SYSTEMS: PRODUCT LAUNCHES
                       TABLE 216 VARONIS SYSTEMS: DEALS
             11.1.9 IMPERVA
                       TABLE 217 IMPERVA: BUSINESS OVERVIEW
                       TABLE 218 IMPERVA: PRODUCTS/SOLUTIONS/SERVICES OFFERED
                       TABLE 219 IMPERVA: PRODUCT LAUNCHES
                       TABLE 220 IMPERVA: DEALS
             11.1.10 COMMVAULT
                       TABLE 221 COMMVAULT: BUSINESS OVERVIEW
                       FIGURE 43 COMMVAULT: COMPANY SNAPSHOT
                       TABLE 222 COMMVAULT: PRODUCTS/SOLUTIONS/SERVICES OFFERED
                       TABLE 223 COMMVAULT: PRODUCT LAUNCHES
                       TABLE 224 COMMVAULT: DEALS
             11.1.11 HPE
                       TABLE 225 HPE: BUSINESS OVERVIEW
                       FIGURE 44 HPE: COMPANY SNAPSHOT
                       TABLE 226 HPE: PRODUCTS/SOLUTIONS/SERVICES OFFERED
                       TABLE 227 HPE: PRODUCT LAUNCHES
                       TABLE 228 HPE: DEALS
             11.1.12 ACRONIS
                       TABLE 229 ACRONIS: BUSINESS OVERVIEW
                       TABLE 230 ACRONIS: PRODUCTS/SOLUTIONS/SERVICES OFFERED
                       TABLE 231 ACRONIS: PRODUCT LAUNCHES
                       TABLE 232 ACRONIS: DEALS
             11.1.13 VERITAS TECHNOLOGIES
                       TABLE 233 VERITAS TECHNOLOGIES: BUSINESS OVERVIEW
                       TABLE 234 VERITAS TECHNOLOGIES: PRODUCTS/SOLUTIONS/SERVICES OFFERED
                       TABLE 235 VERITAS TECHNOLOGIES: PRODUCT LAUNCHES
                       TABLE 236 VERITAS TECHNOLOGIES: DEALS
             11.1.14 ASIGRA
                       TABLE 237 ASIGRA: BUSINESS OVERVIEW
                       TABLE 238 ASIGRA: PRODUCTS/SOLUTIONS/SERVICES OFFERED
                       TABLE 239 ASIGRA: PRODUCT LAUNCHES
             11.1.15 NETAPP
                       TABLE 240 NETAPP: BUSINESS OVERVIEW
                       FIGURE 45 NETAPP: COMPANY SNAPSHOT
                       TABLE 241 NETAPP: PRODUCTS/SOLUTIONS/SERVICES OFFERED
                       TABLE 242 NETAPP: PRODUCT LAUNCHES
                       TABLE 243 NETAPP: DEALS
*Details on Business overview, Products/Solutions/Services offered, Recent developments & MnM View might not be captured in case of unlisted companies.
     11.2 OTHER PLAYERS 
             11.2.1 GUIDEPOINT SECURITY
             11.2.2 INFORMATICA
             11.2.3 CARBONITE
             11.2.4 TRUSTARC
             11.2.5 CLOUDIAN
             11.2.6 NETWRIX
             11.2.7 ALATION
             11.2.8 INFRASCALE
             11.2.9 SECURITI
             11.2.10 DATAGUARD
             11.2.11 COBALT IRON
             11.2.12 STORAGEPIPE
             11.2.13 POLAR SECURITY
             11.2.14 CLARIP
             11.2.15 SEQRITE
 
12 ADJACENT MARKETS (Page No. - 240)
     TABLE 244 ADJACENT MARKETS AND FORECASTS 
     12.1 LIMITATIONS 
             12.1.1 DATA-CENTRIC SECURITY MARKET
                       TABLE 245 DATA-CENTRIC SECURITY MARKET, BY COMPONENT, 2016–2021 (USD MILLION)
                       TABLE 246 DATA-CENTRIC SECURITY MARKET, BY COMPONENT, 2022–2027 (USD MILLION)
                       TABLE 247 DATA-CENTRIC SECURITY MARKET, BY DEPLOYMENT MODE, 2016–2021 (USD MILLION)
                       TABLE 248 DATA-CENTRIC SECURITY MARKET, BY DEPLOYMENT MODE, 2022–2027 (USD MILLION)
                       TABLE 249 DATA-CENTRIC SECURITY MARKET, BY ORGANIZATION SIZE, 2016–2021 (USD MILLION)
                       TABLE 250 DATA-CENTRIC SECURITY MARKET, BY ORGANIZATION SIZE, 2022–2027 (USD MILLION)
                       TABLE 251 DATA-CENTRIC SECURITY MARKET, BY VERTICAL, 2016–2021 (USD MILLION)
                       TABLE 252 DATA-CENTRIC SECURITY MARKET, BY VERTICAL, 2022–2027 (USD MILLION)
                       TABLE 253 DATA-CENTRIC SECURITY MARKET, BY REGION, 2016–2021 (USD MILLION)
                       TABLE 254 DATA-CENTRIC SECURITY MARKET, BY REGION, 2022–2027 (USD MILLION)
             12.1.2 BIG DATA SECURITY MARKET
                       TABLE 255 BIG DATA SECURITY MARKET, BY COMPONENT, 2014–2019 (USD MILLION)
                       TABLE 256 BIG DATA SECURITY MARKET, BY COMPONENT, 2019–2026 (USD MILLION)
                       TABLE 257 BIG DATA SECURITY MARKET, BY SOFTWARE, 2014–2019 (USD MILLION)
                       TABLE 258 BIG DATA SECURITY MARKET, BY SOFTWARE, 2019–2026 (USD MILLION)
                       TABLE 259 BIG DATA SECURITY MARKET, BY DEPLOYMENT MODE, 2014–2019 (USD MILLION)
                       TABLE 260 BIG DATA SECURITY MARKET, BY DEPLOYMENT MODE, 2019–2026 (USD MILLION)
                       TABLE 261 BIG DATA SECURITY MARKET, BY ORGANIZATION SIZE, 2014–2019 (USD MILLION)
                       TABLE 262 BIG DATA SECURITY MARKET, BY ORGANIZATION SIZE, 2019–2026 (USD MILLION)
                       TABLE 263 BIG DATA SECURITY MARKET, BY VERTICAL, 2014–2019 (USD MILLION)
                       TABLE 264 BIG DATA SECURITY MARKET, BY VERTICAL, 2019–2026 (USD MILLION)
                       TABLE 265 BIG DATA SECURITY MARKET, BY REGION, 2014–2019 (USD MILLION)
                       TABLE 266 BIG DATA SECURITY MARKET, BY REGION, 2019–2026 (USD MILLION)
             12.1.3 DATA PROTECTION MARKET
                       TABLE 267 DATA PROTECTION MARKET, BY COMPONENT, 2015–2022 (USD BILLION)
                       TABLE 268 DATA PROTECTION MARKET, BY DEPLOYMENT MODE, 2015–2022 (USD BILLION)
                       TABLE 269 DATA PROTECTION MARKET, BY ORGANIZATION SIZE, 2015–2022 (USD BILLION)
                       TABLE 270 DATA PROTECTION MARKET, BY INDUSTRY VERTICAL, 2015–2022 (USD BILLION)
                       TABLE 271 DATA PROTECTION MARKET, BY REGION, 2015–2022 (USD BILLION)
 
13 APPENDIX (Page No. - 249)
     13.1 DISCUSSION GUIDE 
     13.2 KNOWLEDGESTORE: MARKETSANDMARKETS’ SUBSCRIPTION PORTAL 
     13.3 CUSTOMIZATION OPTIONS 
     13.4 RELATED REPORTS 
     13.5 AUTHOR DETAILS 

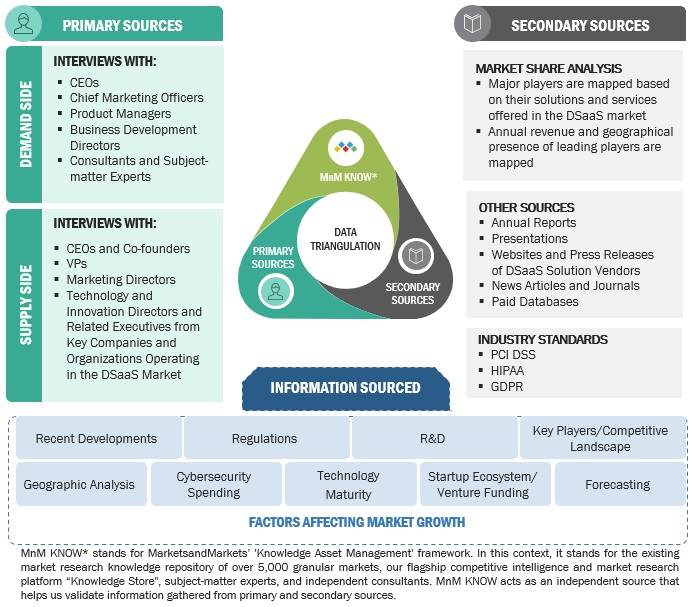
This study involved multiple steps in estimating the current size of the data security as a service (DSaaS) market. Exhaustive secondary research was carried out to collect information on the data security as a service (DSaaS) industry. The next step was to validate these findings, assumptions, and sizing with industry experts across the value chain using primary research. The top-down and bottom-up approaches were employed to estimate the total market size. After that, the market breakup and data triangulation procedures were used to estimate the market size of the segments and subsegments of the data security as a service (DSaaS) market.

Secondary Research

In the secondary research process, various sources were referred to for identifying and collecting information related to the study. Secondary sources included annual reports, press releases, and investor presentations of data security as a service (DSaaS) vendors, forums, certified publications, and whitepapers. This research was used to obtain key information related to the industry's value chain, the total pool of key players, market classification, and segmentation from the market- and technology-oriented perspectives.

Factors Considered to Estimate Regional-Level Market Size:

  • Gross Domestic Product (GDP) Growth
  • Information and Communication Technology (ICT) Security Spending
  • Recent Market Developments
  • Market Ranking Analysis of Major DSaaS Providers

Primary Research

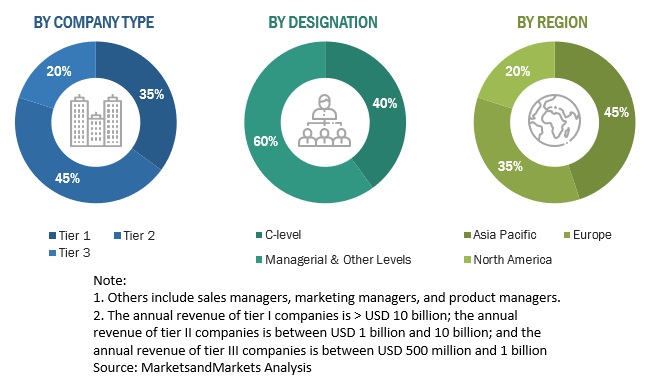
Various primary sources from the supply and demand sides were interviewed to obtain qualitative and quantitative information for this report. These sources from the supply side included various industry experts, including Chief Executive Officers (CEOs), Vice Presidents (VPs), marketing directors, technology and innovation directors, and related key executives from various companies and organizations operating in the data security as a service (DSaaS) market.

Following is the breakup of the primary interviews:
Data Security as a Service Market Size, and Share

To know about the assumptions considered for the study, download the pdf brochure

Data Triangulation

After arriving at the overall market size using the market size estimation processes explained above, the market was split into several segments and subsegments. The data triangulation and market breakup procedures were employed, wherever applicable, to complete the overall market engineering process and arrive at the exact statistics of each market segment and subsegment. The data was triangulated by studying various factors and trends from both the demand and supply sides.
Data Security as a Service Market Size, and Share

To know about the assumptions considered for the study, Request for Free Sample Report

Report Objectives

  • To define, describe, and forecast the data security as a service (DSaaS) market based on type, organization size, vertical, and region
  • To provide detailed information about the major factors (drivers, opportunities, restraints, and challenges) influencing the growth of the data security as a service (DSaaS) market
  • To forecast the data security as a service (DSaaS) market size across five main regions: North America, Europe, Asia Pacific, Latin America, and the Middle East & Africa
  • To analyze subsegments of the market with respect to individual growth trends, prospects, and contributions to the overall market
  • To profile the key players of the data security as a Service (DSaaS) market and comprehensively analyze their market size and core competencies
  • To profile the key players and comprehensively analyze their market rankings and core competencies
  • To map the companies to get competitive intelligence based on company profiles, key player strategies, and game-changing developments such as product launches, collaborations, and acquisitions
  • To track and analyze competitive developments such as product launches and enhancements, acquisitions, partnerships, and collaborations in the DSaaS market

Available Customization

With the given market data, MarketsandMarkets offers customizations based on company-specific needs. The following customization options are available for the report:

Geographic Analysis

  • Further breakup of the Asia Pacific market into countries contributing 75% to the regional market size
  • Further breakup of the North American market into countries contributing 75% to the regional market size
  • Further breakup of the Latin American market into countries contributing 75% to the regional market size
  • Further breakup of the Middle Eastern and African market into countries contributing 75% to the regional market size
  • Further breakup of the European market into countries contributing 75% to the regional market size

Company Information

  • Detailed analysis and profiling of additional market players (up to 5)
Custom Market Research Services

We will customize the research for you, in case the report listed above does not meet with your exact requirements. Our custom research will comprehensively cover the business information you require to help you arrive at strategic and profitable business decisions.

Request Customization

Instant Answers with GPT - Ask Now!

Ask real questions. Get complete answers !
Report Code
TC 8552
Published ON
Jan, 2023
Choose License Type
BUY NOW
  • SHARE
X
Request Customization
Speak to Analyst
Speak to Analyst
OR FACE-TO-FACE MEETING
PERSONALIZE THIS RESEARCH
  • Triangulate with your Own Data
  • Get Data as per your Format and Definition
  • Gain a Deeper Dive on a Specific Application, Geography, Customer or Competitor
  • Any level of Personalization
REQUEST A FREE CUSTOMIZATION
LET US HELP YOU!
  • What are the Known and Unknown Adjacencies Impacting the Data Security as a Service Market
  • What will your New Revenue Sources be?
  • Who will be your Top Customer; what will make them switch?
  • Defend your Market Share or Win Competitors
  • Get a Scorecard for Target Partners
CUSTOMIZED WORKSHOP REQUEST
  • Call Us
  • +1-888-600-6441 (Corporate office hours)
  • +1-888-600-6441 (US/Can toll free)
  • +44-800-368-9399 (UK office hours)
CONNECT WITH US
ABOUT TRUST ONLINE
©2024 MarketsandMarkets Research Private Ltd. All rights reserved
DMCA.com Protection Status
Website Feedback